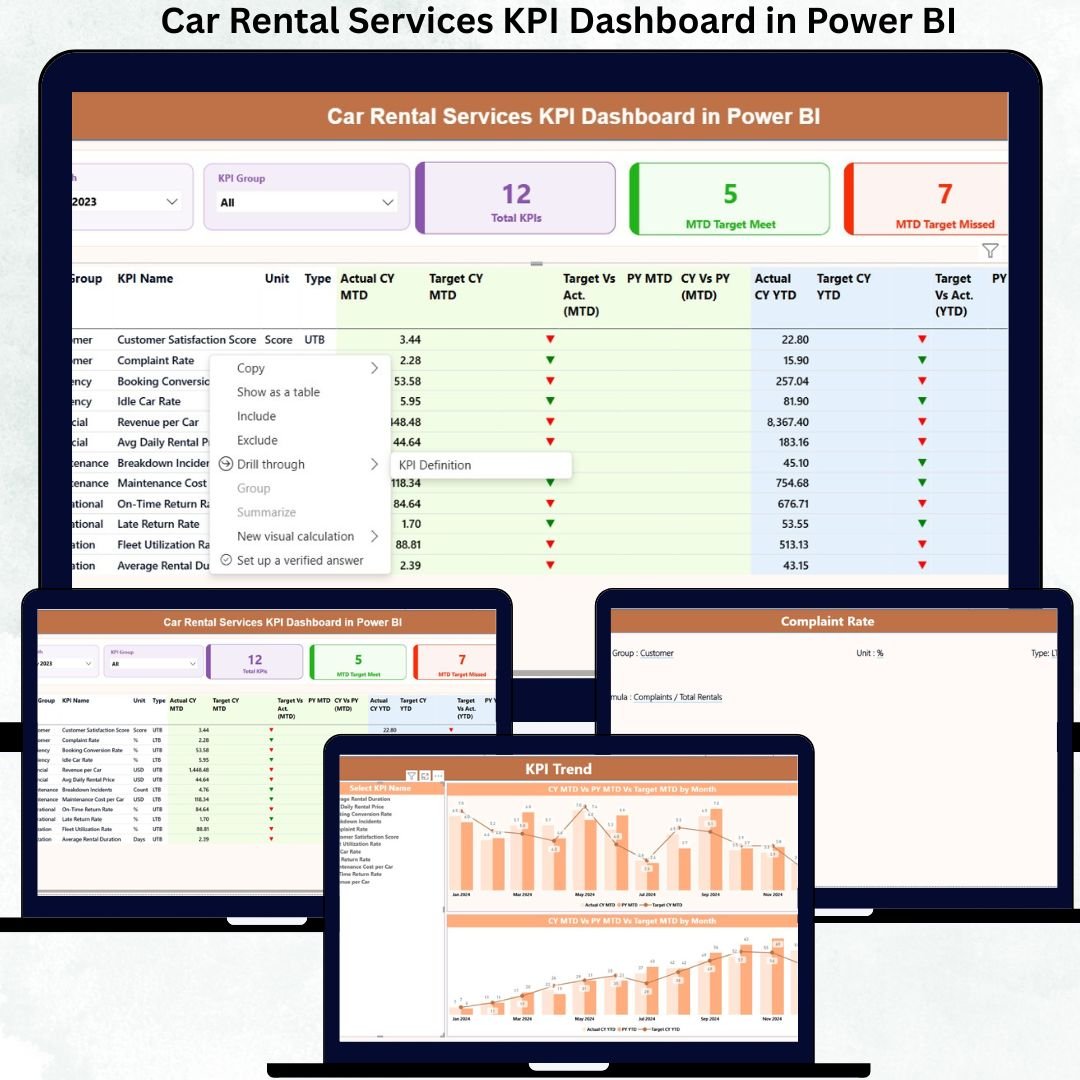
Managing a car rental business today requires speed, accuracy, and instant insights. Customers expect quick booking confirmations, timely vehicle delivery, clean cars, fast check-in/check-out, and transparent communication. With rising competition and changing customer behavior, rental companies cannot rely on manual spreadsheets or delayed monthly reports. They need real-time, data-driven visibility — and that’s exactly what the Car Rental Services KPI Dashboard in Power BI delivers.
This ready-to-use dashboard converts rental data from Excel into powerful visuals, trend charts, KPI cards, and performance summaries. Whether you want to track fleet utilization, customer complaints, daily revenue, booking trends, or turnaround time, this dashboard provides everything in one clean, interactive, and user-friendly format.
With just one click, managers can filter by month, KPI group, or performance category and instantly see whether targets are being met. The dashboard also displays MTD (Month-to-Date) and YTD (Year-to-Date) comparisons along with previous-year benchmarks. This makes it easier to identify improvements, monitor operational gaps, and make smart business decisions in real time.
Below is everything you get inside this powerful digital product 👇
✨ Key Features of Car Rental Services KPI Dashboard in Power BI
-
📊 Fully Automated Dashboard: Just update your Excel file and refresh — all KPIs, charts, and cards update instantly.
-
📅 Interactive Slicers: Filter by month and KPI group to analyze performance with ease.
-
📈 MTD & YTD KPIs: Track targets, actual performance, and previous-year comparisons.
-
📉 KPI Status Indicators: Conditional up/down arrows show immediate performance direction.
-
💼 3 Structured Pages: Summary Page, Trend Analysis Page, and KPI Definition Page for complete clarity.
-
🔍 Drill-Through Support: Understand KPI formulas, definitions, and types with a single click.
📦 What’s Inside the Car Rental Services KPI Dashboard in Power BI
Inside this digital product, you get:
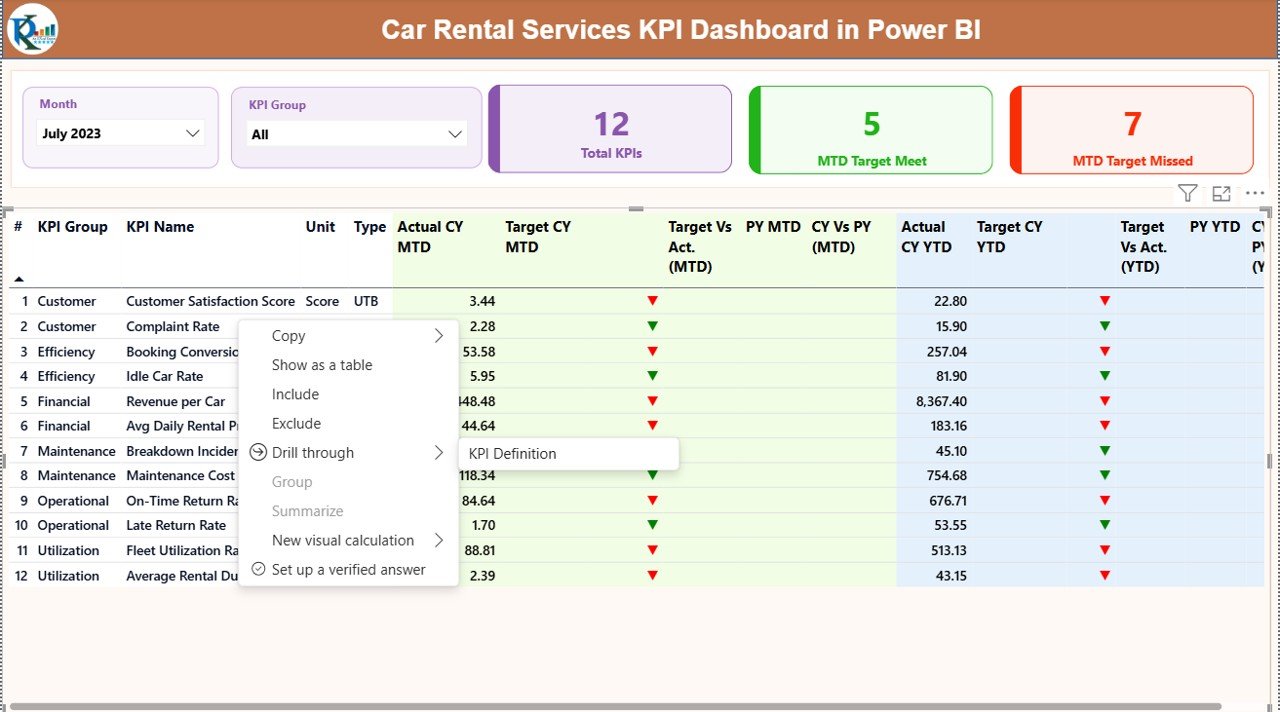
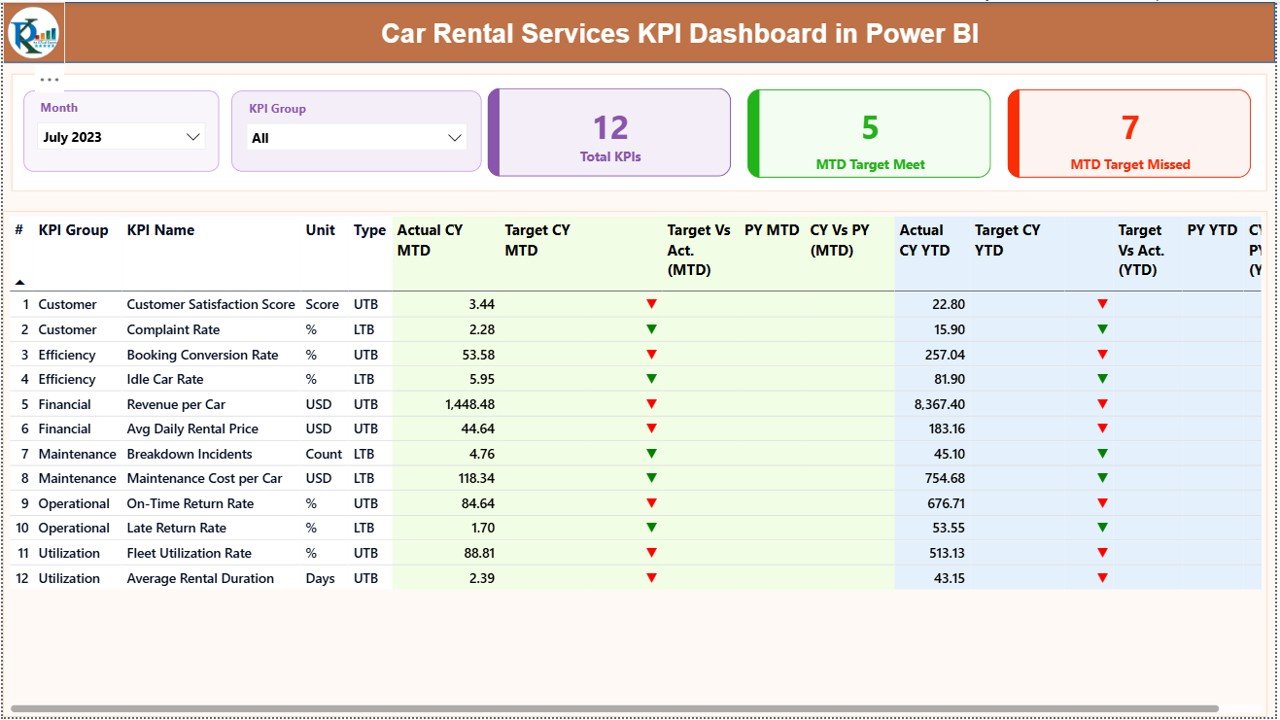
1️⃣ Summary Page (Main Dashboard)
This is the core dashboard where managers view:
-
Total KPIs count
-
MTD target met vs missed
-
KPI Group & Month Slicers
-
Detailed KPI comparison table showing MTD, YTD, targets, previous-year data, and performance icons
This page offers a complete business snapshot in seconds.
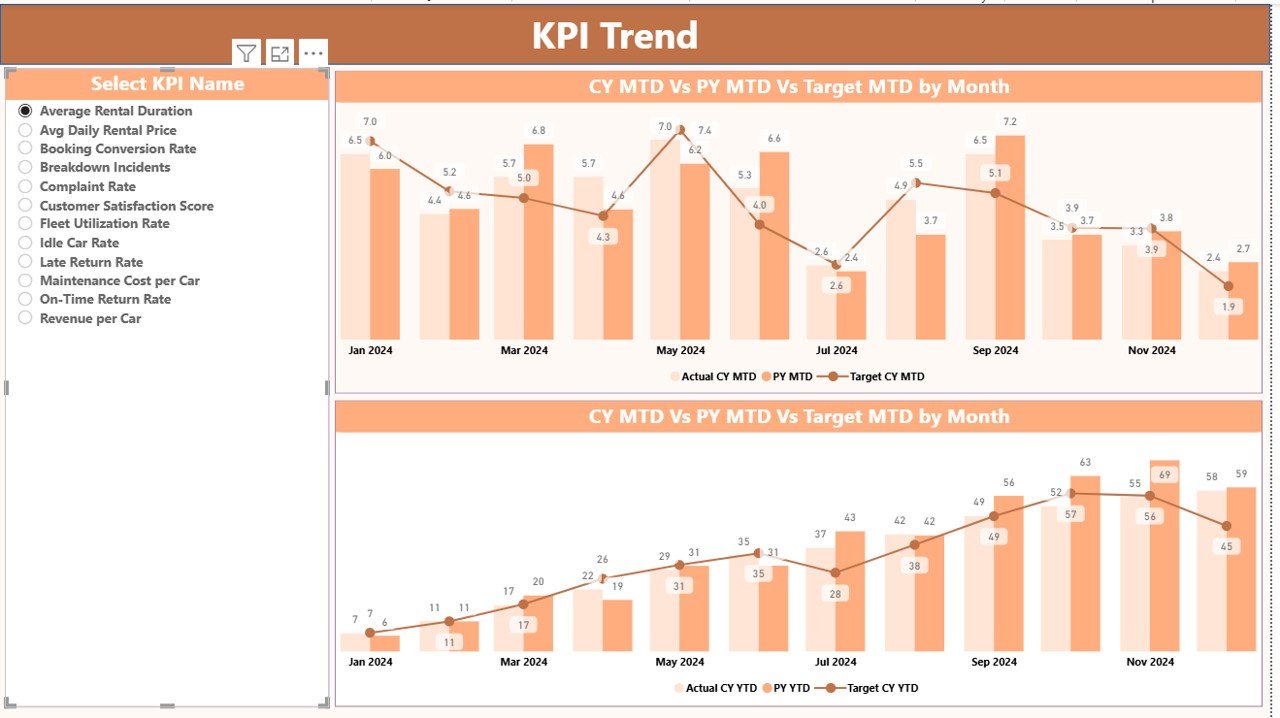
2️⃣ KPI Trend Page
This page helps you view monthly patterns and track whether performance is improving or declining. It includes:
-
MTD Trend Chart (CY Actual, PY Actual, CY Target)
-
YTD Trend Chart (CY Actual, PY Actual, CY Target)
Perfect for forecasting, budgeting, and strategic planning.
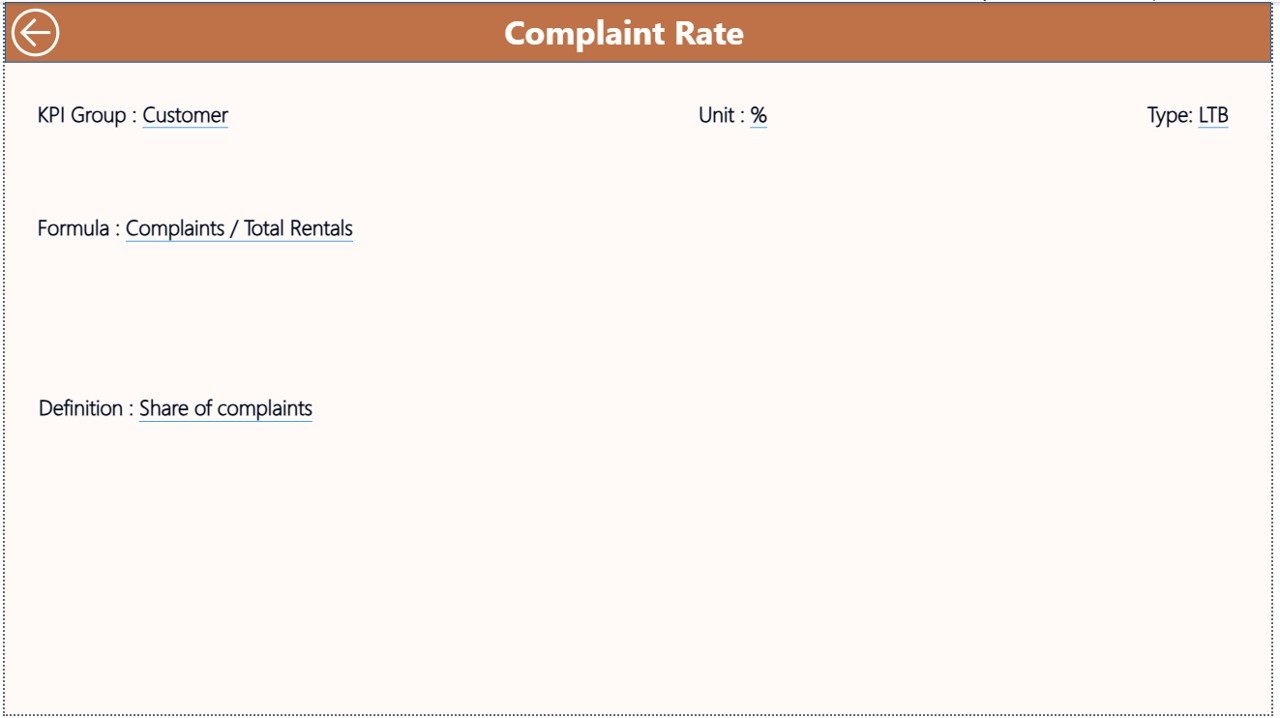
3️⃣ KPI Definition Page
A drill-through page showing:
-
KPI formulas
-
KPI meaning
-
KPI type (UTB/LTB)
-
Calculation methods
This page improves team understanding and ensures KPI consistency.
🛠️ How to Use the Car Rental Services KPI Dashboard in Power BI
Using this dashboard is extremely simple — no coding expertise required.
Step 1: Update Excel Sheets
Fill in the three Excel sheets included with the product:
-
Input_Actual
-
Input_Target
-
KPI Definition
Step 2: Open Power BI File
Load the Excel file and refresh the dashboard.
Step 3: Select Month & KPI Group
Use slicers to explore detailed insights instantly.
Step 4: Analyze KPI Status
Review MTD and YTD icons, performance gaps, and trends.
Step 5: Make Data-Driven Decisions
Use insights to improve fleet planning, customer experience, revenue, and operational efficiency.
Within minutes, anyone in your team can analyze performance without complicated reports or formulas.
👥 Who Can Benefit from This Car Rental Services KPI Dashboard in Power BI
This dashboard is perfect for:
-
🚗 Car Rental Companies
-
🏢 Travel & Transport Agencies
-
🌐 Online Rental Platforms
-
📍 Branch Managers & Operations Teams
-
📊 Business Analysts & Reporting Teams
-
💼 Decision Makers Who Need Real-Time Insights
If you want faster decision-making, clearer performance tracking, and stronger customer satisfaction, this dashboard is the ideal solution.
### Click here to read the Detailed blog post
Watch the step-by-step video tutorial:


Reviews
There are no reviews yet.