Managing business valuation metrics manually can quickly become complicated, time-consuming, and prone to errors. Financial professionals, outsourced accounting teams, and business analysts need a structured system that allows them to monitor important valuation KPIs efficiently while providing clear visual insights.
The Business Valuation KPI Dashboard in Excel is a powerful and ready-to-use Excel template designed to simplify KPI monitoring for business valuation and outsourced accounting activities. This professionally designed dashboard allows users to track, analyze, and compare key performance indicators using an interactive interface and dynamic visualizations.
Instead of relying on scattered spreadsheets and manual calculations, this template provides a centralized dashboard where all valuation metrics can be monitored in one place. With dynamic month selection, performance indicators, and trend charts, businesses can easily evaluate their financial performance and make informed strategic decisions.
Whether you are an outsourced accounting firm, financial consultant, valuation analyst, or business owner, this dashboard helps transform raw financial data into meaningful insights.
Key Features of Business Valuation KPI Dashboard in Excel
📊 Interactive KPI Dashboard
Monitor all business valuation KPIs in a single, well-organized dashboard that provides instant insights into performance.
📅 Dynamic Month Selection
Select any month from the dropdown menu and instantly update the entire dashboard for that period.
📈 MTD and YTD Performance Tracking
Track Month-To-Date (MTD) and Year-To-Date (YTD) KPI values for accurate financial monitoring.
🎯 Target vs Actual Comparison
Quickly identify performance gaps by comparing actual results with predefined targets.
📉 Previous Year Comparison
Analyze year-over-year performance using previous year KPI values.
🔺 Conditional Formatting Indicators
Up and down arrows visually highlight whether performance is improving or declining.
📊 KPI Trend Analysis Charts
Understand performance patterns over time through dynamic trend charts.
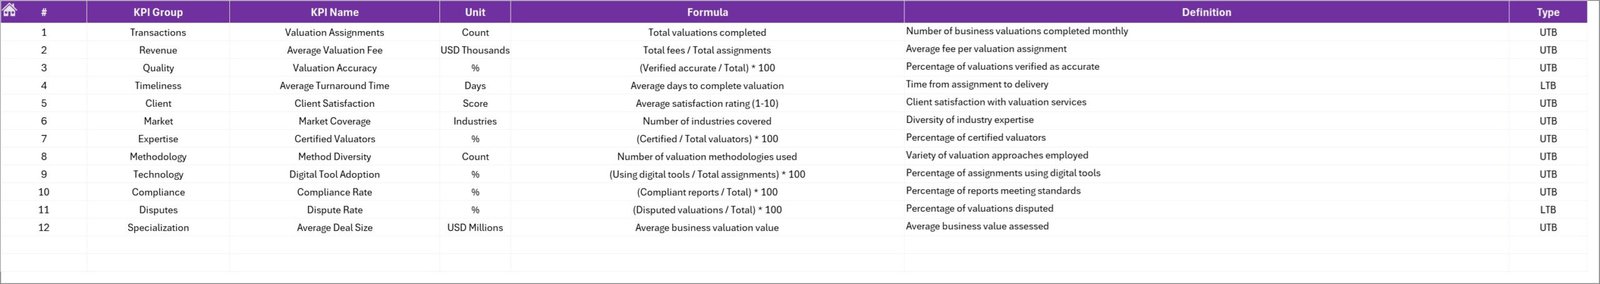
🧾 Comprehensive KPI Definitions
Each KPI includes details such as formula, definition, KPI group, and measurement unit.
⚡ User-Friendly Navigation Buttons
Quick navigation buttons allow seamless movement between dashboard sheets.
📁 Structured Data Input Sheets
Separate sheets for Actual, Target, and Previous Year data ensure organized data management.
What’s Inside the Business Valuation KPI Dashboard in Excel
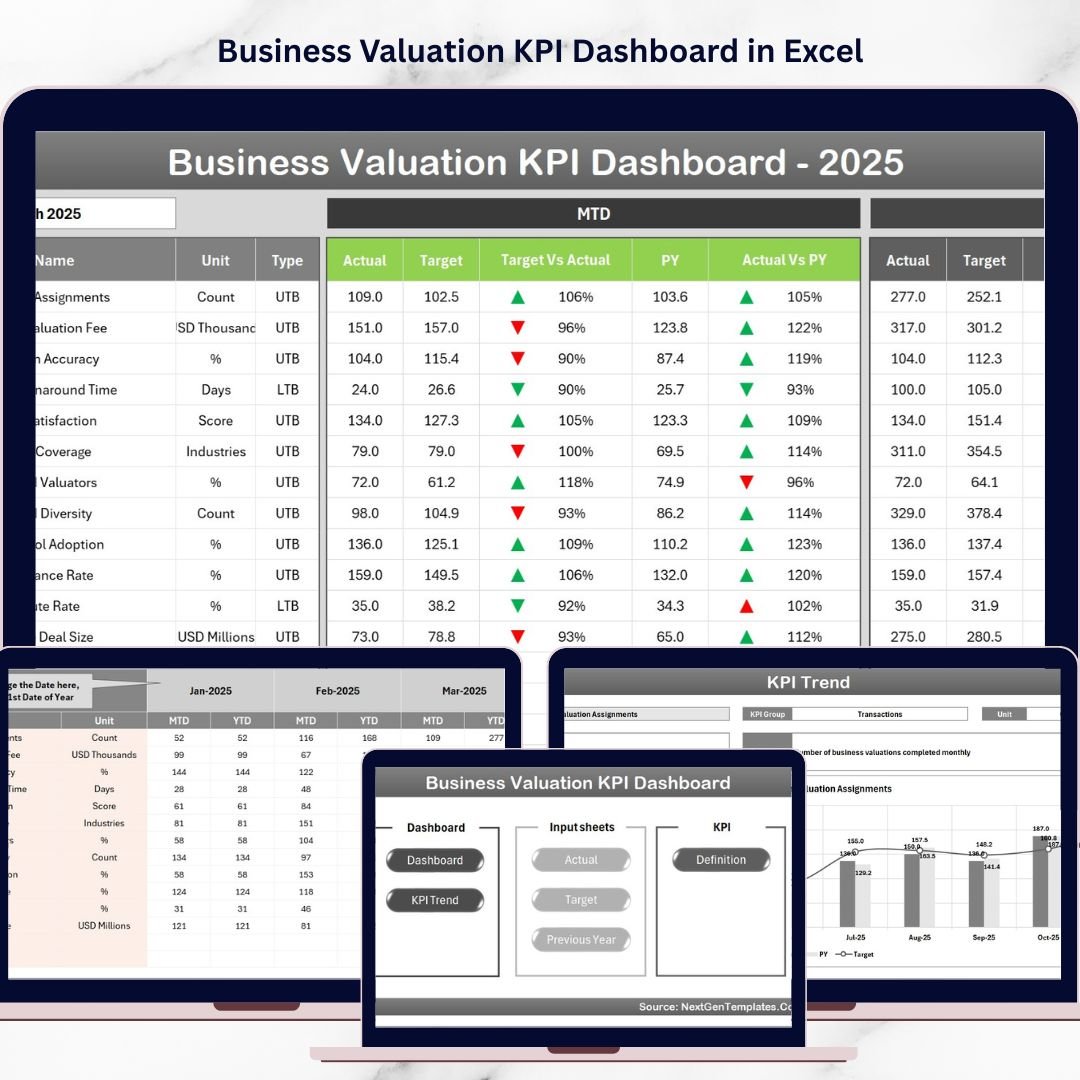
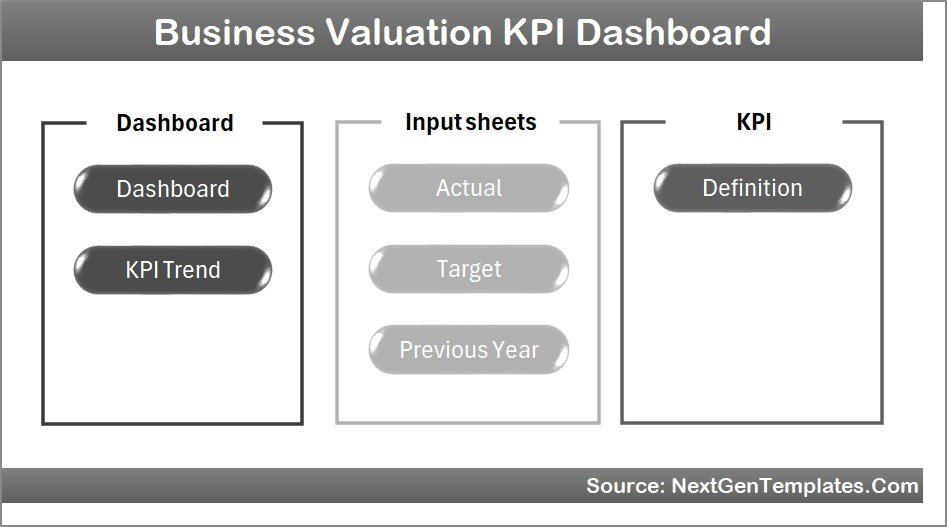
This Excel template contains seven well-structured worksheets designed to provide a complete KPI monitoring system.
🏠 Home Sheet
The home sheet acts as the dashboard index page. It contains navigation buttons that allow users to jump directly to different sheets in the workbook, ensuring smooth navigation.
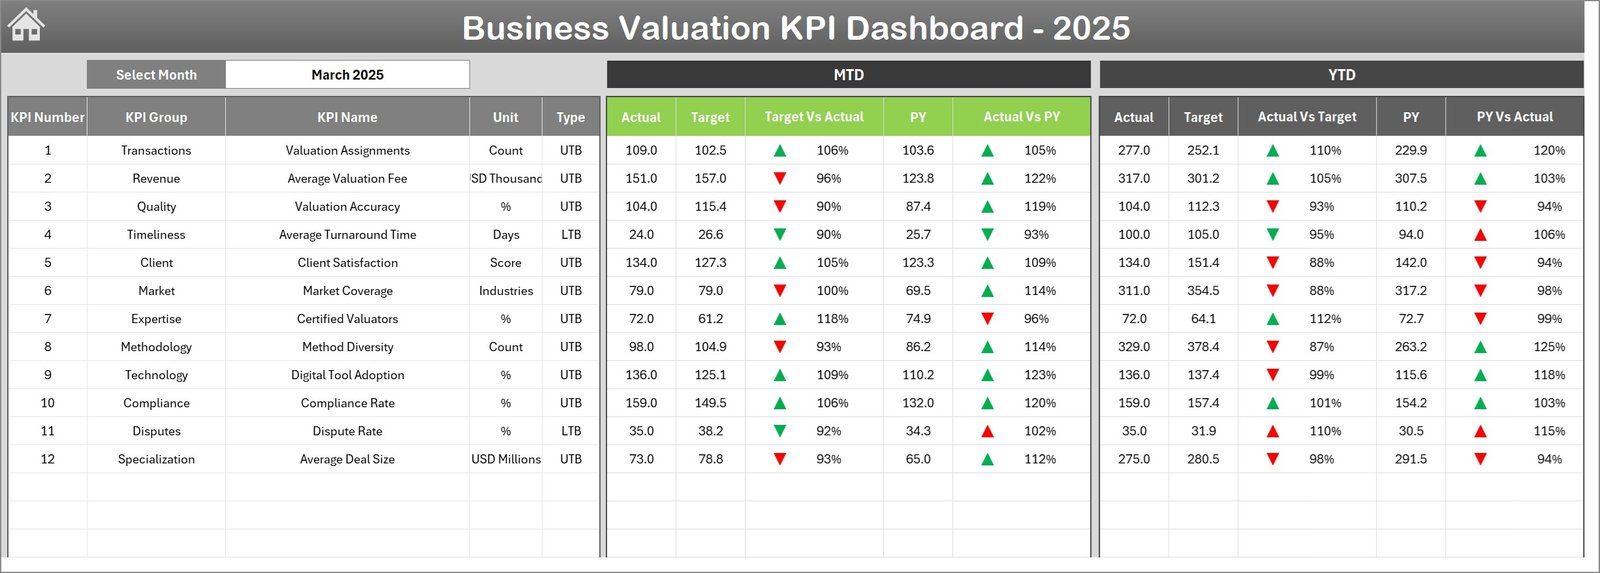
📊 Dashboard Sheet
This is the main dashboard where all KPIs are displayed. Users can select the reporting month using the dropdown menu, and the dashboard instantly updates the data for that period.
The dashboard includes:
-
MTD Actual, Target, and Previous Year values
-
YTD Actual, Target, and Previous Year values
-
Target vs Actual comparison indicators
-
Previous Year vs Actual performance indicators
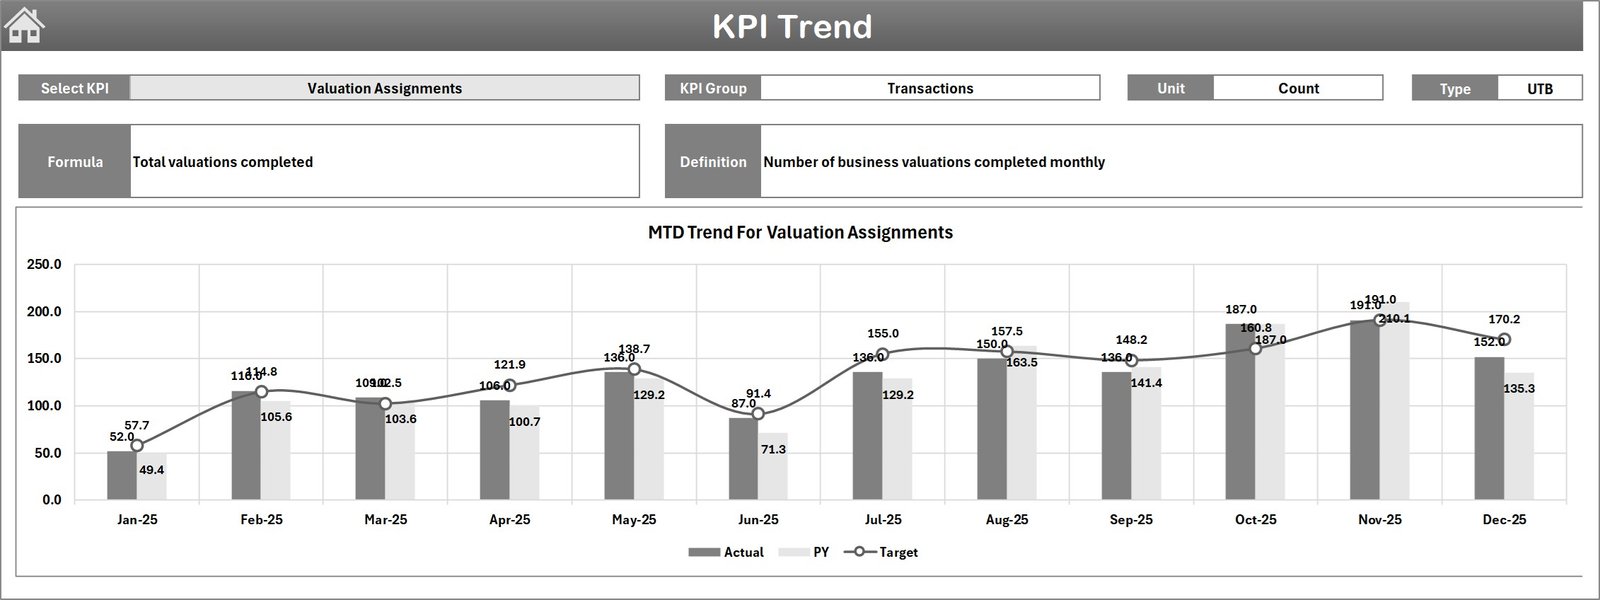
📈 KPI Trend Sheet
This sheet allows users to analyze trends for a selected KPI. Users can choose a KPI from the dropdown list and view its group, unit, type, formula, and definition along with a trend chart.
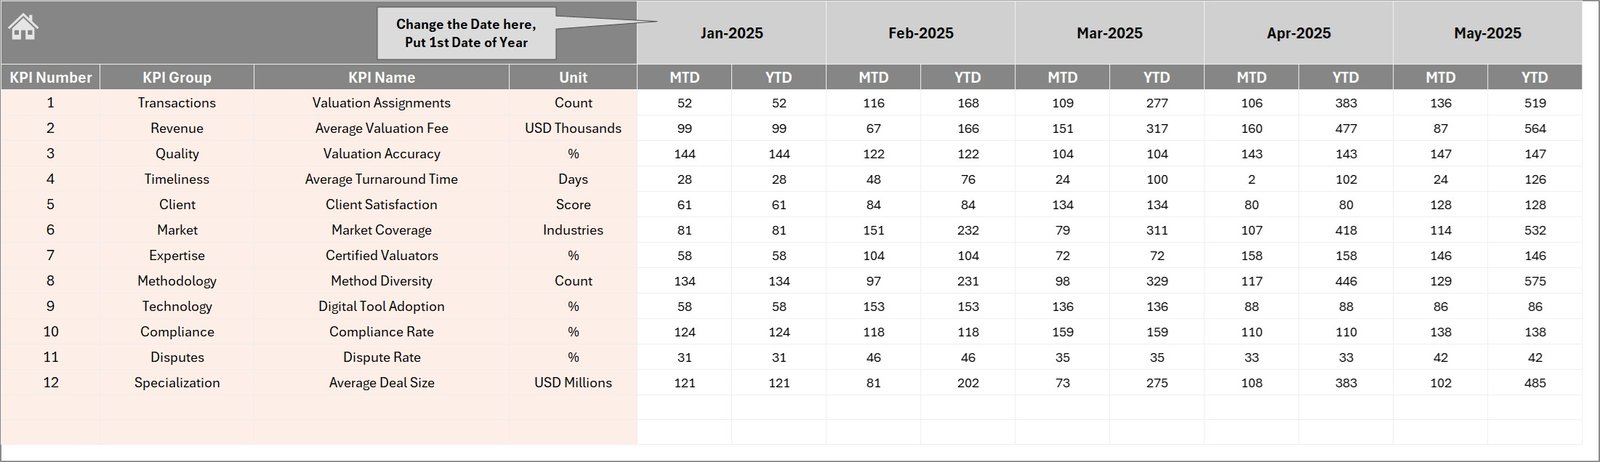
📥 Actual Numbers Input Sheet
Users can enter the actual KPI numbers for each month. The starting month can be adjusted, making the dashboard flexible for different fiscal calendars.
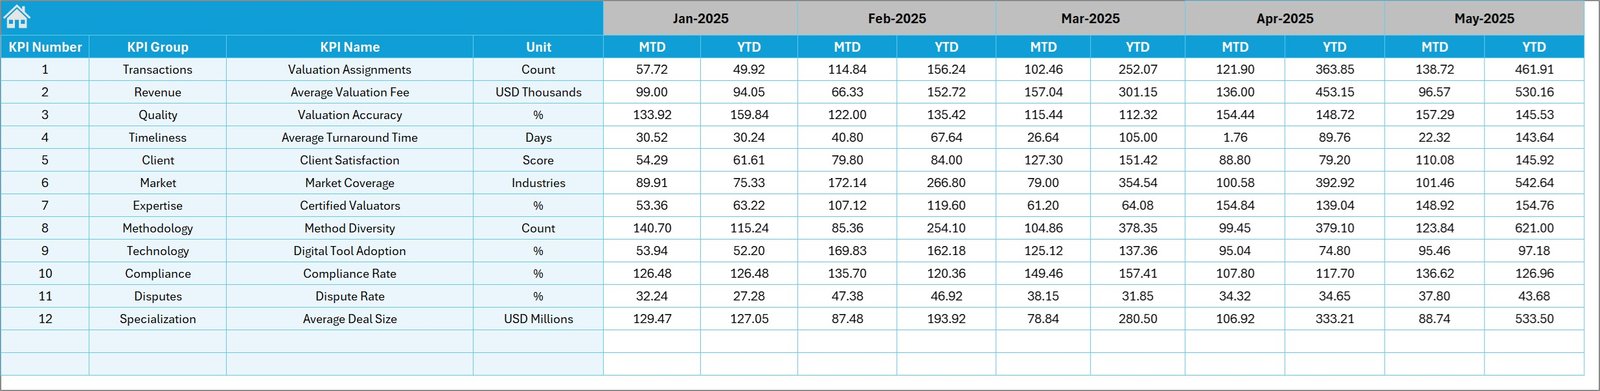
🎯 Target Numbers Input Sheet
Enter KPI targets for each period, which serve as benchmarks for evaluating performance.
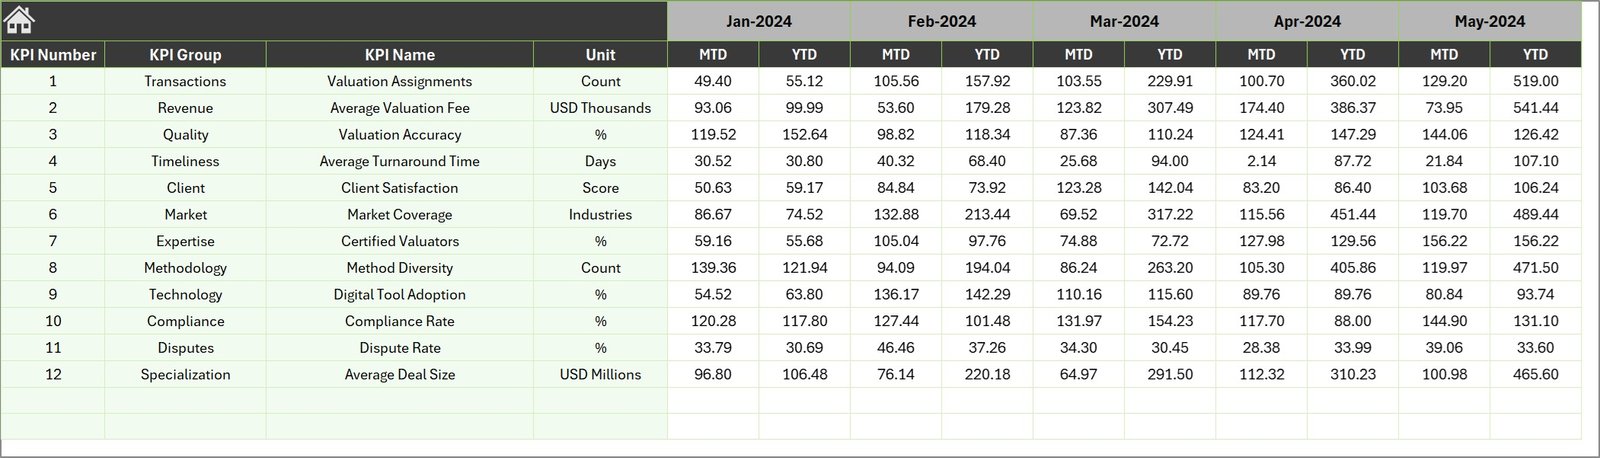
📊 Previous Year Numbers Sheet
This sheet stores historical KPI data that enables year-over-year comparison and trend analysis.
📘 KPI Definition Sheet
This is the backbone of the dashboard where users define KPI names, groups, units, formulas, definitions, and KPI type (Upper The Better or Lower The Better).
How to Use the Business Valuation KPI Dashboard in Excel
Using this dashboard is extremely simple and does not require advanced Excel skills.
1️⃣ Enter KPI definitions in the KPI Definition sheet.
2️⃣ Input target KPI values in the Target sheet.
3️⃣ Add previous year KPI numbers for comparison.
4️⃣ Enter actual KPI data regularly in the Actual sheet.
5️⃣ Select the desired month in the dashboard to update KPI performance automatically.
6️⃣ Analyze performance trends using the KPI Trend sheet.
With just a few simple steps, you can transform raw KPI data into powerful business insights.
Who Can Benefit from This Business Valuation KPI Dashboard in Excel
This dashboard is ideal for professionals who need to monitor financial performance and valuation metrics.
👨💼 Outsourced Accounting Firms – Track client KPIs and deliver data-driven insights.
📊 Financial Analysts – Monitor financial ratios and valuation metrics effectively.
🏢 Business Owners & Executives – Evaluate company performance quickly.
📈 Consultants & Advisors – Provide strategic insights using KPI analysis.
💼 Finance & Accounting Teams – Improve reporting and performance tracking.
🎓 Students & Financial Researchers – Learn KPI monitoring and valuation analysis.
By implementing this dashboard, organizations can streamline KPI tracking, improve reporting efficiency, and support smarter financial decisions.
Click hare to read the Detailed blog post
Visit our YouTube channel to learn step-by-step video tutorials
https://youtube.com/@PKAnExcelExpert