
Software teams operate at high speed, and product quality depends heavily on how quickly bugs are found, fixed, retested, and closed. Without the right monitoring system, teams struggle with unresolved bugs, unclear priorities, slow turnaround time, and overloaded backlogs. The Bug Resolution KPI Dashboard in Google Sheets gives development and QA teams a simple, powerful, and real-time reporting tool to track every stage of the defect life cycle. It ensures higher quality, faster releases, and better customer satisfaction.
This ready-to-use dashboard helps teams understand the health of their bug pipeline through KPIs that measure detection speed, resolution efficiency, backlog size, aging issues, reopen rates, defect leakage, and developer performance. It updates instantly when you change the month, targets, or actual values. No technical skills or coding are required—Google Sheets handles all calculations, charts, and trend visuals automatically.
✨ Key Features of the Bug Resolution KPI Dashboard in Google Sheets
🐞 1. Real-Time Bug Analysis
Monitor how bugs move across stages—identified, assigned, fixed, retested, reopened, closed—using clear and meaningful visuals.
📅 2. MTD & YTD KPI Tracking
View Month-to-Date (MTD) and Year-to-Date (YTD) metrics including:
-
Actual
-
Target
-
Previous Year
-
Target vs Actual
-
Previous Year vs Actual
This helps teams compare performance instantly.
📊 3. Trend Analysis with KPI Drilldown
Select any KPI from a dropdown and analyze 12-month performance using dynamic line charts. Identify trends, behavior patterns, and bottlenecks.
🔍 4. Clean Data Entry Sheets
Actual, Target, and Previous Year sheets are structured to avoid errors. Simply enter numbers and the dashboard updates automatically.
⚡ 5. Conditional Formatting Indicators
Smart arrows highlight performance:
-
🟢 Green → Improvement
-
🔴 Red → Decline
-
🟡 Neutral → Stable
Managers can understand KPI behavior within seconds.
📦 What’s Inside the Bug Resolution KPI Dashboard in Google Sheets
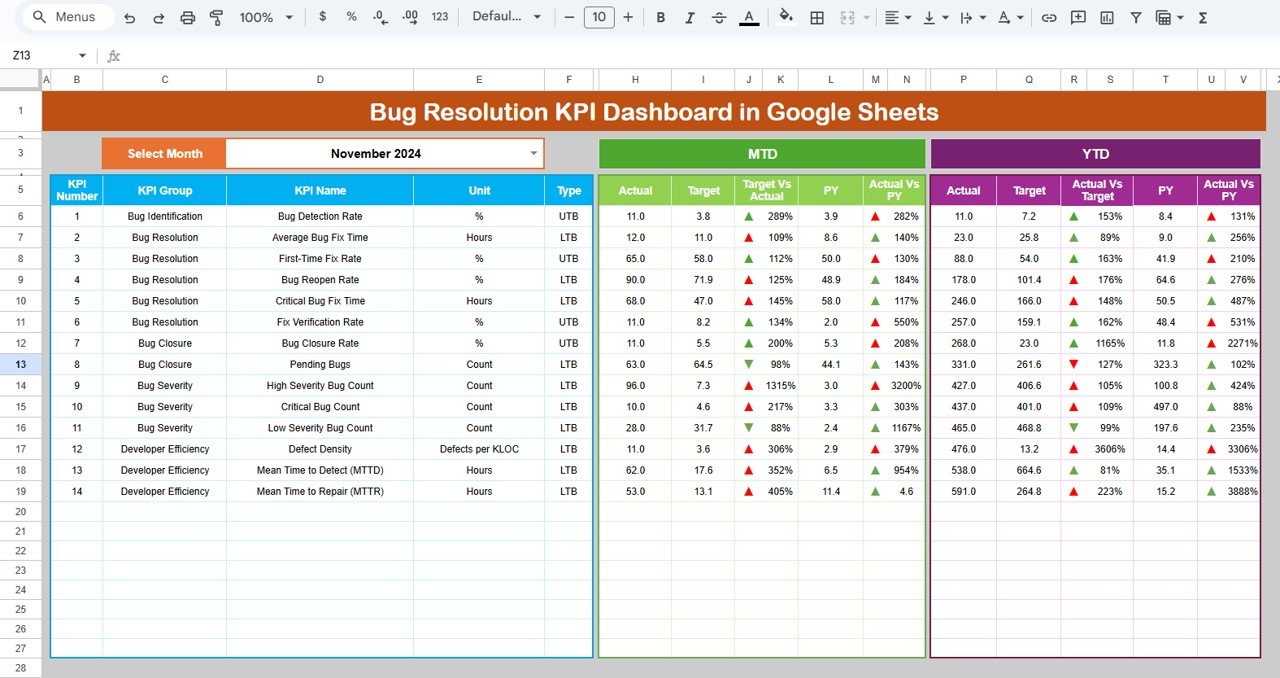
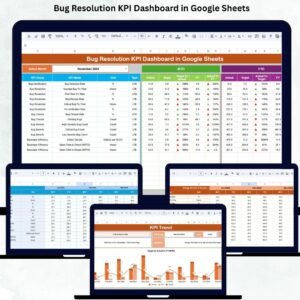
📌 Dashboard Sheet (Main Page)
This is the central command center. When you change the month in cell D3, the whole dashboard recalculates instantly. It shows:
-
MTD Actual vs Target vs Previous Year
-
YTD Actual vs Target vs Previous Year
-
Performance arrows
-
All key bug-resolution KPIs
Perfect for sprint reviews, weekly standups, and leadership presentations.
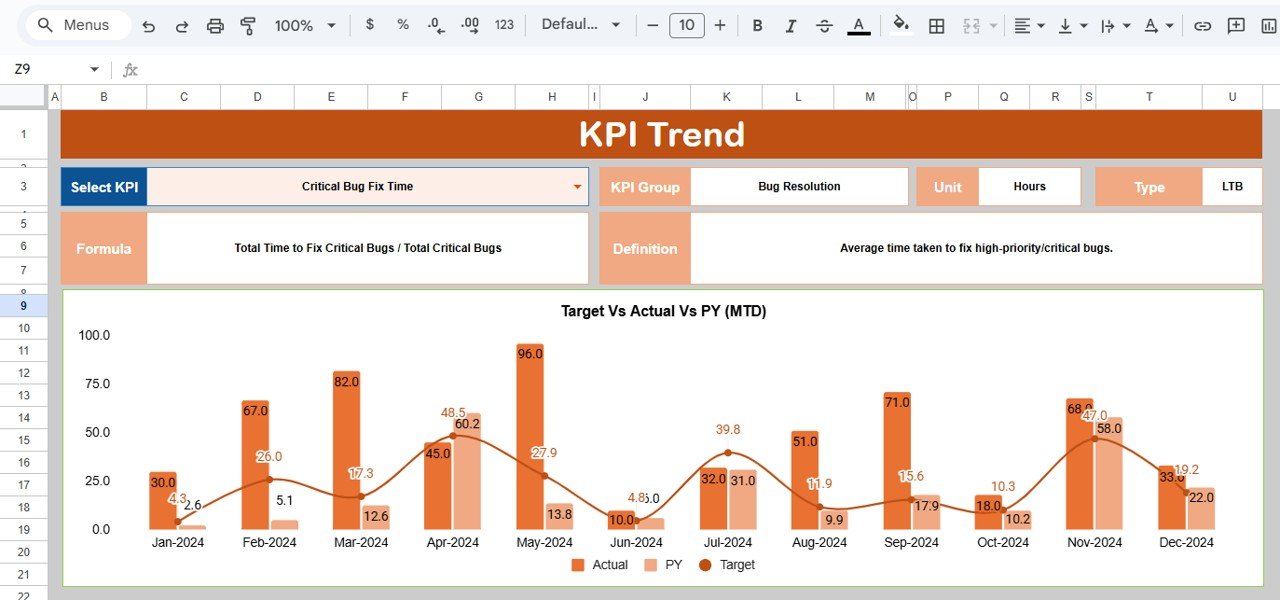
📈 KPI Trend Sheet
Choose any KPI using a dropdown filter and display:
-
KPI Group
-
Unit
-
KPI Type (UTB or LTB)
-
Formula
-
Definition
-
12-Month Trend Chart
This is extremely useful for identifying delays, seasonal bug patterns, and long-term improvement.
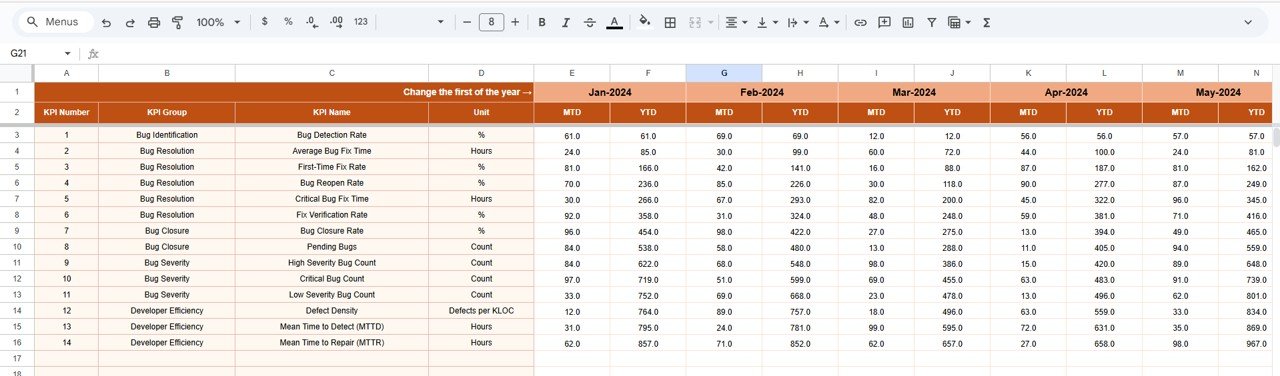
📝 Actual Number Sheet
Enter MTD and YTD performance numbers.
Choose the first month of the year in cell E1, and the sheet auto-aligns your data.
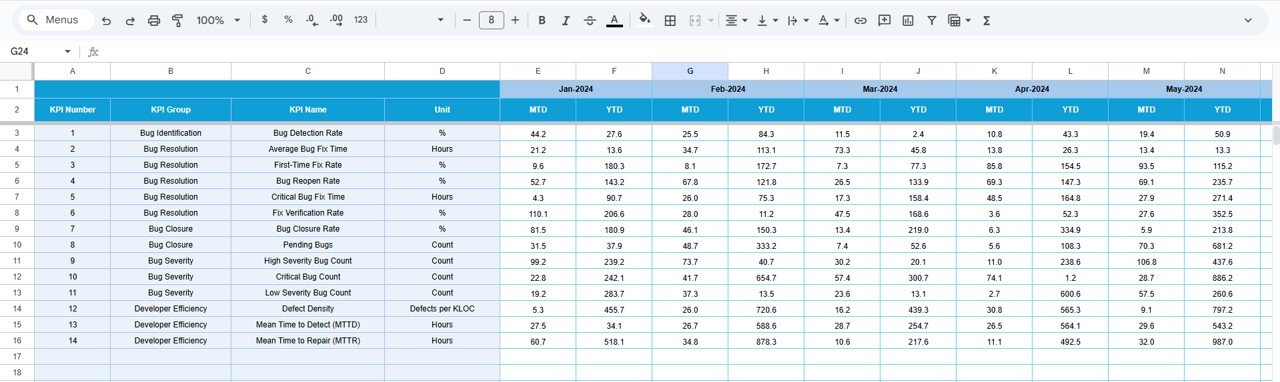
🎯 Target Number Sheet
Set monthly and annual targets for:
-
Bug count reduction
-
Resolution speed
-
Defect leakage
-
Reopen rate
-
Developer productivity
Targets allow teams to measure progress against expectations.
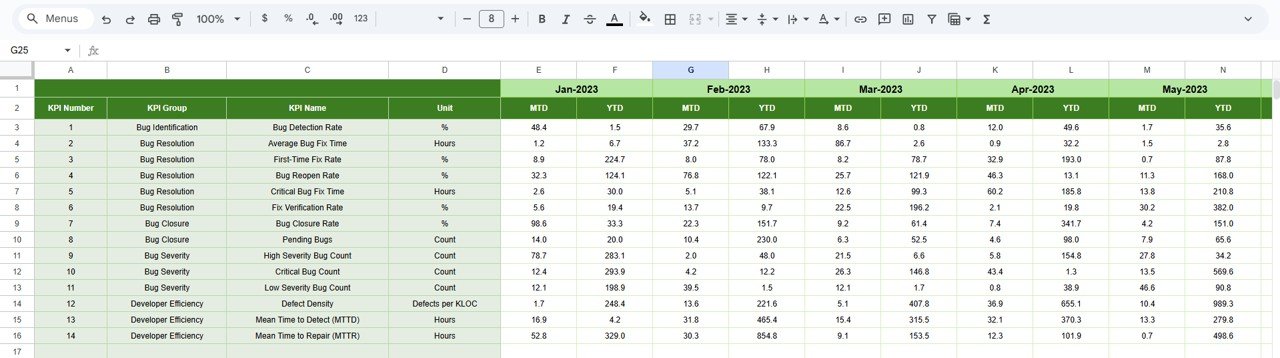
📂 Previous Year Data Sheet
Stores all last-year performance numbers.
This sheet enables meaningful YOY comparisons and long-term improvement tracking.
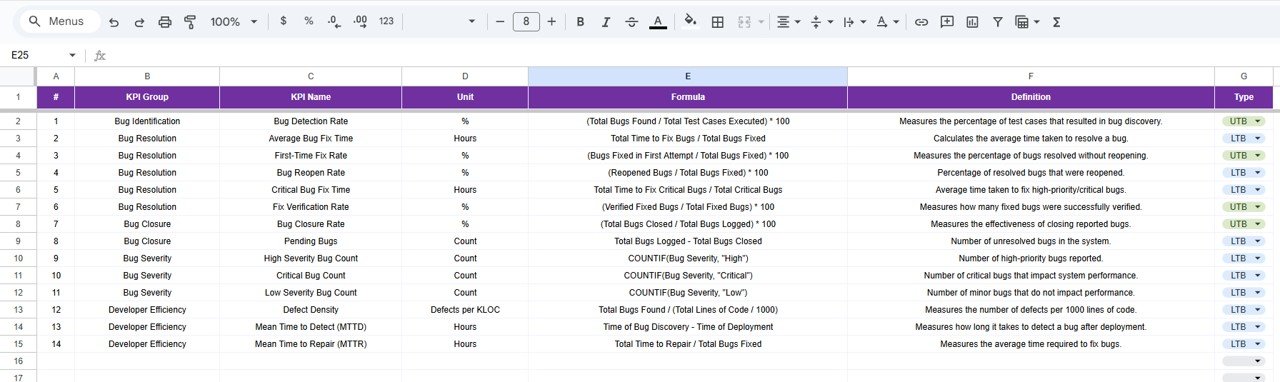
📚 KPI Definition Sheet
This sheet ensures clarity and standardization. It includes:
-
KPI Name
-
KPI Group
-
Formula
-
Unit
-
Definition
-
KPI Type (Lower the Better or Upper the Better)
Great for onboarding new developers and QA team members.
🎯 Who Can Benefit from the Bug Resolution KPI Dashboard in Google Sheets
🧑💻 Development Teams
Track resolution cycles and improve code quality.
🧪 QA & Testing Teams
Understand defect patterns and reduce leakage.
📋 Project Managers
Monitor progress, risks, and delays.
🚀 Product Owners
Ensure customer-impacting bugs are resolved faster.
📈 Leadership Teams
Get complete visibility into software quality trends.
Click here to read the Detailed blog post
Watch the step-by-step video tutorial:


Reviews
There are no reviews yet.