Struggling to manage book fair data across multiple sources? 😓
The Book Fairs Dashboard in Power BI is your all-in-one solution to track performance, boost engagement, and maximize profitability 🚀.
In today’s dynamic event industry, handling visitor attendance, vendor performance, and revenue manually can slow you down. However, this powerful and ready-to-use dashboard transforms complex data into interactive visuals, real-time KPIs, and actionable insights.
As a result, you can make faster, smarter, and data-driven decisions—all from one centralized dashboard.
🚀 Key Feature of Book Fairs Dashboard in Power BI
✅ 📊 Interactive Power BI Dashboard
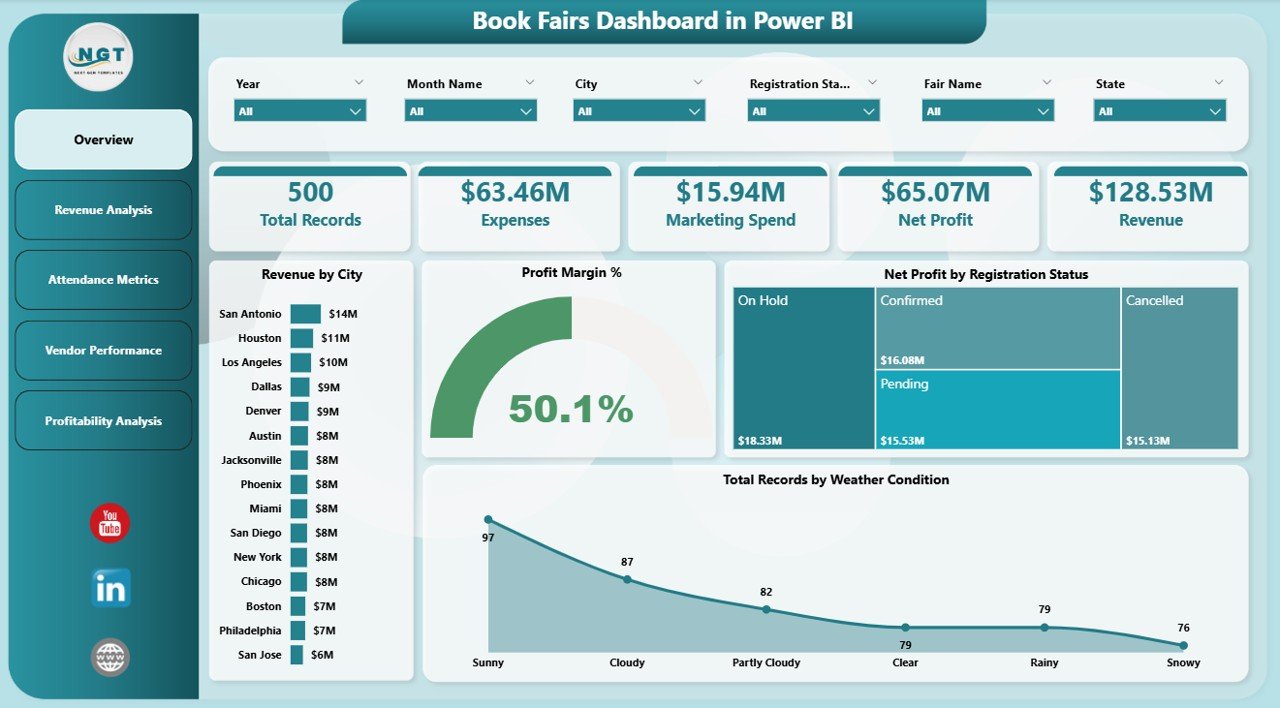
Analyze book fair data using dynamic visuals and slicers.
✅ 📈 Real-Time KPI Tracking
Monitor revenue, profit margin, attendance, and vendor performance.
✅ 🎯 Multi-Page Analysis
Explore insights across 5 powerful analytical pages.
✅ 🔍 Advanced Filtering (Slicers)
Customize analysis by city, month, exhibitor type, and weather.
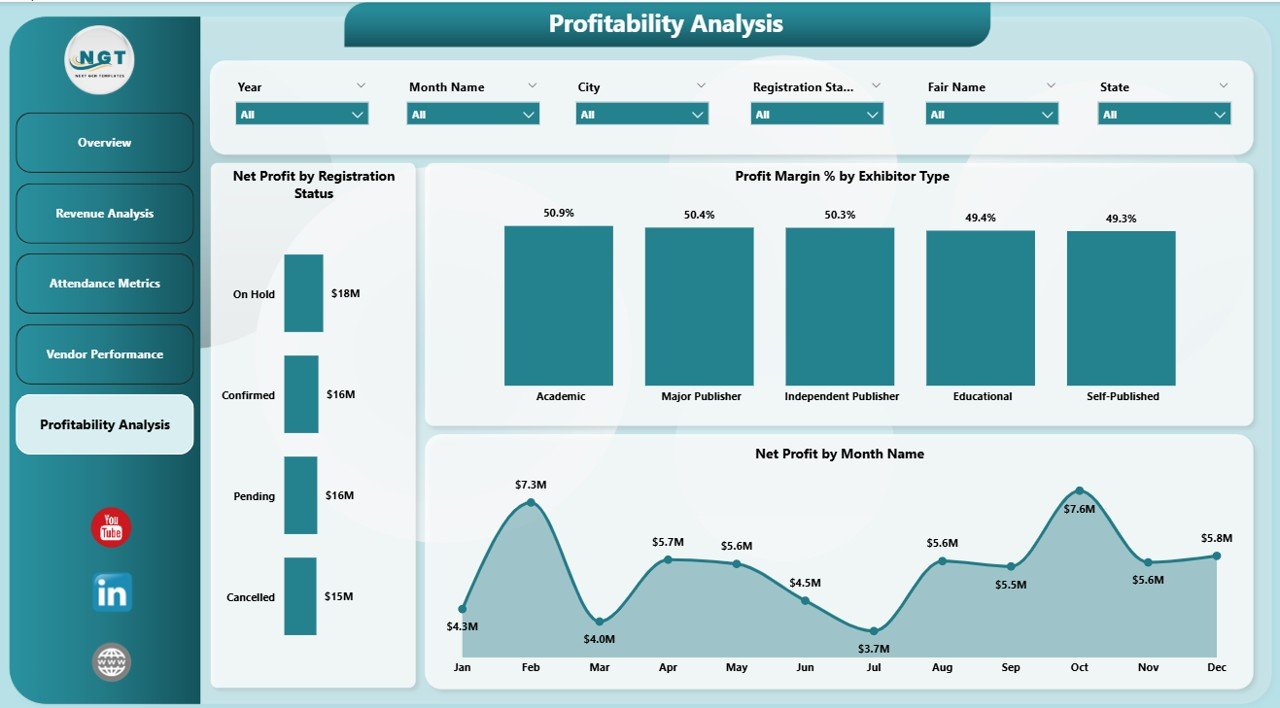
✅ 💰 Revenue & Profit Insights
Identify high-performing fairs and optimize strategies.
✅ 👥 Attendance & Engagement Analysis
Understand visitor trends and improve marketing.
✅ ⚡ Automated Data Processing
Save time by eliminating manual reporting.
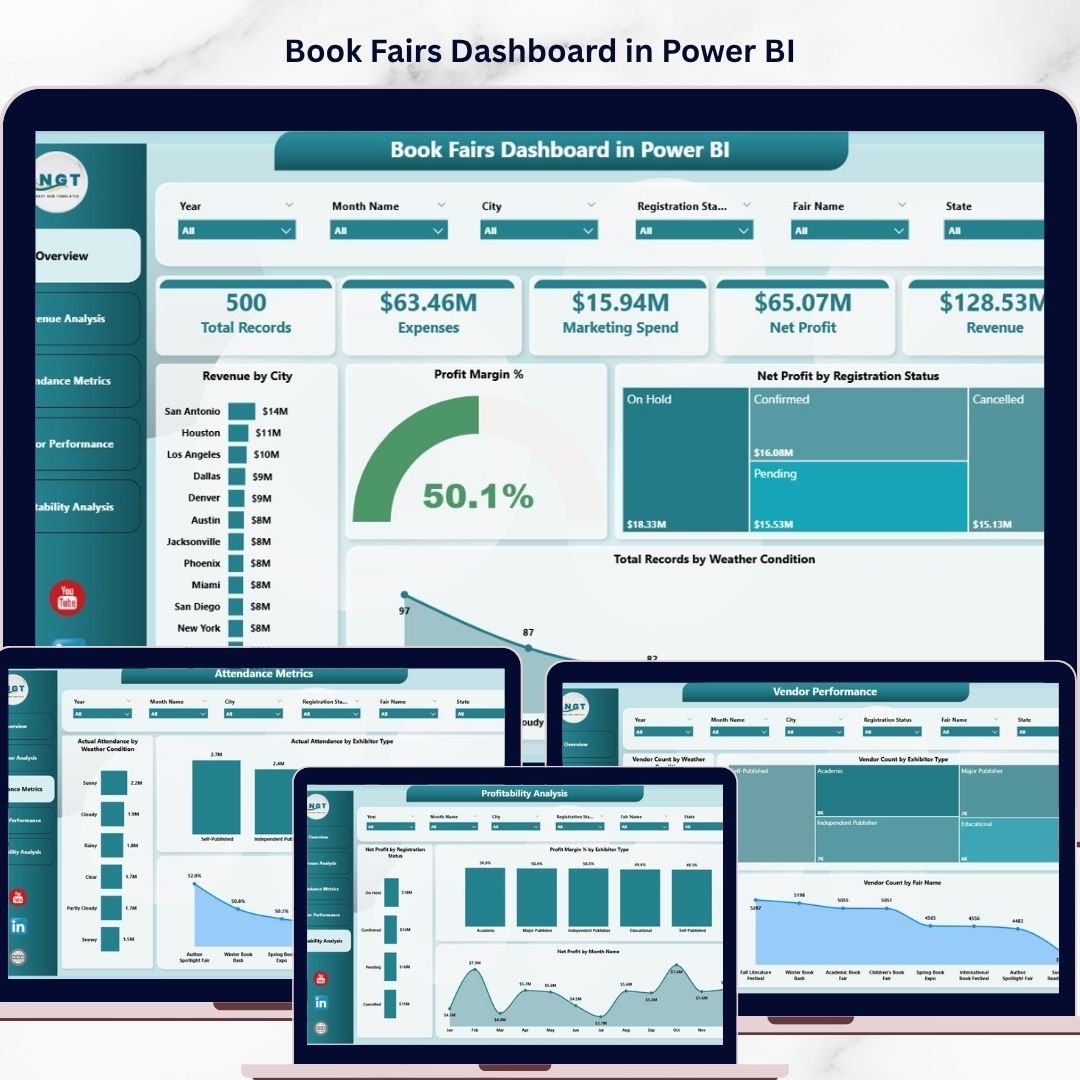
📦 What’s Inside the Book Fairs Dashboard in Power BI
This dashboard includes 5 interactive pages:
🏠 Overview Page – Quick snapshot of key KPIs and performance
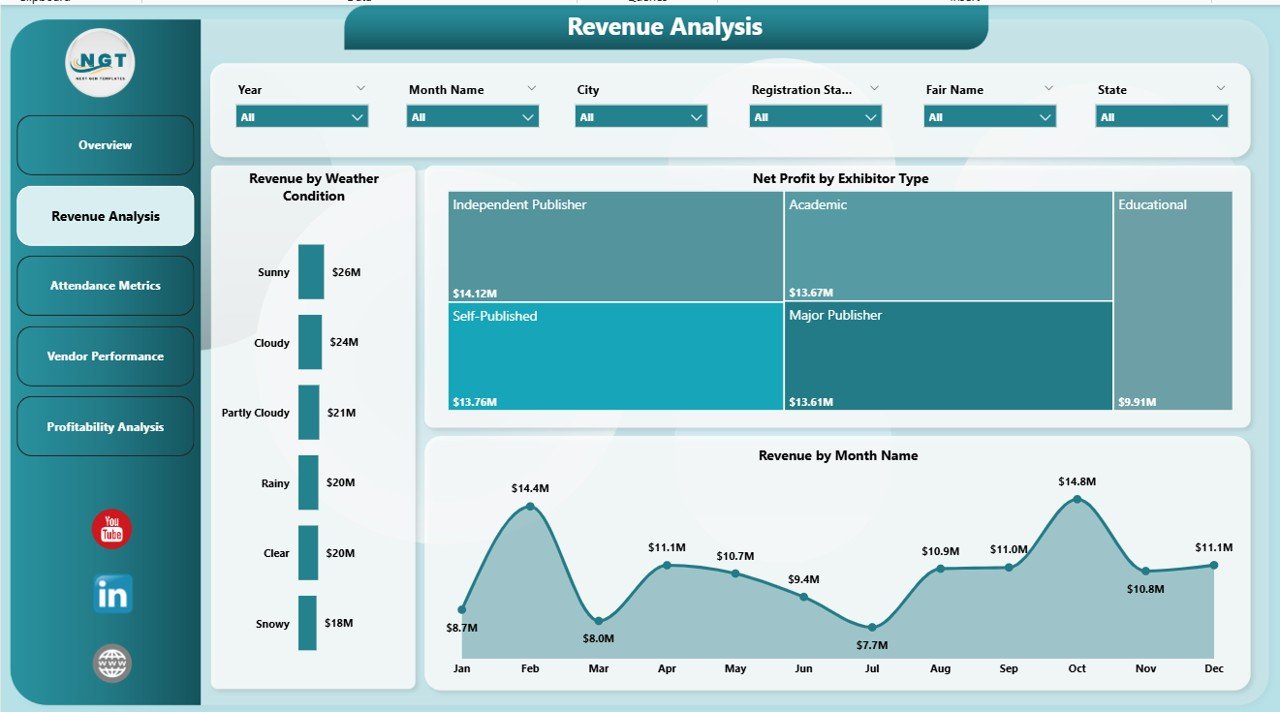
💰 Revenue Analysis – Track earnings across months and exhibitors
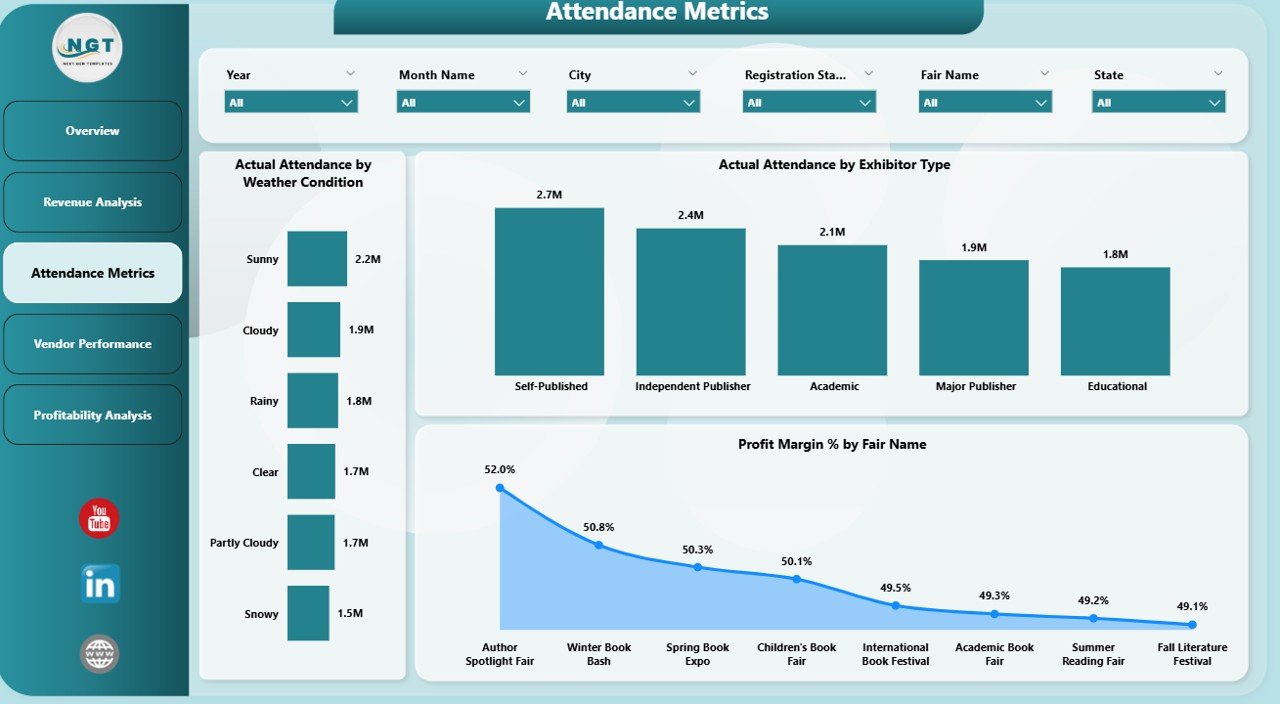
👥 Attendance Metrics – Analyze visitor behavior and engagement
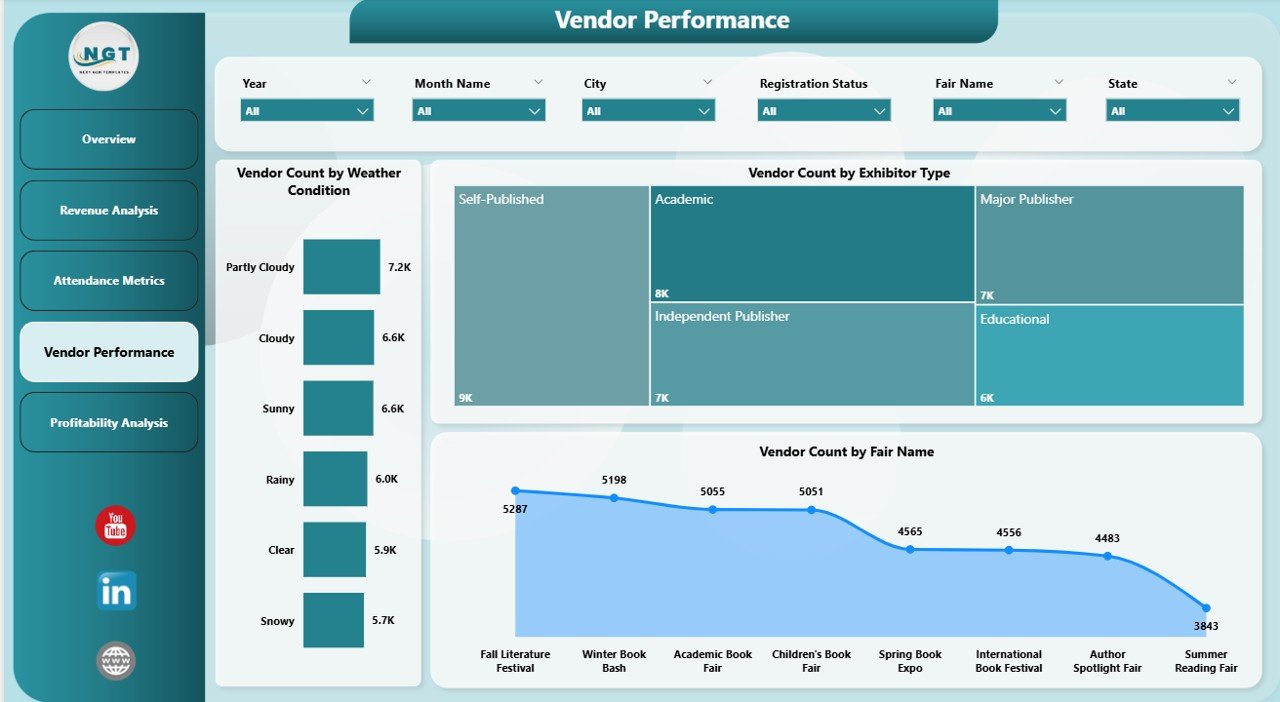
🏪 Vendor Performance – Evaluate exhibitor contribution
📈 Profitability Analysis – Monitor margins and financial performance
👉 Together, these pages provide a complete 360° view of your book fair operations.
⚙️ How to Use the Book Fairs Dashboard in Power BI
Getting started is simple:
👉 Import your event data into Power BI
👉 Connect your data sources
👉 Use slicers to filter by city, month, or exhibitor type
👉 Analyze KPI cards and charts
👉 Take data-driven actions
Within minutes, you can convert raw event data into powerful insights 📊.
👨💼 Who Can Benefit from This Book Fairs Dashboard in Power BI
This dashboard is perfect for:
📚 Event Organizers – Track fair performance and planning
📊 Data Analysts – Generate insights and reports
🏪 Vendors & Exhibitors – Evaluate participation and results
💼 Business Owners – Monitor profitability and growth
🎯 Marketing Teams – Improve campaigns and engagement
👉 Anyone involved in event management and analytics will benefit from this tool.
🔗 Click hare to read the Detailed blog post
Explore the complete guide with features, advantages, and best practices.
👉 Visit our YouTube channel to learn step-by-step video tutorials:
https://youtube.com/@PKAnExcelExpert