

Struggling to manage book fair data across multiple sheets? 😓
The Book Fairs Dashboard in Excel is your ultimate solution to track, analyze, and optimize event performance—all in one place 🚀.
In today’s fast-moving event industry, handling visitor attendance, vendor sales, and revenue data manually can slow you down. However, this ready-to-use dashboard converts complex data into clear visuals, powerful KPIs, and actionable insights.
As a result, you can improve decision-making, boost engagement, and maximize profitability—without any hassle.
🚀 Key Feature of Book Fairs Dashboard in Excel
✅ 📊 Interactive Excel Dashboard
Analyze book fair data with dynamic charts and slicers.
✅ 📈 KPI Tracking System
Monitor revenue, profit, attendance, and vendor performance.
✅ 🎯 Multi-Dimensional Analysis
Track performance by city, event, vendor, and time.
✅ 🔍 Smart Filtering with Slicers
Instantly filter data for customized insights.
✅ 📉 Profitability Insights
Identify high-profit fairs and optimize strategies.
✅ 👥 Visitor Behavior Analysis
Understand attendance patterns and engagement.
✅ 📂 Structured Data Management
Separate Data and Support sheets for smooth performance.
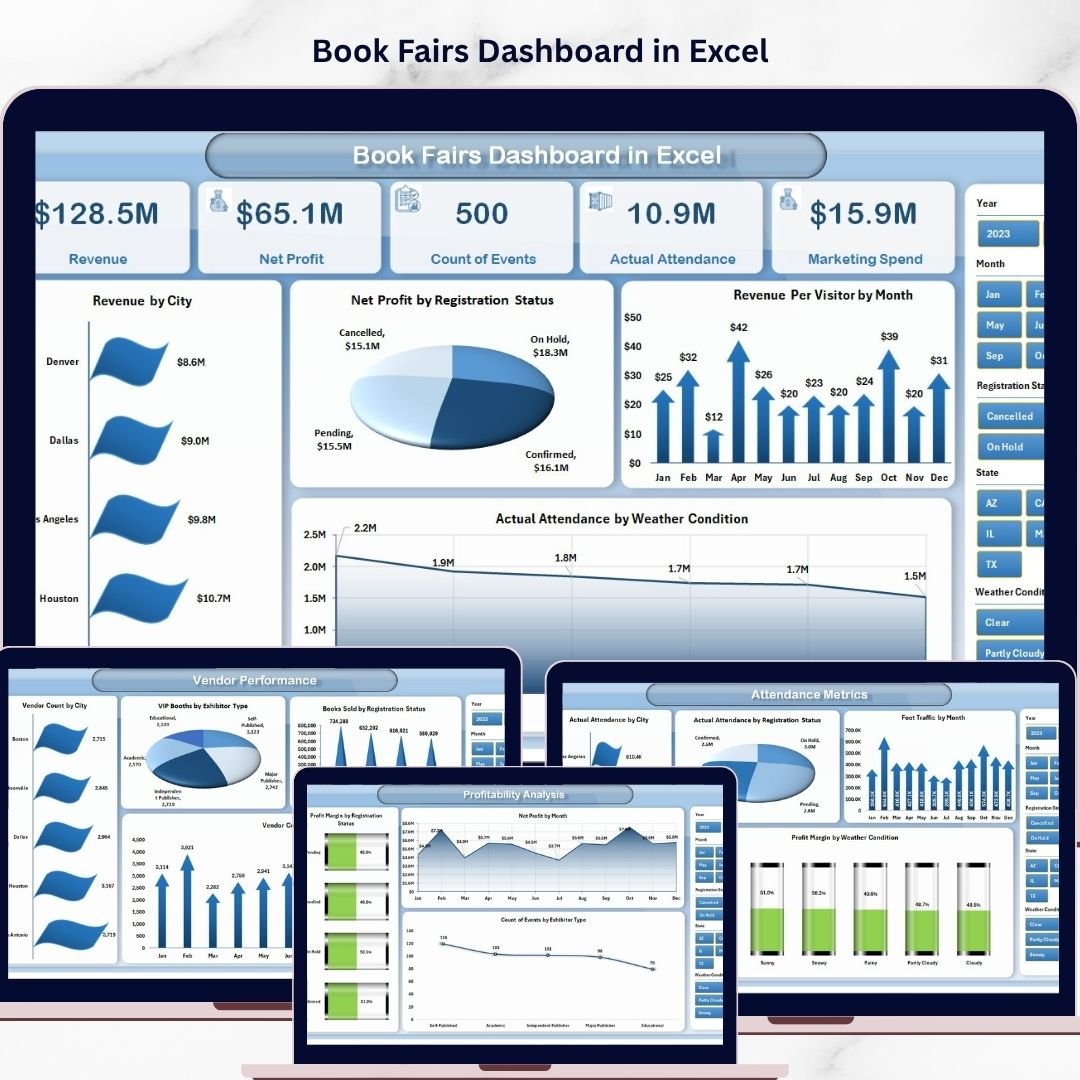
📦 What’s Inside the Book Fairs Dashboard in Excel
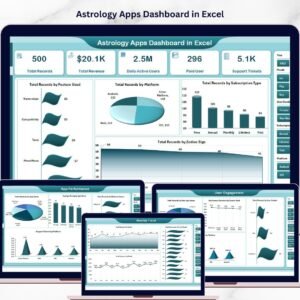
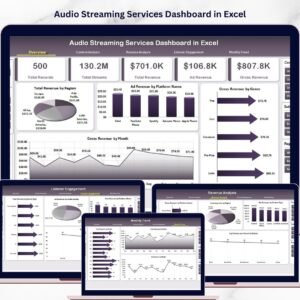
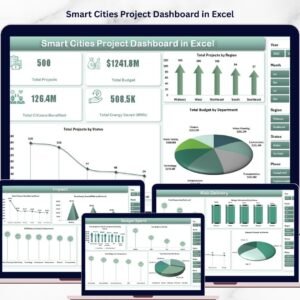
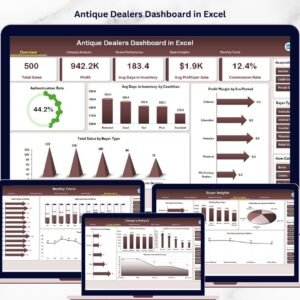
This dashboard includes 5 powerful analytical pages:
📊 Overview Page – Snapshot of overall performance with KPIs

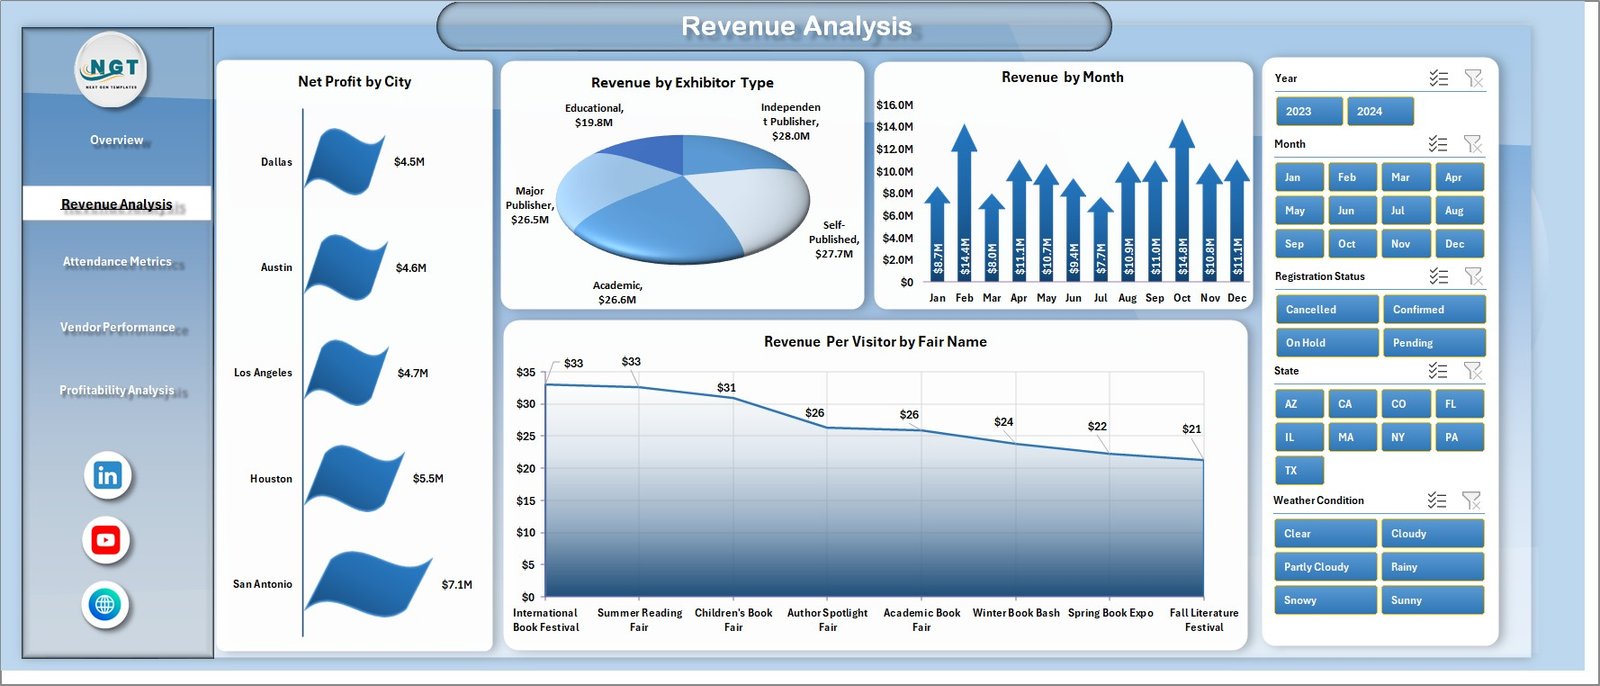
💰 Revenue Analysis – Track earnings across cities and events
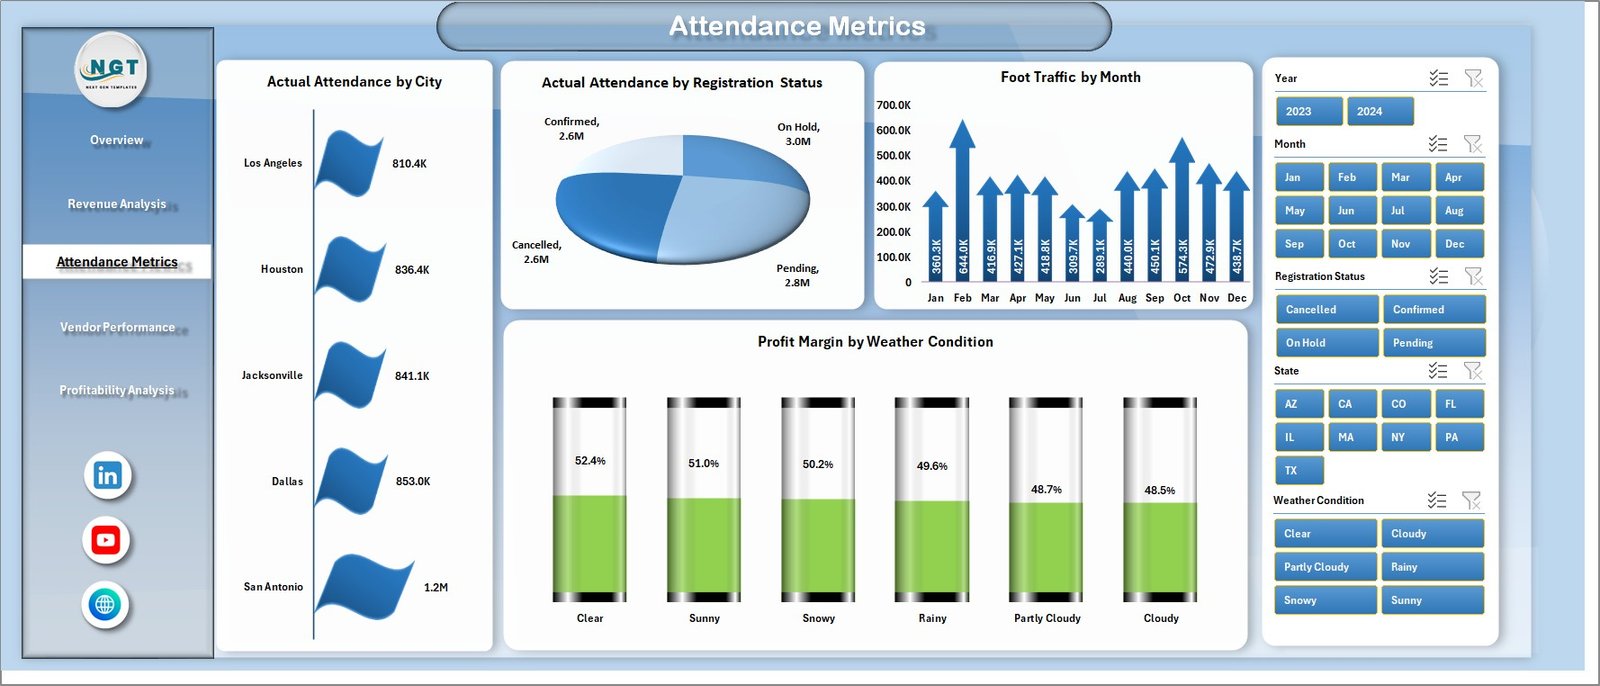
👥 Attendance Metrics – Analyze visitor behavior and trends
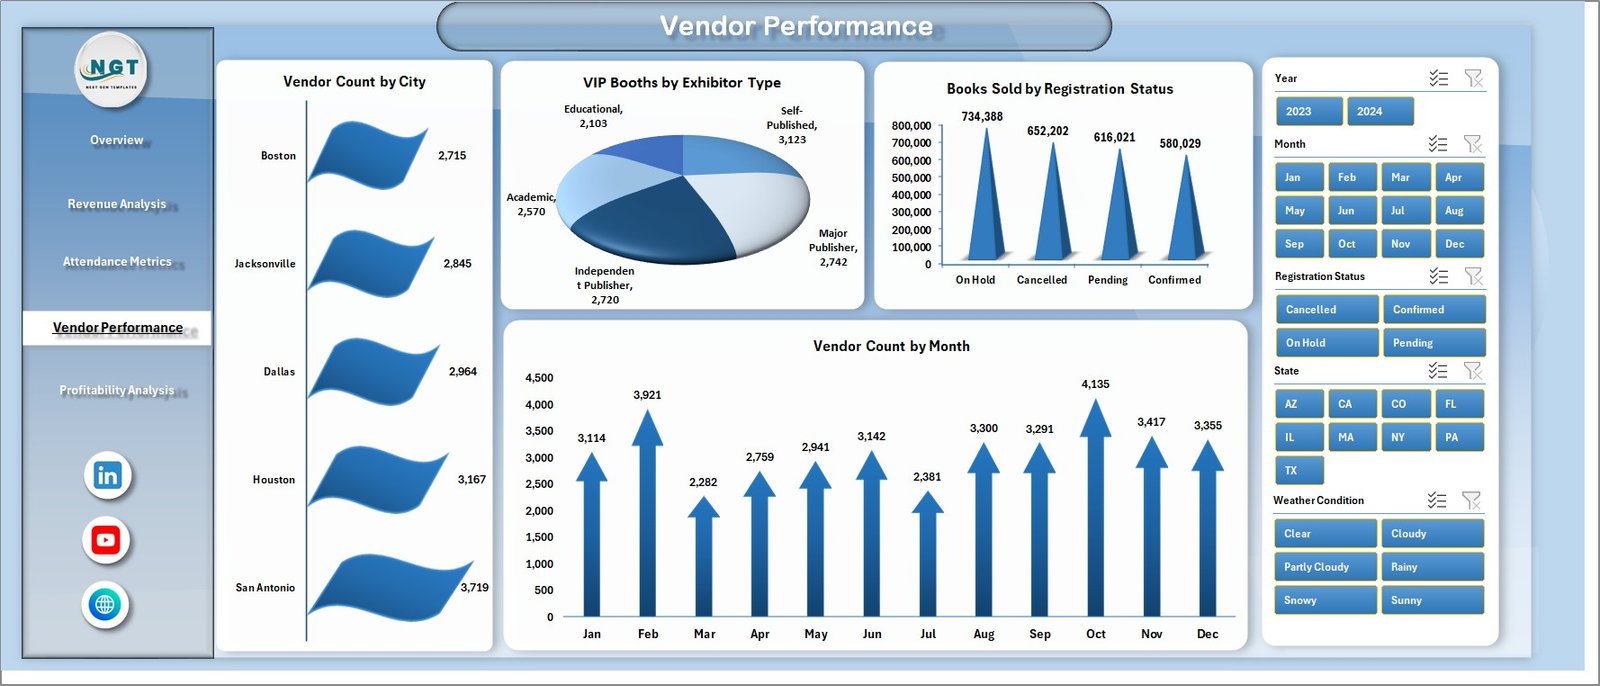
🏬 Vendor Performance – Evaluate exhibitor contribution
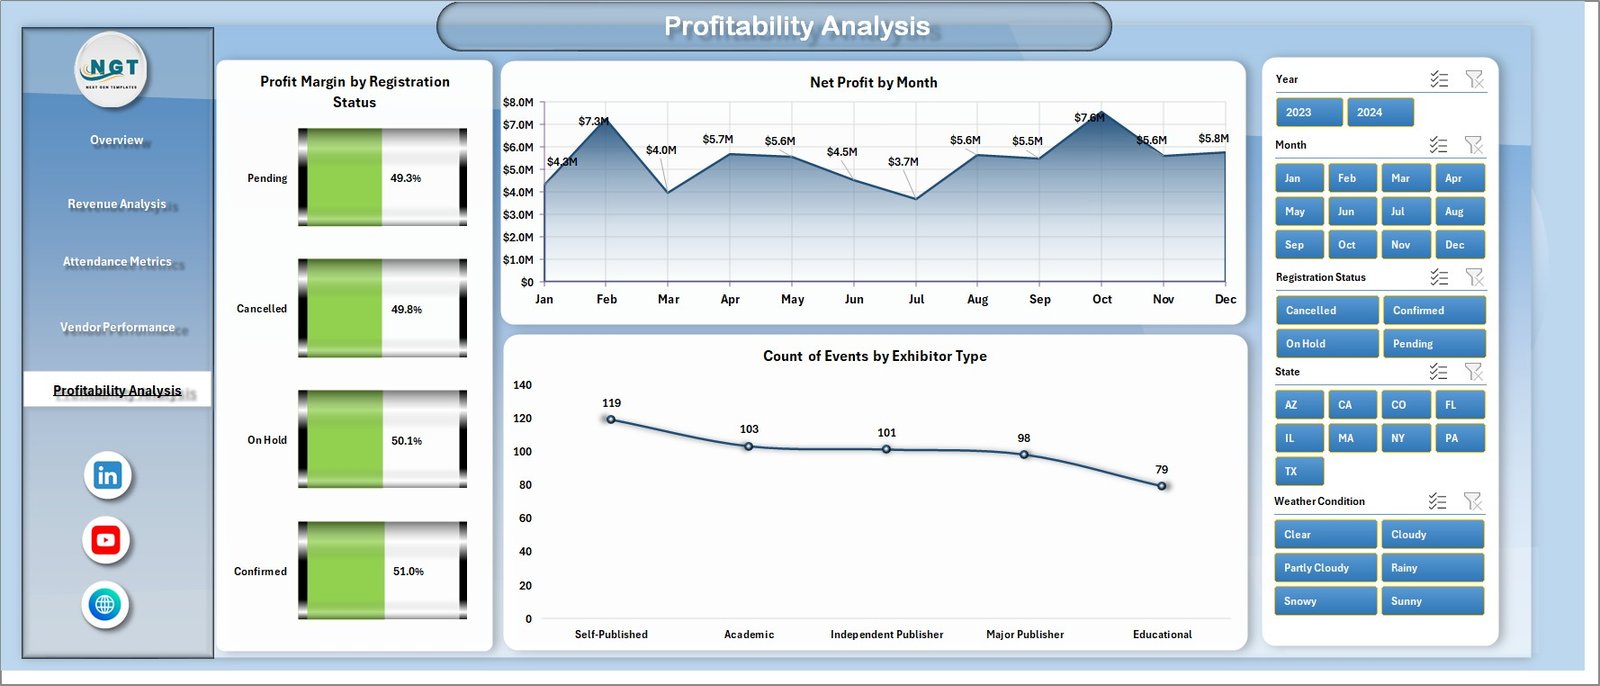
📉 Profitability Analysis – Monitor margins and financial health
📂 Additional Sheets:
-
Data Sheet – Stores raw event data
-
Support Sheet – Handles backend calculations
👉 Everything is designed to give you a complete 360° view of your book fair performance.
⚙️ How to Use the Book Fairs Dashboard in Excel
Getting started is simple:
👉 Enter event data into the Data Sheet
👉 Refresh the dashboard
👉 Use slicers to filter by city, event, or time
👉 Analyze KPIs and charts
👉 Take data-driven actions
Within minutes, you can turn raw data into powerful event insights 📊.
👨💼 Who Can Benefit from This Book Fairs Dashboard in Excel
This dashboard is perfect for:
📚 Event Organizers – Track fair performance
🏬 Book Fair Managers – Monitor vendors and sales
📊 Data Analysts – Generate insights and reports
💼 Business Owners – Improve profitability
🎯 Marketing Teams – Analyze visitor trends
👉 Anyone involved in event planning and management will benefit from this tool.
🔗 Click hare to read the Detailed blog post
Explore the full guide with detailed features, advantages, and best practices.
👉 Visit our YouTube channel to learn step-by-step video tutorials:
https://youtube.com/@PKAnExcelExpert