
In the fast-moving world of biotechnology, where every experiment, trial, and innovation counts, managing massive amounts of data can be challenging. The Biotechnology Report in Excel simplifies this process by transforming complex research, clinical, and financial data into clear, actionable insights.
This ready-to-use Excel template helps biotech professionals, researchers, and analysts visualize KPIs, analyze R&D investments, monitor clinical trial costs, and evaluate project performance — all within a single interactive dashboard.
With just a few clicks, you can explore trends, identify bottlenecks, and make informed decisions that accelerate innovation and profitability.
⚙️ Key Features of the Biotechnology Report in Excel
✅ 📊 Three Analytical Pages + Support Sheet – Designed for simplicity, accuracy, and deep analysis.
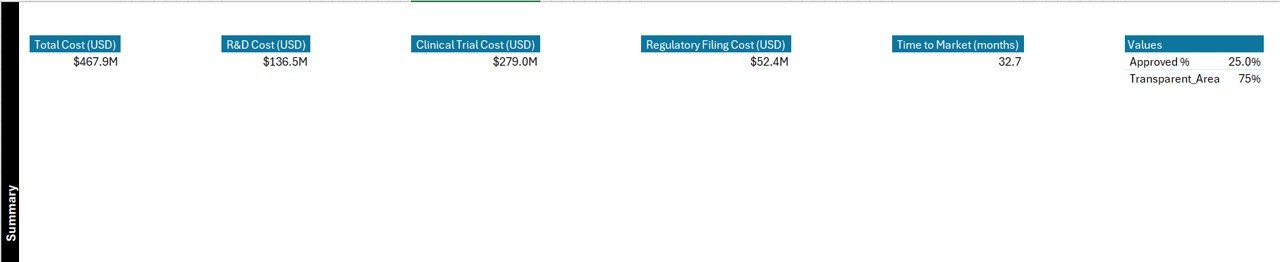
🧠 1. Summary Page – Your Insight Command Center
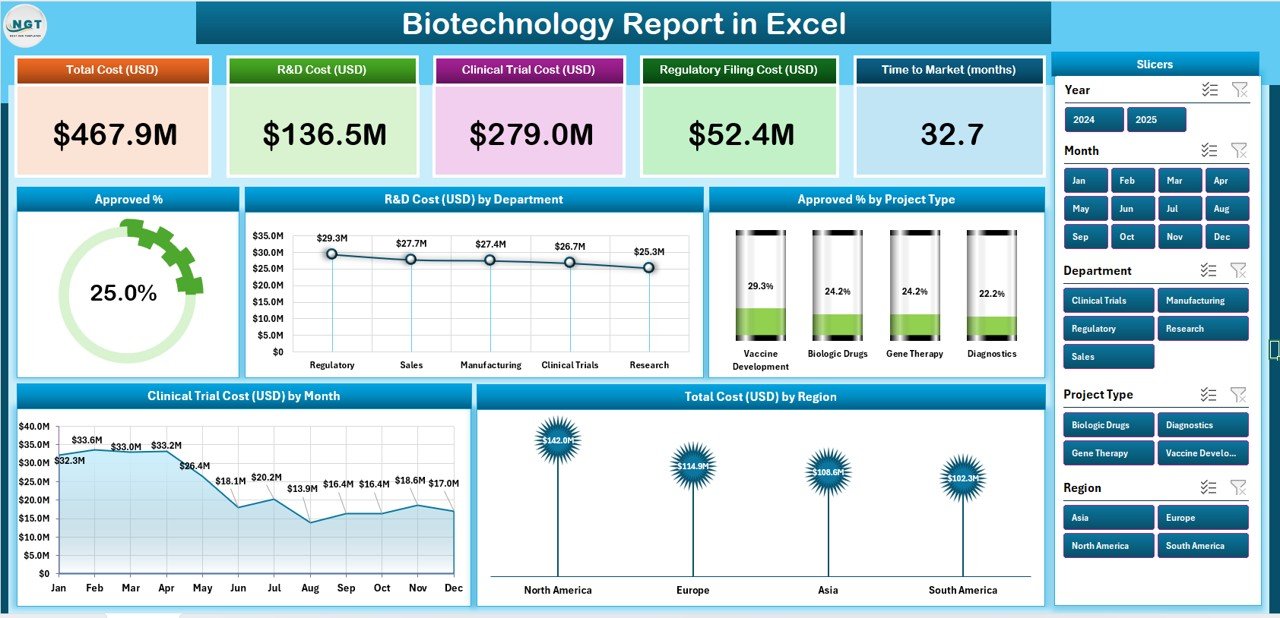
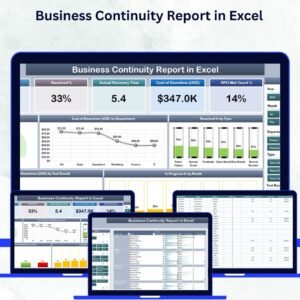
The Summary Page provides a high-level overview of biotechnology operations. It brings together KPIs, charts, and slicers for real-time analysis.
Key Components:
-
🧾 Top 5 KPI Cards: Approval Rate (%), Total R&D Cost, Clinical Trial Cost, Projects in Pipeline, Total Regional Cost.
-
🎛️ Slicer Panel: Filter by Department, Region, Month, or Project Type.
-
📈 Dynamic Charts:
-
Approval Percentage (%)
-
R&D Cost (USD) by Department
-
Approval % by Project Type
-
Clinical Trial Cost (USD) by Month
-
Total Cost (USD) by Region
-
This page allows managers and scientists to view overall performance at a glance, identify cost trends, and evaluate research efficiency.
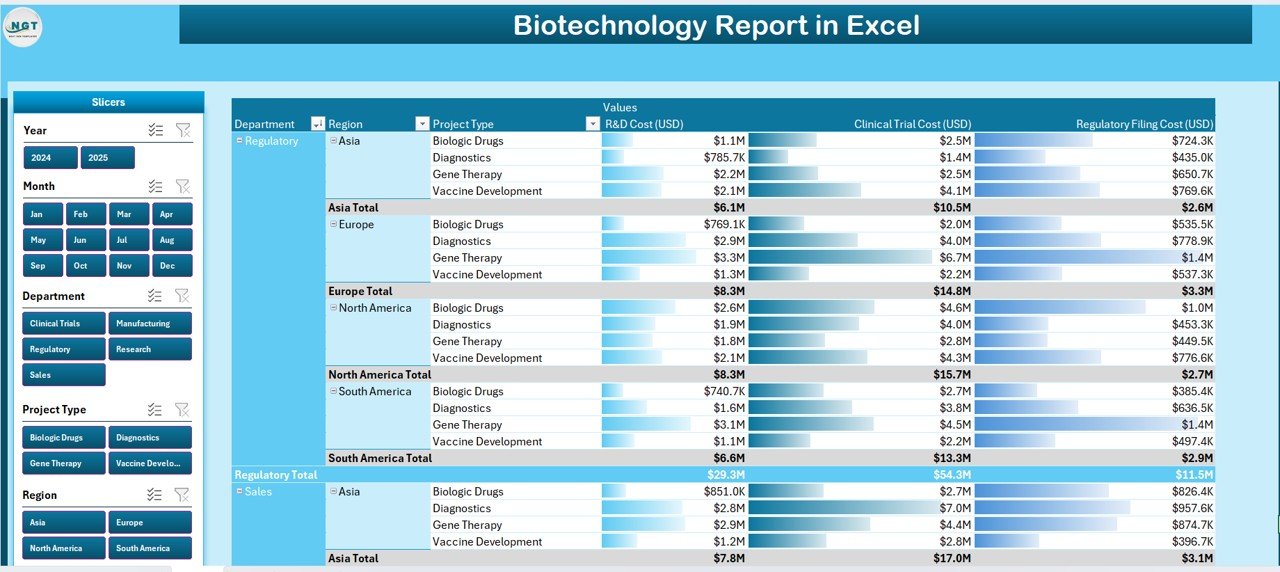
🧾 2. Report Page – The Analytical Deep Dive
Get a detailed line-by-line breakdown of projects, departments, and regions.
Includes:
-
🎚️ Left-side slicers to filter by department, project phase, or region.
-
📋 Data table with columns for Project Name, Department, Clinical Phase, R&D Cost, Approval Status, and Total Cost.
This page is perfect for researchers and finance teams who need granular insights into cost allocation, project progress, and department performance.
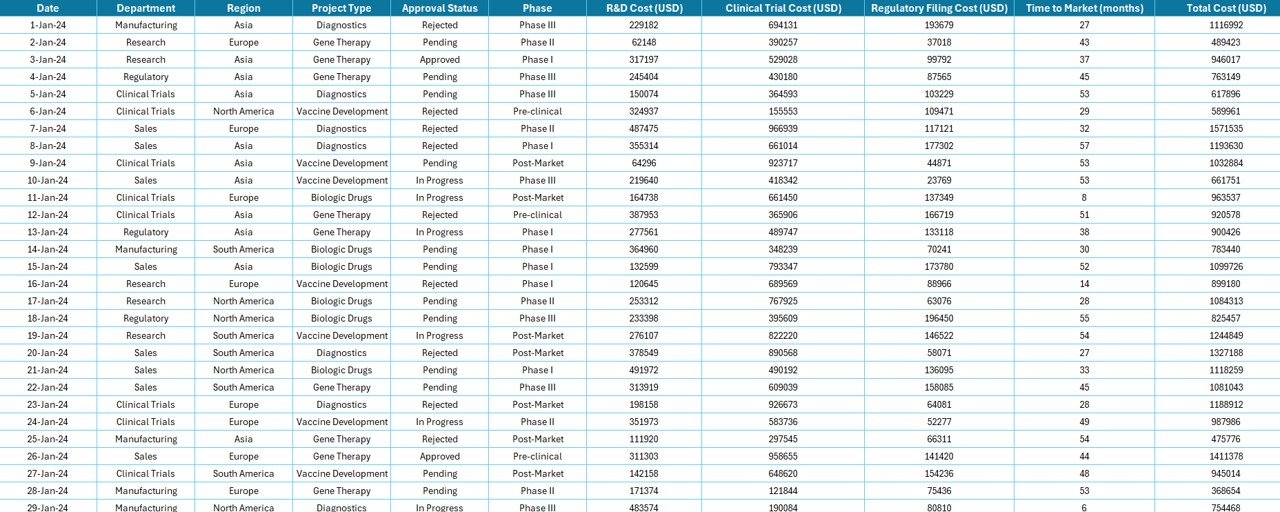
🧩 3. Data Sheet – The Engine Behind the Dashboard
The Data Sheet stores all raw biotechnology data and powers every visual and calculation.
Common Fields:
Project ID | Department | Project Type | Clinical Phase | Region | R&D Cost | Clinical Trial Cost | Approval Status | Date of Update
Clean, structured data ensures your visuals always stay accurate and up to date.
📚 4. Support Sheet – Your Reference Hub
The Support Sheet contains dropdown lists and reference tables for:
-
Department Names
-
Project Types
-
Clinical Phases
-
Regions
-
Approval Status
This ensures data entry consistency and helps automate slicers and pivot filters.
💡 Why Use the Biotechnology Report in Excel
The biotech sector generates vast datasets from R&D, clinical trials, and global operations. This Excel-based reporting tool ensures:
-
✅ Data Clarity: Converts complex information into simple, visual summaries.
-
✅ Financial Control: Monitors costs, budgets, and ROI efficiently.
-
✅ Improved Decision-Making: Helps leadership identify high-performing projects.
-
✅ Time Savings: Reduces manual reporting and calculations.
-
✅ Full Customization: Easily adapt it to your team’s unique data structure.
🔍 Key Insights You Can Gain
📊 Department-Wise R&D Cost: Identify top-spending and most efficient departments.
📈 Approval Rate by Project Type: Discover which project categories succeed faster.
💰 Clinical Trial Expenses by Month: Track trends and forecast future costs.
🌎 Regional Performance: Compare research and investment efficiency globally.
🧬 Project Success Metrics: Measure innovation outcomes and resource utilization.
🚀 Advantages of the Biotechnology Report in Excel
-
🧠 Centralized Data Visualization: All KPIs in one dynamic dashboard.
-
💰 Cost-Effective: No expensive BI software or training needed.
-
⚙️ Customizable & Scalable: Modify KPIs, charts, and layouts anytime.
-
🧩 Collaboration Ready: Easily shared with R&D, finance, and leadership teams.
-
🔄 Real-Time Analysis: Automatic updates through pivot tables and slicers.
-
🔗 Easy Integration: Connect with CSVs, databases, or other Excel files.
👥 Who Can Benefit
🔬 Biotech Companies – Track R&D investment and approval success.
💊 Pharmaceutical Firms – Analyze clinical trial costs and outcomes.
🏥 Healthcare Organizations – Oversee innovation and vaccine development.
🏛️ Government Agencies – Manage biotech funding and program efficiency.
🏫 Research Institutes – Monitor grants, results, and performance metrics.
🧩 Best Practices for Effective Use
✅ Maintain clean, structured data.
✅ Refresh pivot tables after each update.
✅ Use consistent units (USD, %, etc.).
✅ Protect critical formulas and KPI fields.
✅ Backup files regularly.
✅ Apply color-coded visuals for readability.
✅ Use clear, descriptive chart titles.
🔗 Click here to read the Detailed blog post
📺 Visit our YouTube channel to learn step-by-step video tutorials
👉 YouTube.com/@PKAnExcelExpert


Reviews
There are no reviews yet.