The Autonomous Vehicles KPI Dashboard moves at an incredible speed. Teams constantly test algorithms, analyze sensor data, measure safety outcomes, and improve system reliability. However, despite advanced technology, many organizations still struggle to track performance clearly. KPI data often stays scattered across multiple Excel files, tools, and reports. As a result, insights get delayed and decision-making slows down.
That is exactly where the Autonomous Vehicles KPI Dashboard in Excel becomes a powerful and practical solution.
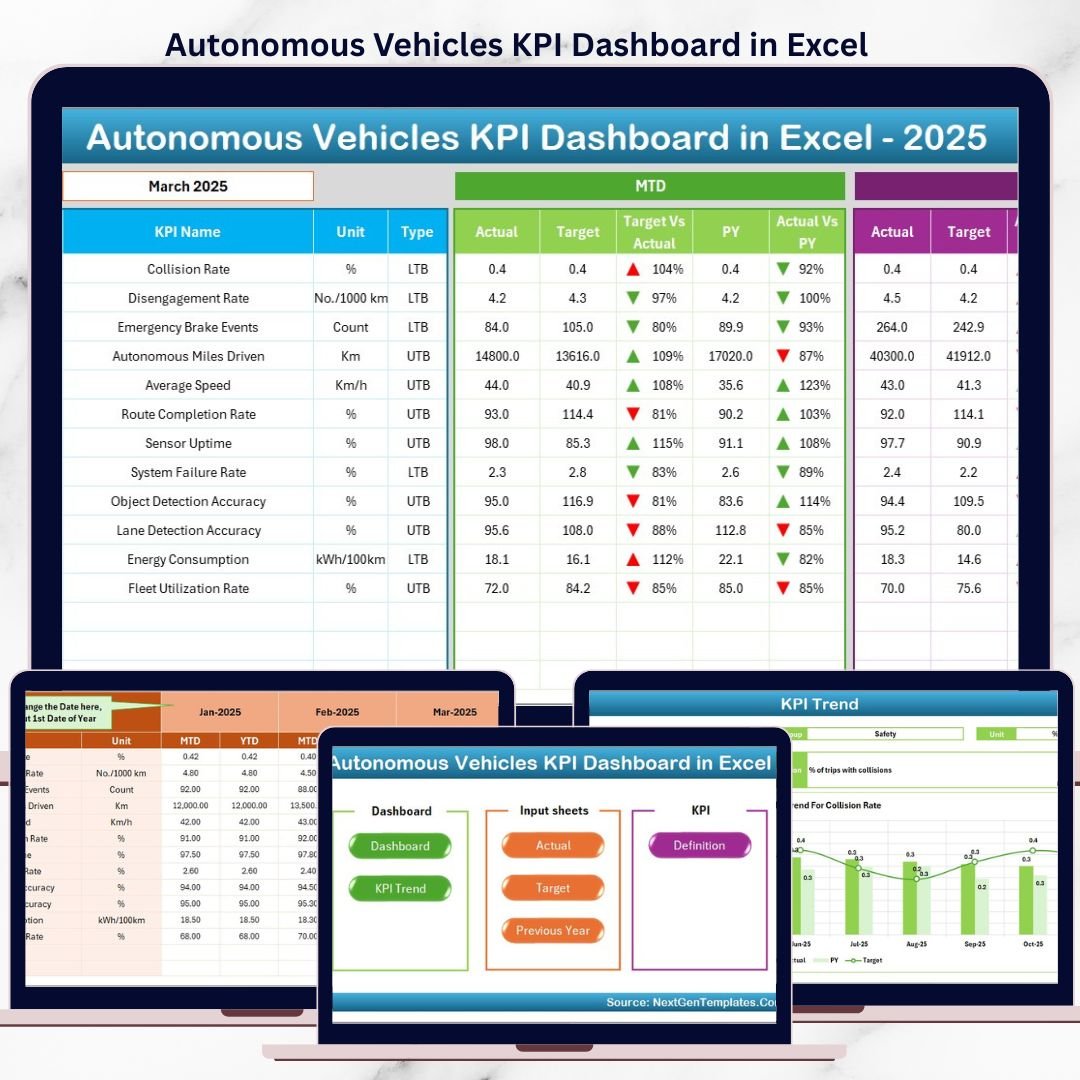
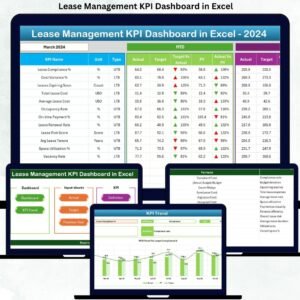
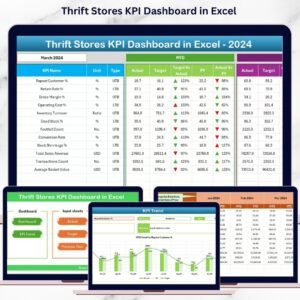
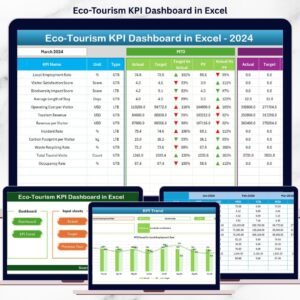
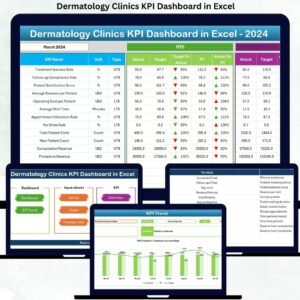
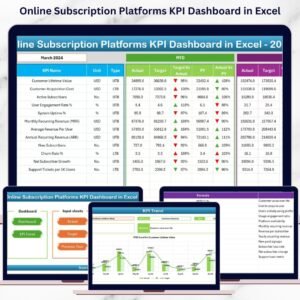
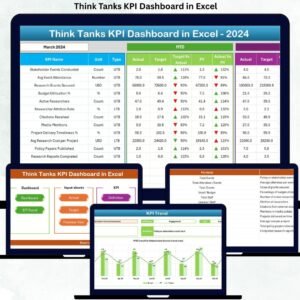
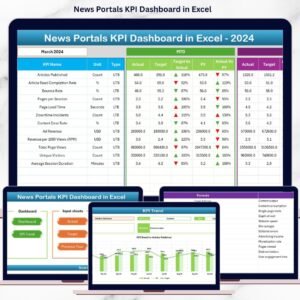
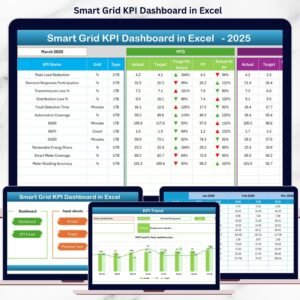
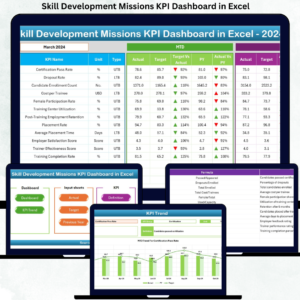
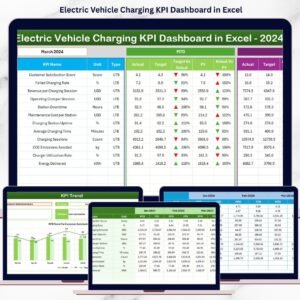
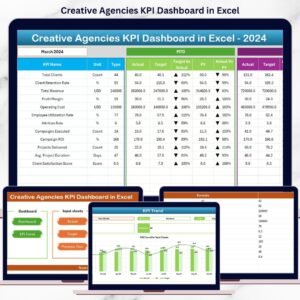
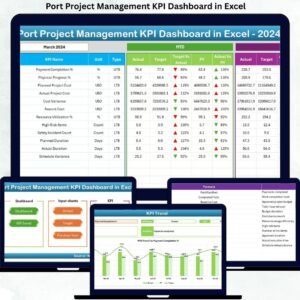
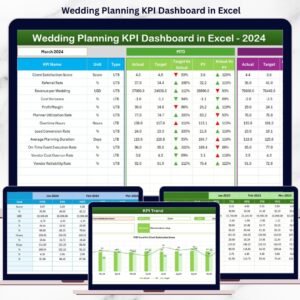
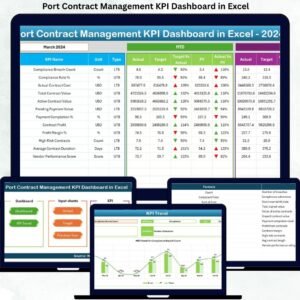
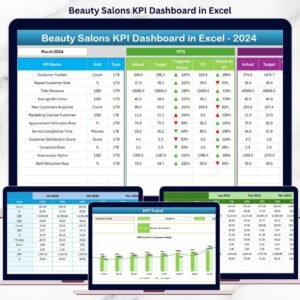
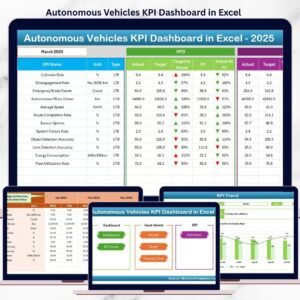
This ready-to-use Excel KPI dashboard transforms complex autonomous vehicle performance data into clear KPIs, visual indicators, and trend-based insights. Instead of reviewing raw datasets or disconnected reports, engineering teams, program managers, and leadership can monitor all critical autonomous vehicle KPIs from one centralized dashboard.
Built entirely in Microsoft Excel, this dashboard uses structured worksheets, formulas, conditional formatting, and trend charts. As a result, it delivers enterprise-level KPI tracking without expensive BI tools or technical complexity.
🔑 Key Features of Autonomous Vehicles KPI Dashboard in Excel
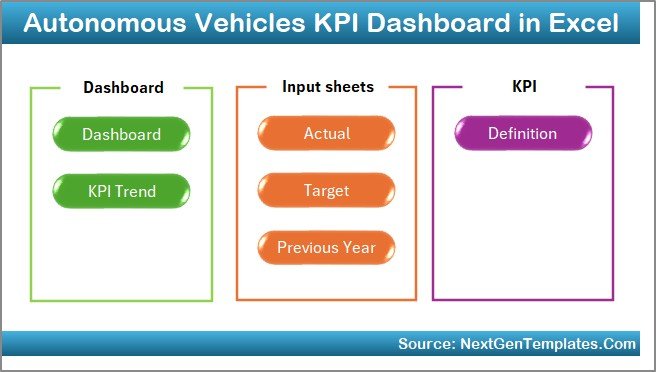
📊 7 structured worksheets for complete KPI tracking
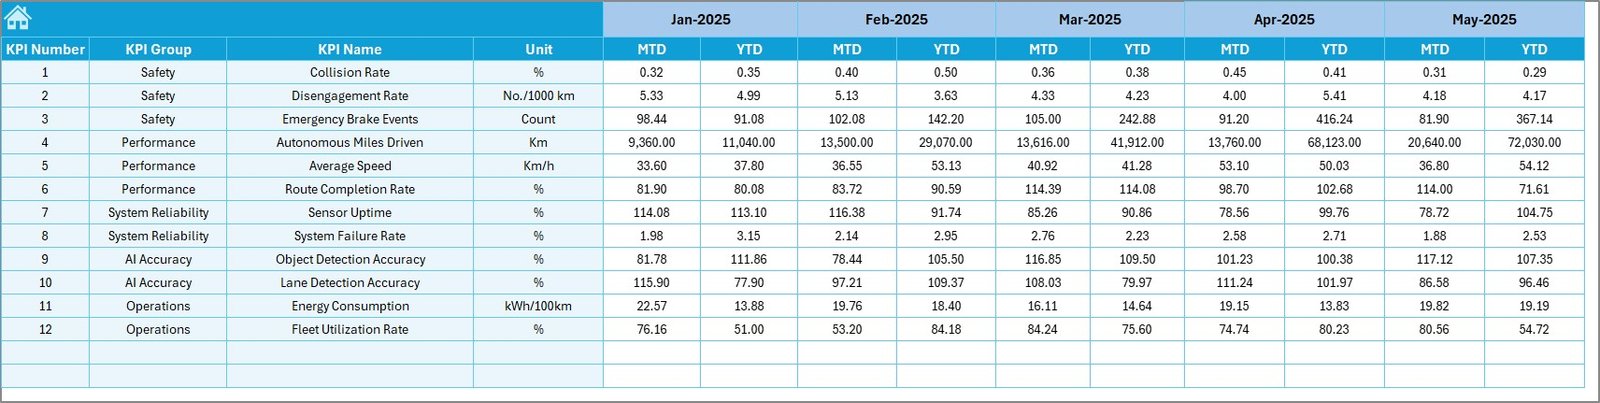
🎯 MTD & YTD performance monitoring
📈 Actual vs Target vs Previous Year comparison
🔼🔽 Conditional formatting arrows for quick insights
📉 KPI-wise trend analysis charts
🧭 Home sheet with navigation buttons
🧾 Dedicated KPI Definition reference sheet
🔄 Automatic updates with data entry
🛠 Fully customizable KPI framework
This dashboard helps autonomous vehicle teams move from manual tracking to data-driven performance management.
📂 What’s Inside the Autonomous Vehicles KPI Dashboard in Excel
🏠 Home Sheet – Easy Navigation Hub
The Home Sheet acts as the index page of the dashboard.
Key Highlights:
-
6 clickable navigation buttons
-
One-click movement to any worksheet
-
Clean and user-friendly layout
This design eliminates confusion and saves valuable time.
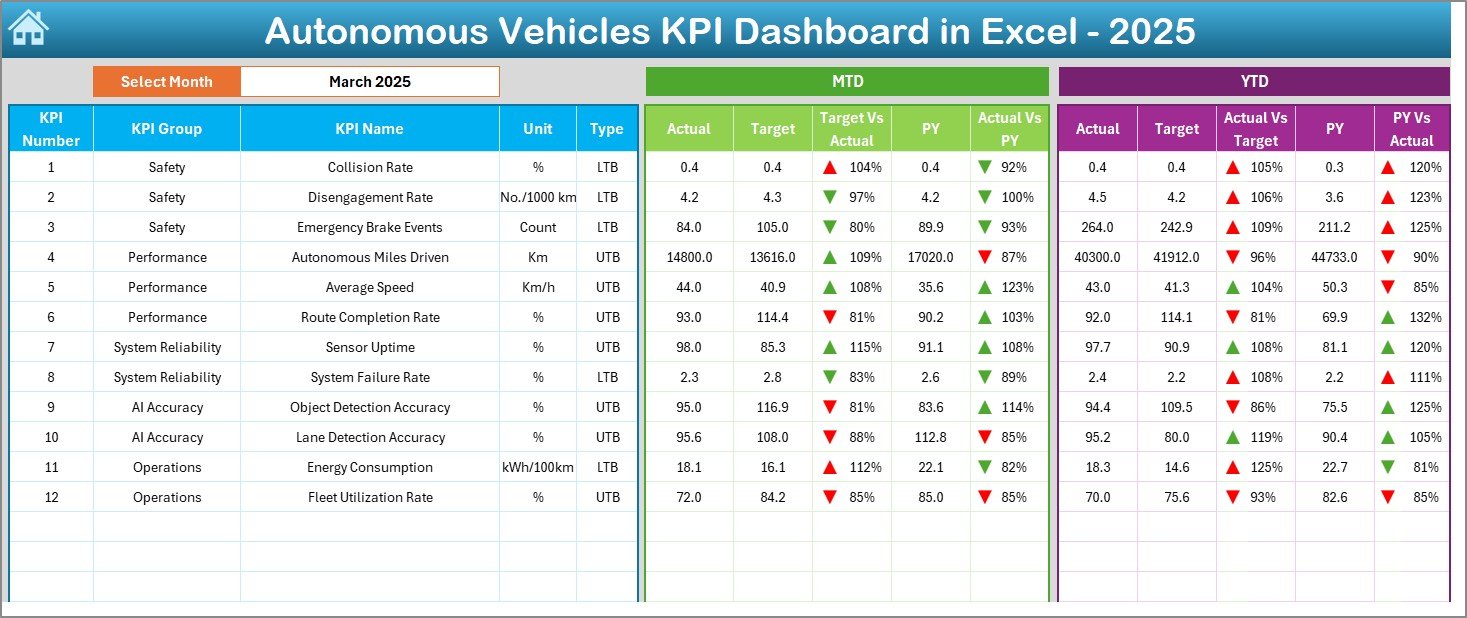
📊 Dashboard Sheet – Overall KPI Performance View
The Dashboard Sheet is the heart of the file.
What This Sheet Shows:
-
Month selector in cell D3
-
Dynamic update of all KPIs based on selected month
-
MTD Actual, Target, Previous Year values
-
YTD Actual, Target, Previous Year values
-
Target vs Actual variance
-
Previous Year vs Actual variance
-
🔼🔽 Conditional formatting arrows
With this sheet, leadership can instantly identify performance gaps and achievements.
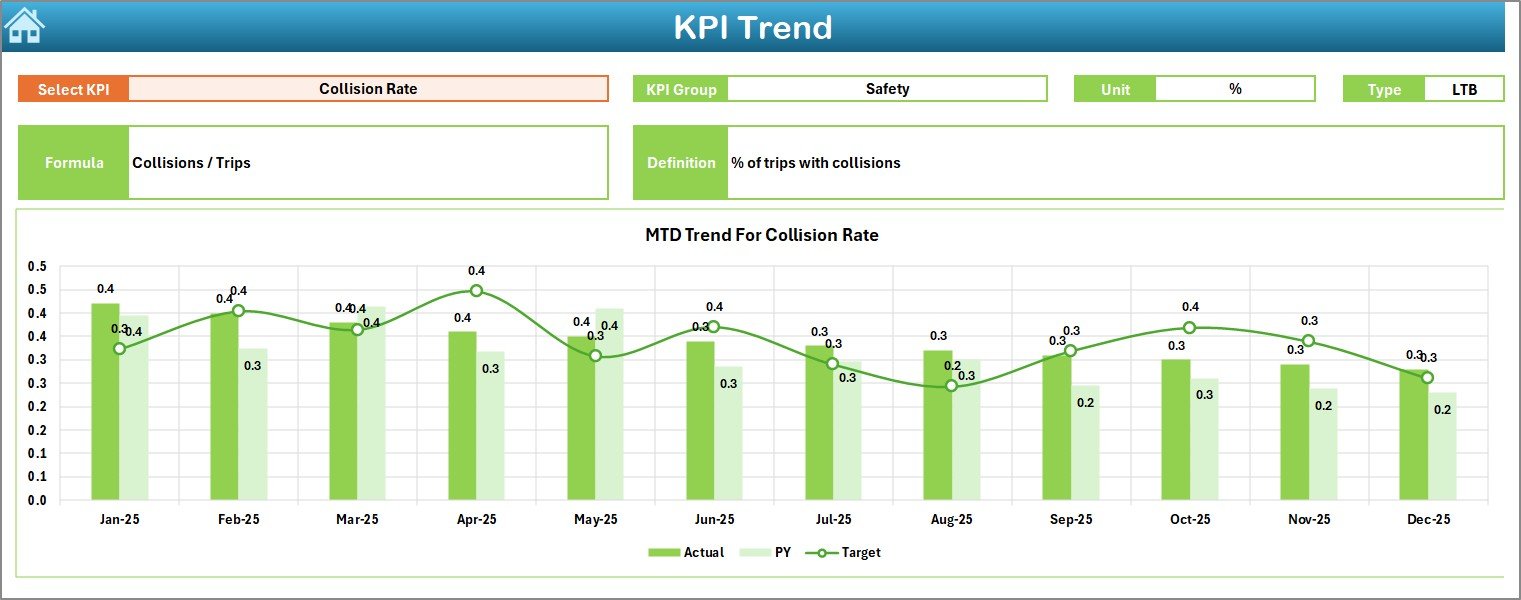
📈 KPI Trend Sheet – Deep KPI Analysis
The KPI Trend Sheet focuses on individual KPI behavior over time.
Key Capabilities:
-
KPI selection dropdown in cell C3
-
Displays KPI Group, Unit, Type (UTB/LTB), Formula, and Definition
-
Two trend charts:
-
MTD Trend (Actual vs Target vs Previous Year)
-
YTD Trend (Actual vs Target vs Previous Year)
-
This sheet supports root-cause analysis and long-term planning.
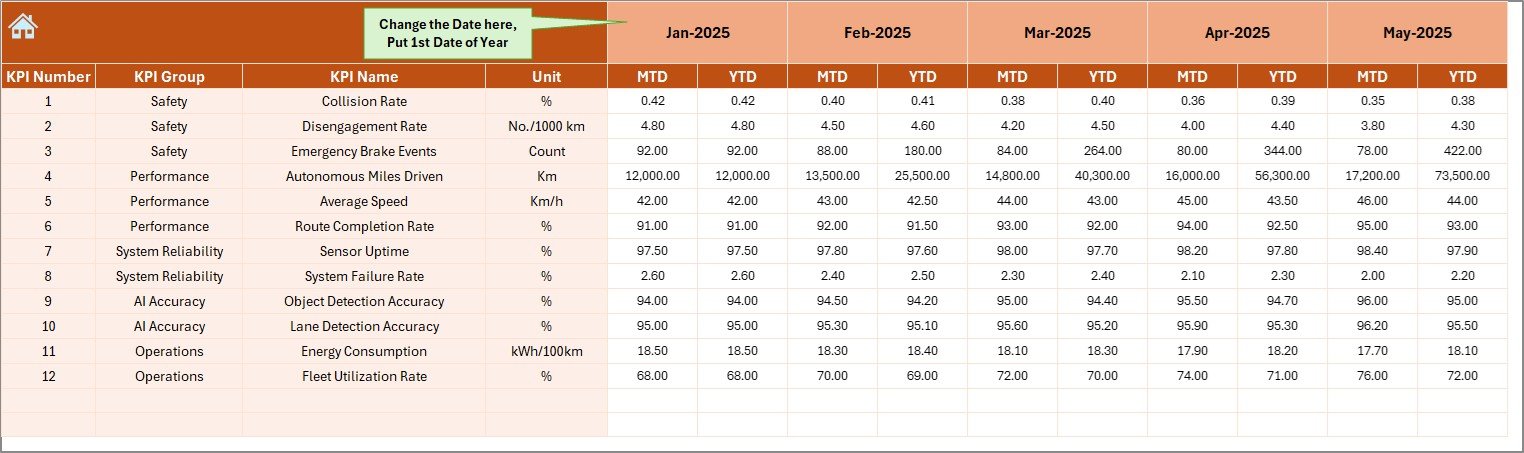
🧮 Actual Numbers Input Sheet – Data Entry Area
The Actual Numbers Input Sheet captures real performance data.
How It Works:
-
Month control in cell E1
-
Structured input for MTD and YTD actual values
-
Clean layout to avoid data entry errors
Once data is entered, all dashboard visuals update automatically.
🎯 Target Sheet – Performance Goal Tracking
The Target Sheet defines KPI benchmarks.
What You Enter:
-
Monthly MTD targets
-
Cumulative YTD targets
This ensures teams stay aligned with strategic and operational goals.
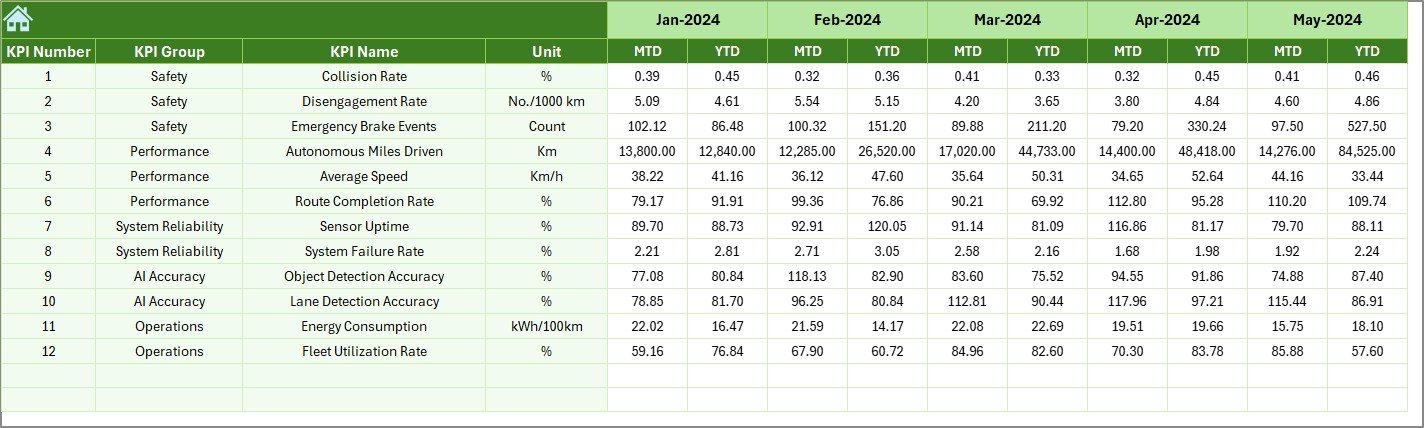
📆 Previous Year Number Sheet – Historical Benchmarking
The Previous Year Number Sheet stores last year’s KPI values.
Why This Matters:
-
Enables year-over-year comparison
-
Highlights long-term improvement or decline
-
Supports performance maturity assessment
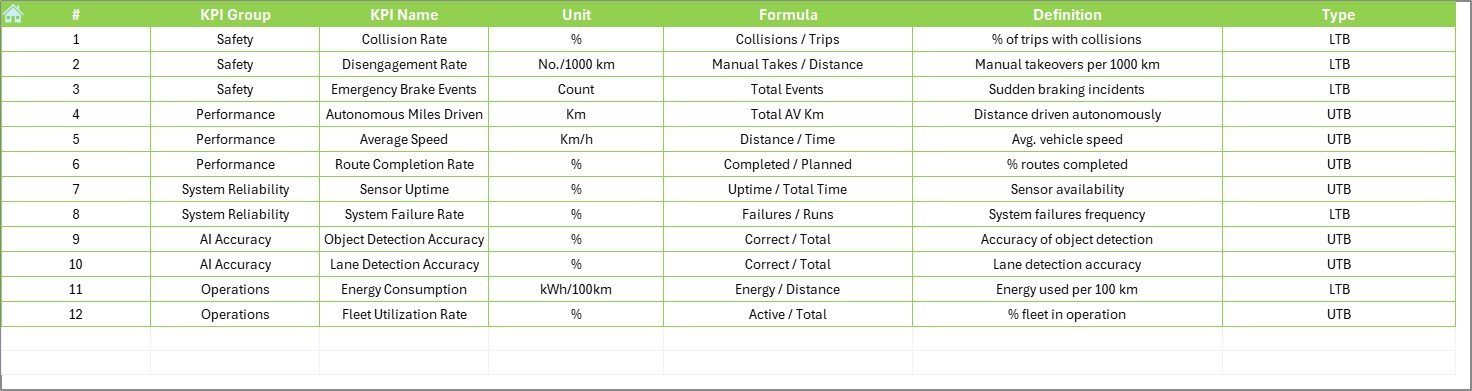
📘 KPI Definition Sheet – KPI Clarity & Governance
The KPI Definition Sheet acts as a reference guide.
Information Stored:
-
KPI Name
-
KPI Group
-
Unit of Measurement
-
Formula
-
KPI Definition
This ensures complete transparency and consistency across teams.
🛠️ How to Use the Autonomous Vehicles KPI Dashboard
✅ Enter KPI definitions and targets
✅ Update actual values monthly
✅ Select the reporting month from the dashboard
✅ Review MTD & YTD performance instantly
✅ Use trend charts for deeper insights
✅ Take faster, data-driven decisions
No advanced Excel skills are required.
👥 Who Can Benefit from This Dashboard?
🚘 Autonomous Vehicle Program Managers
📊 Data Analysts & Engineers
🛡 Safety & Compliance Teams
⚙ Operations Managers
🧠 R&D Leadership
📈 Strategy & Performance Teams
Suitable for startups, research labs, and enterprise-level autonomous vehicle organizations.
### 👉 Click here to read the Detailed blog post
▶️ Visit our YouTube channel to learn step-by-step video tutorials
https://youtube.com/@PKAnExcelExpert


Reviews
There are no reviews yet.