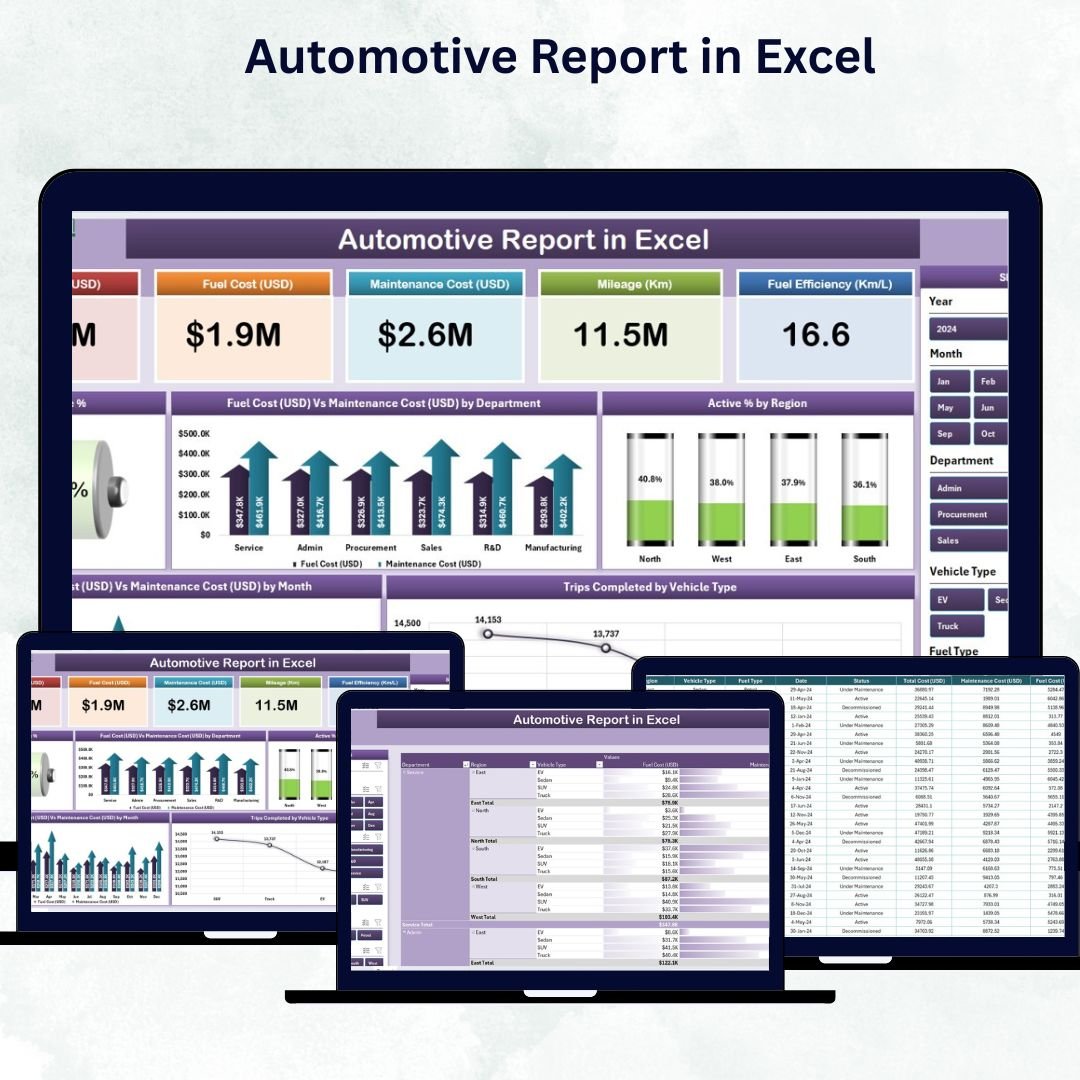
Managing vehicles, fuel expenses, and maintenance data can be overwhelming — especially when accuracy and speed matter most. The Automotive Report in Excel is your all-in-one solution to simplify automotive performance tracking and decision-making.
This ready-to-use Excel dashboard turns raw data into visual insights that help you monitor fleet activity, cost trends, and operational efficiency — all from one interactive workbook. Whether you manage a logistics company, vehicle fleet, or service department, this tool empowers you to analyze, optimize, and save effortlessly.
⚙️ Key Features of the Automotive Report in Excel
✅ 📊 Interactive Dashboard Layout – Includes four structured sheets: Summary, Report, Data, and Support — each designed to make data management intuitive and insightful.
✅ 📋 Summary Page – Your Control Center
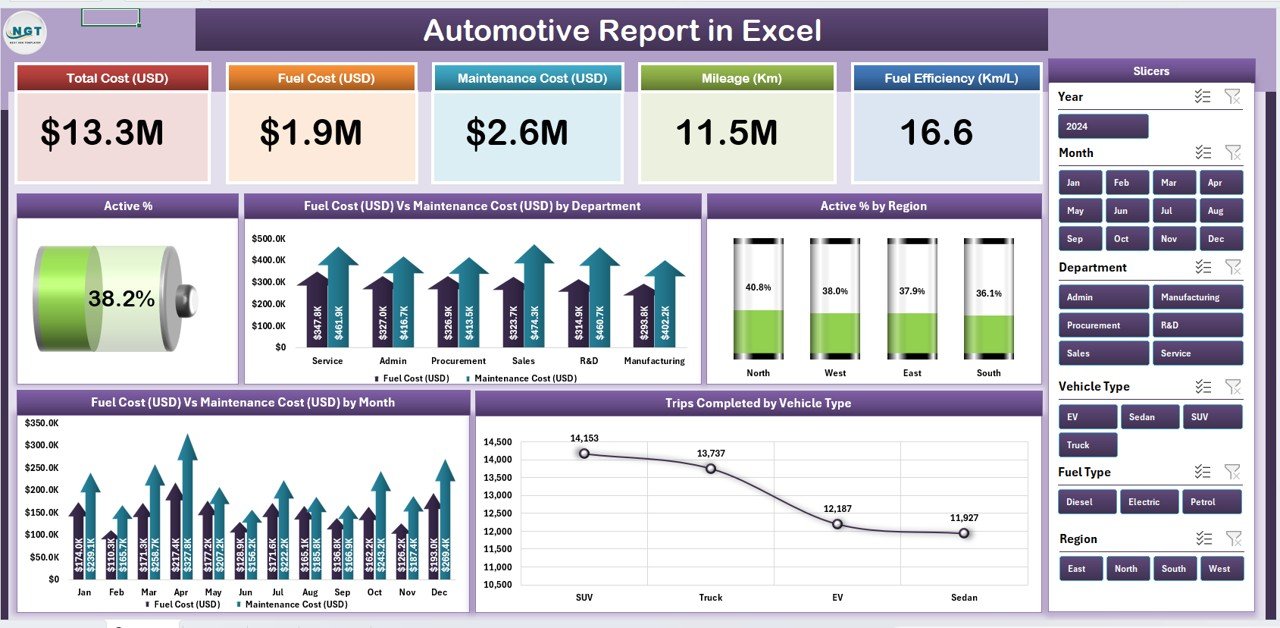
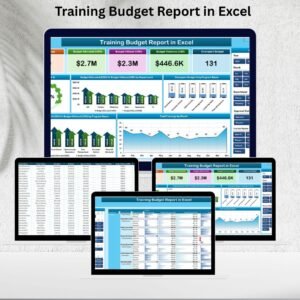
View top-level KPIs instantly through:
-
🧾 Five KPI Cards: Total Vehicles, Total Trips, Fuel Cost (USD), Maintenance Cost (USD), Active %
-
🎛️ Slicers: Filter by Month, Region, or Department
-
📈 Charts:
-
Active % by Region
-
Fuel vs Maintenance Cost by Department
-
Trips Completed by Vehicle Type
-
Active % Trends Over Time
-
This page provides executives a one-glance performance summary for decision-making.
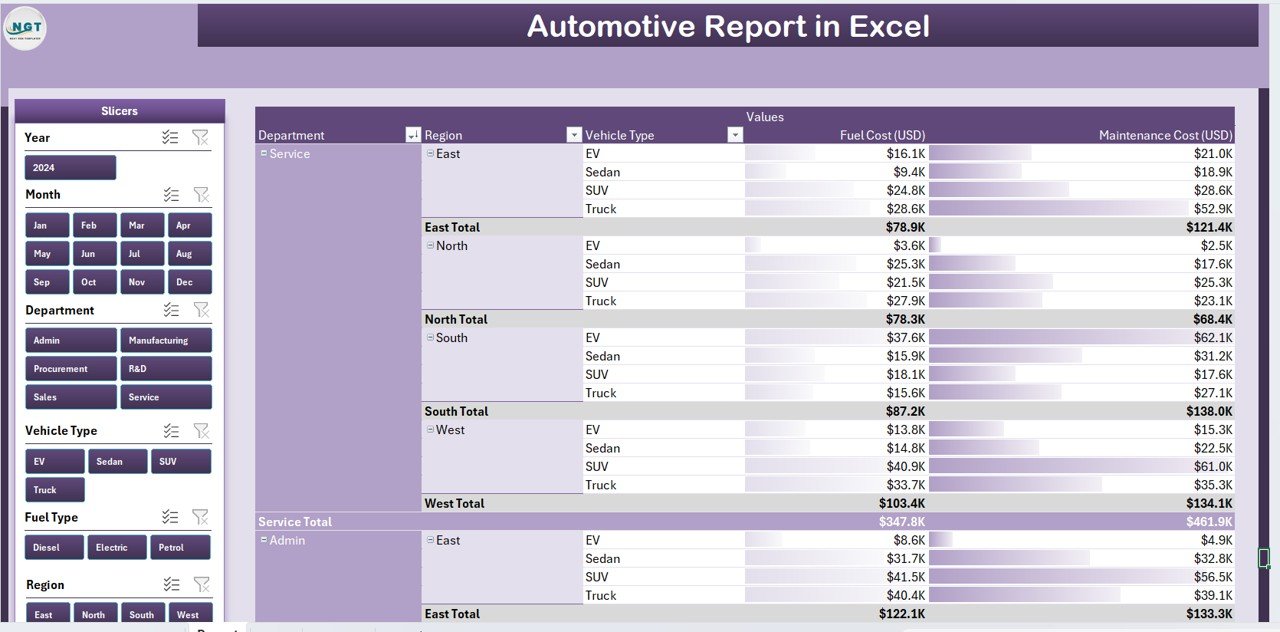
✅ 📑 Report Page – Detailed Analysis at Your Fingertips
Dive deep into granular data with filters and tables that display:
-
Vehicle ID, Department, Region, Trips, Fuel & Maintenance Costs, and Active Days.
-
Use sorting and filters to identify high-cost or underperforming vehicles.
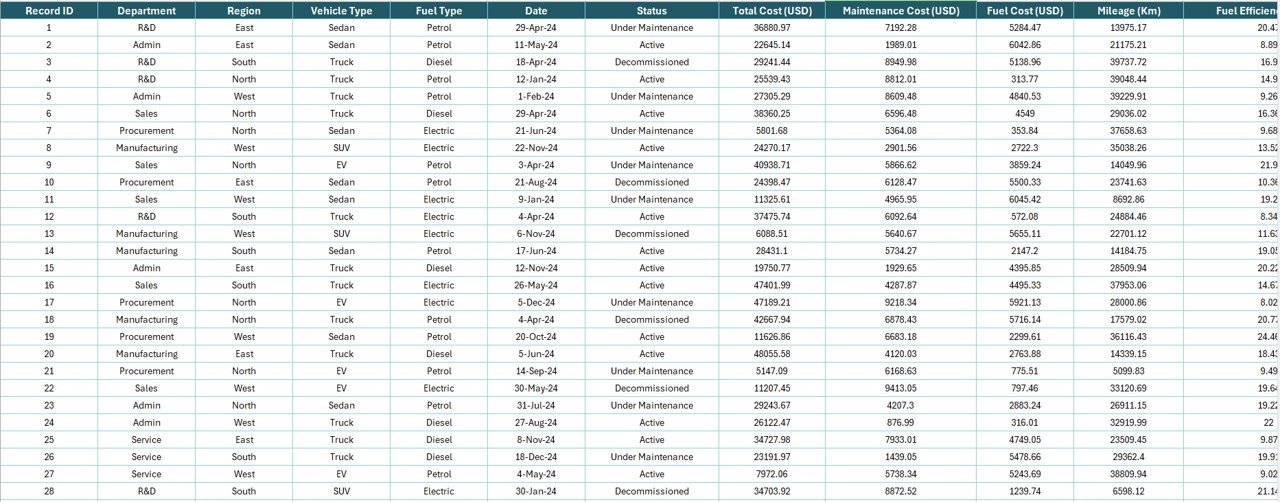
✅ 💾 Data Sheet – The Backbone of the Report
Enter all vehicle details — including fuel cost, maintenance cost, trips, and active % — once a month. All visuals update automatically.
✅ ⚙️ Support Sheet – Standardization for Accuracy
Contains reference lists for dropdowns such as Departments, Regions, and Vehicle Types to keep your entries consistent.
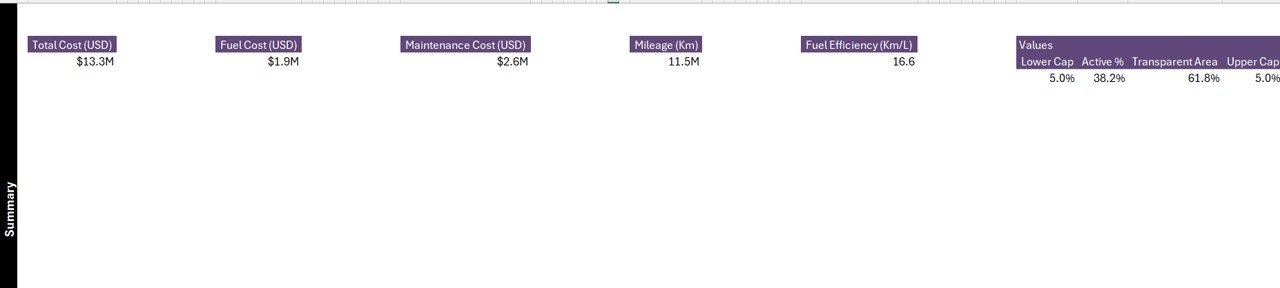
✅ 📈 Auto-Calculated KPIs – Built-in formulas calculate totals, averages, and percentages automatically, eliminating manual work.
✅ 🧠 100% Customizable – Add new charts, KPIs, or columns easily — no coding required!
✅ 🔍 Interactive Slicers – Filter data dynamically across all visuals to analyze trends effortlessly.
🧩 What’s Inside the Automotive Report
📁 Summary Page: A visual snapshot of all fleet KPIs.
📁 Report Page: In-depth analysis by region, vehicle, or month.
📁 Data Sheet: The source of all raw metrics and figures.
📁 Support Sheet: Dropdown references for consistency.
Each page connects seamlessly, updating visuals automatically when new data is added.
💡 How to Use the Automotive Report in Excel
1️⃣ Enter Monthly Data: Record fuel, maintenance, and trip details in the Data Sheet.
2️⃣ Refresh Dashboard: Charts and KPIs update instantly.
3️⃣ Use Filters: Slice data by Region, Department, or Vehicle Type.
4️⃣ Review Trends: Identify cost spikes, performance drops, or underutilized vehicles.
5️⃣ Generate Reports: Export to PDF for quick team reviews.
It’s that simple — no macros or coding needed.
👥 Who Can Benefit from This Dashboard
🚚 Fleet Managers – Monitor fuel, usage, and efficiency across vehicles.
🏢 Operations Heads – Ensure departments meet utilization and cost targets.
💰 Finance Teams – Track and analyze fuel and maintenance budgets.
🔧 Workshop Supervisors – Plan and review maintenance schedules.
📊 Logistics Coordinators – Optimize routes and trip assignments.
From corporate fleets to logistics firms, this report helps every team make data-driven decisions faster.
🌟 Why You’ll Love This Report
-
📊 Centralized Fleet Data – Manage all operations in one file.
-
⚙️ Automated Analytics – Instant calculations and chart updates.
-
💰 Cost Optimization – Identify and reduce unnecessary expenses.
-
🚀 Improved Utilization – Track vehicle performance and maximize ROI.
-
🎨 Professional Visualization – Clean, modern charts for clarity.
-
💡 Customizable & Scalable – Adaptable for any organization size.
-
🧩 Offline Ready – No internet or add-ons needed.
-
⏱️ Time-Saving Design – Spend less time reporting, more on strategy.
🔗 Click here to read the Detailed blog post
📺 Visit our YouTube channel to learn step-by-step video tutorials
👉 YouTube.com/@PKAnExcelExpert


Reviews
There are no reviews yet.