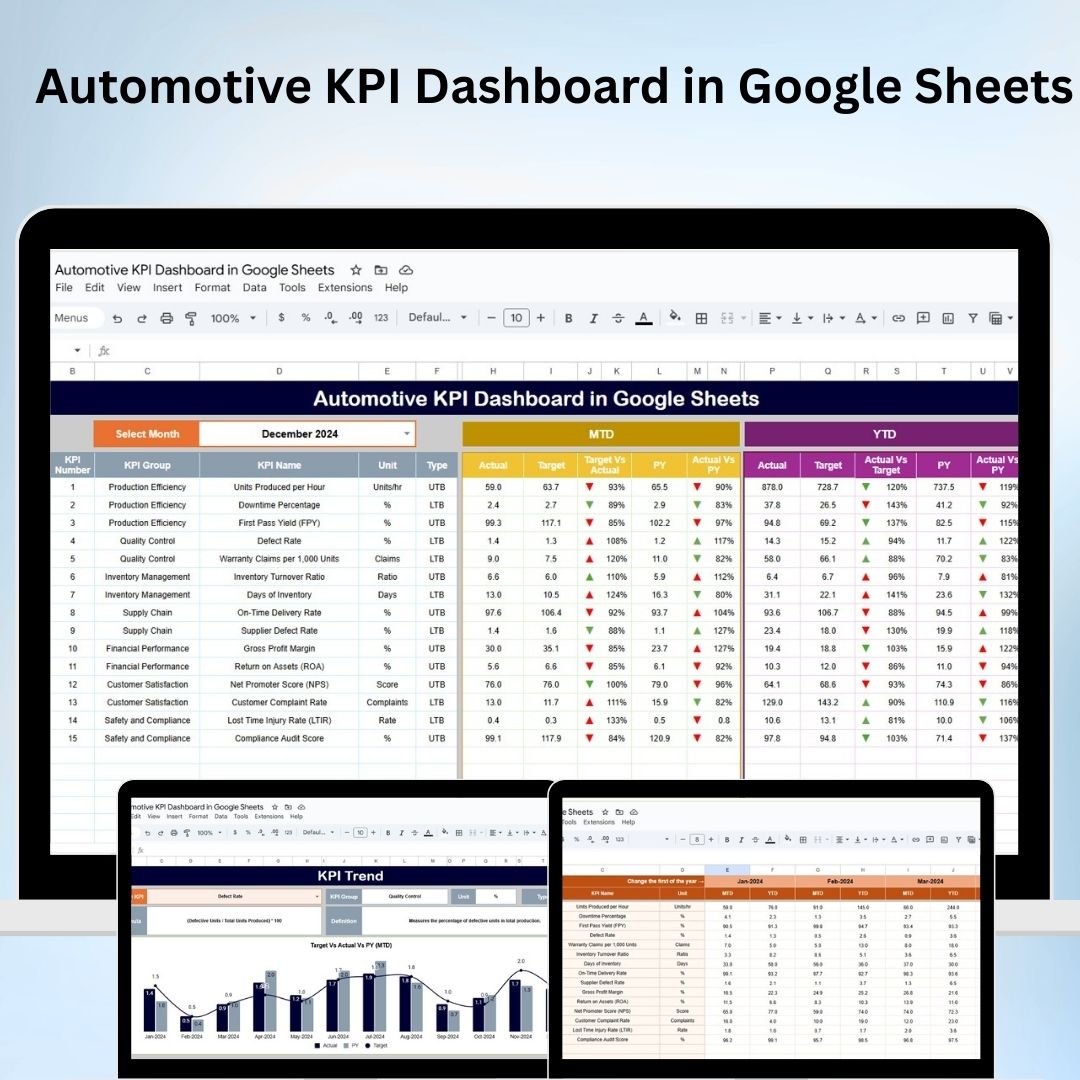
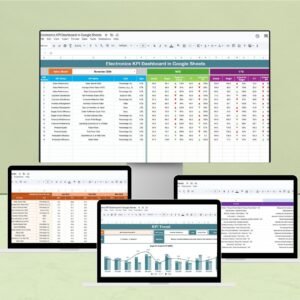
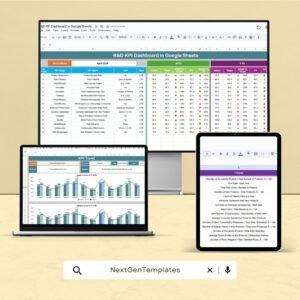
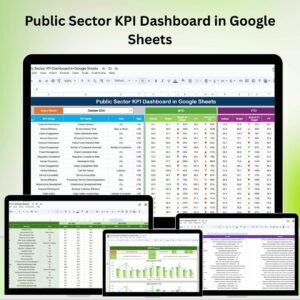
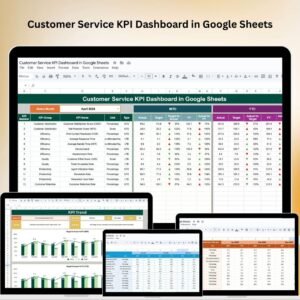
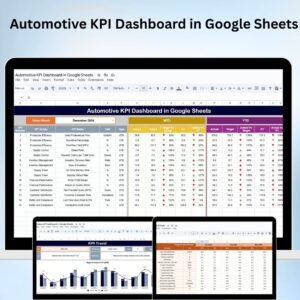
The Automotive KPI Dashboard in Google Sheets is a comprehensive tool designed to help automotive businesses track, monitor, and optimize their key performance indicators (KPIs). This dashboard allows automotive teams to visualize critical metrics such as vehicle sales, service performance, inventory management, and customer satisfaction, all in one place. By using this dashboard, organizations can improve operational efficiency, enhance profitability, and make data-driven decisions to drive success in the automotive industry.
Key Features of the Automotive KPI Dashboard in Google Sheets
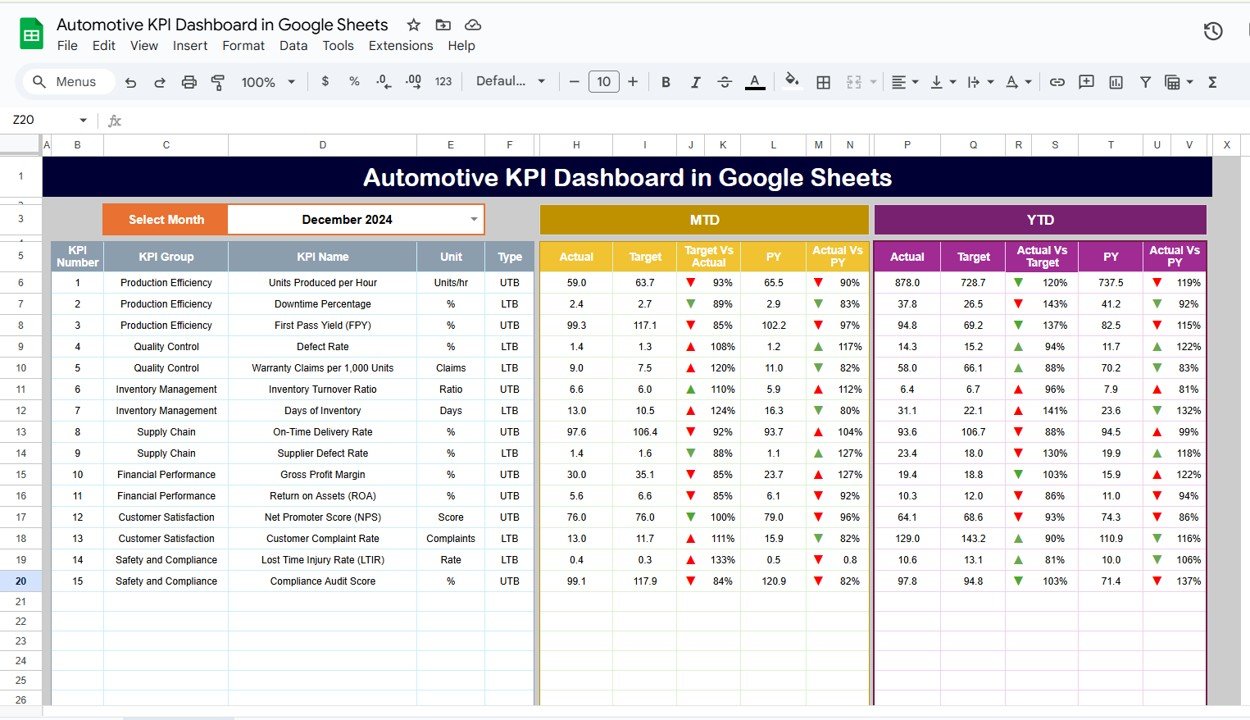
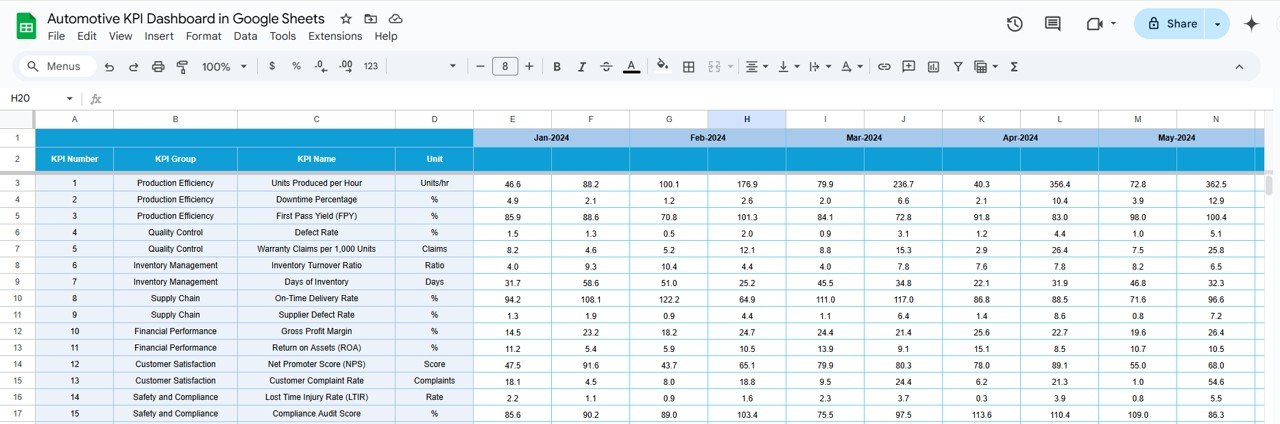
📊 Comprehensive KPI Tracking
-
Monitor Key Metrics: Track essential KPIs like vehicle sales, service center performance, customer satisfaction, parts inventory, and more.
-
Real-Time Data Updates: Keep the dashboard updated with live data, ensuring accurate and timely insights for decision-making.
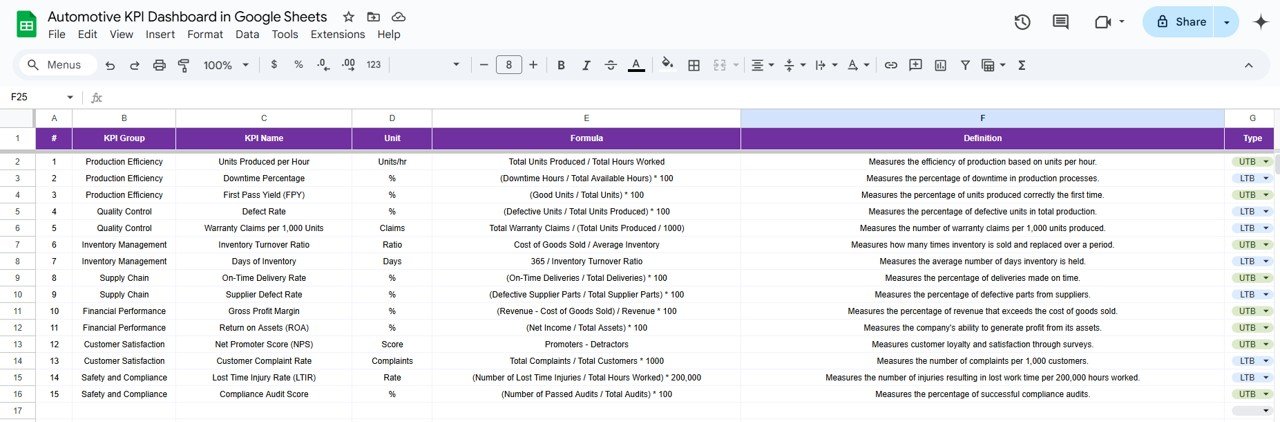
📈 Customizable Metrics
-
Tailored to Your Needs: Easily define and track KPIs that are specific to your automotive business objectives.
-
Flexible Layout: Add or remove metrics based on your business requirements and operational goals.
🔧 User-Friendly Interface
-
Simple Setup: The dashboard is designed to be intuitive and user-friendly, making it accessible even to users with minimal technical experience.
-
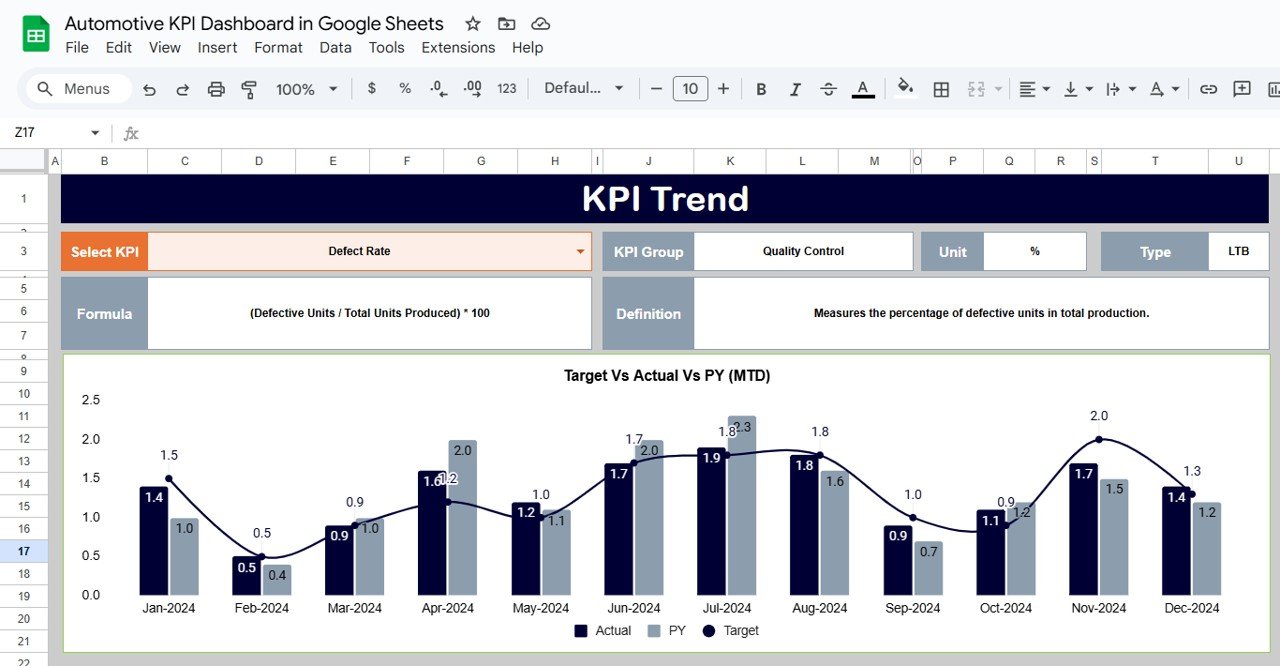
Visual Data: Use graphs, charts, and color-coded indicators to easily visualize trends and identify performance gaps.
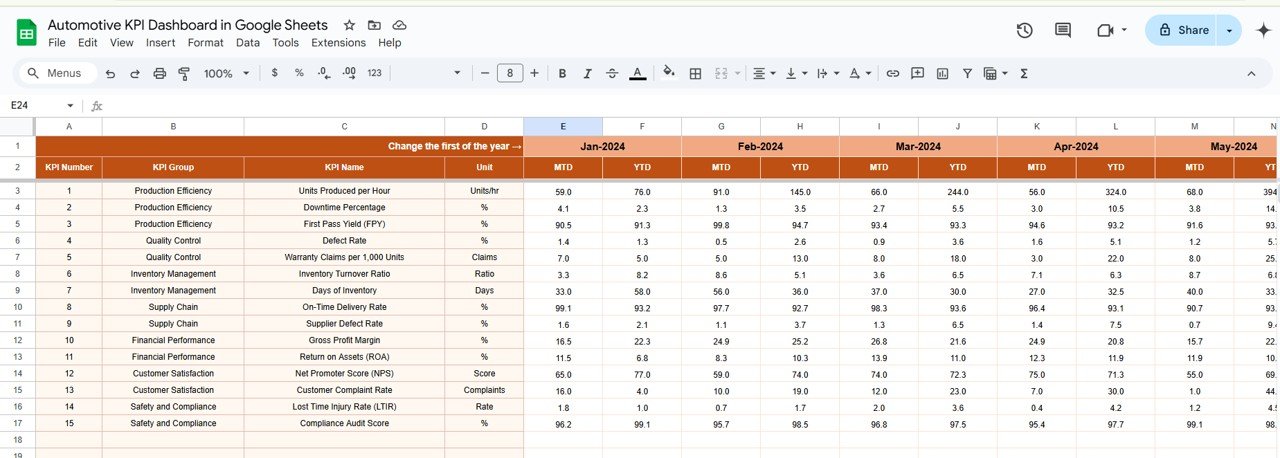
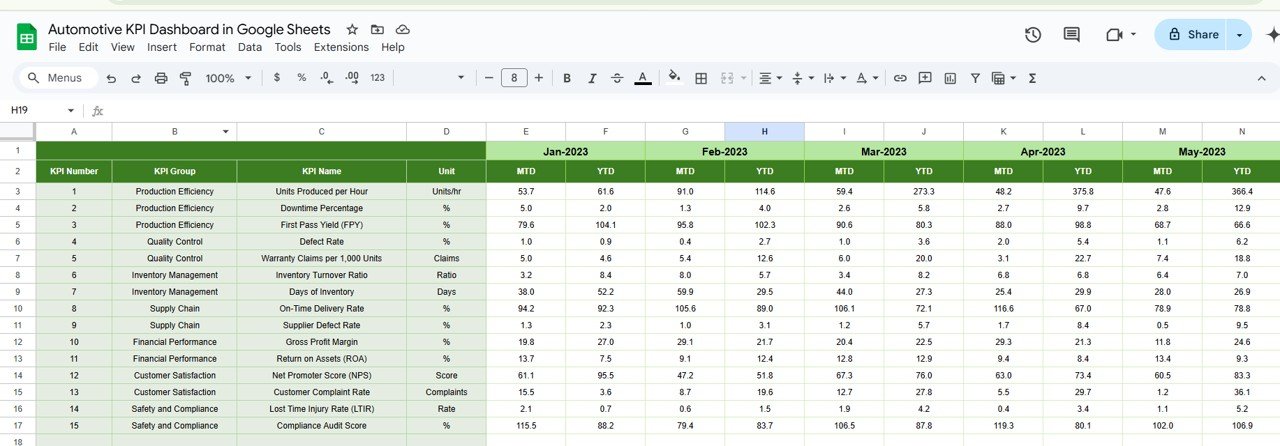
📅 Performance Monitoring & Reporting
-
Track MTD & YTD: Monitor Month-to-Date (MTD) and Year-to-Date (YTD) performance for comparing current results with historical data.
-
Target vs. Actual Comparison: Measure actual performance against predefined targets to evaluate success and identify areas for improvement.
Benefits of Using the Automotive KPI Dashboard in Google Sheets
✅ Informed Decision-Making
Access real-time data and insights that allow you to make quick, informed decisions for improving your automotive operations.
✅ Operational Efficiency
Track key metrics like inventory turnover, vehicle sales, and service performance to identify opportunities to optimize efficiency and reduce costs.
✅ Improved Customer Satisfaction
By monitoring customer feedback and satisfaction KPIs, you can make improvements that directly enhance the customer experience, leading to better retention and loyalty.
✅ Increased Profitability
Optimize vehicle sales, service department efficiency, and inventory management to boost profitability and achieve long-term success in the automotive business.
Getting Started with Your Automotive KPI Dashboard in Google Sheets
-
Download the Template: Download the Automotive KPI Dashboard template to start customizing it for your specific needs.
-
Define Your KPIs: Set up the KPIs that reflect your automotive business objectives, including sales, service, inventory, and customer satisfaction metrics.
-
Input Data: Regularly input data to keep the dashboard updated and accurate.
-
Analyze Performance: Use the dashboard’s charts and graphs to analyze your business performance and identify trends.
-
Take Action: Make informed decisions based on the insights gained to improve operational efficiency and profitability.
By using the Automotive KPI Dashboard in Google Sheets, automotive businesses can streamline their operations, optimize performance, and increase profitability.
Click here to read the Detailed blog post
Automotive KPI Dashboard in Google Sheets
Visit our YouTube channel to learn step-by-step video tutorials
YouTube.com/@NeotechNavigators


Reviews
There are no reviews yet.