Managing automotive operations without structured reporting creates confusion and inefficiency. Many fleet managers, transport departments, and automotive companies still rely on scattered spreadsheets. As a result, they struggle to monitor fuel costs, maintenance expenses, vehicle utilization, and mileage trends in a clear and centralized manner.
That is exactly why the Automotive Dashboard in Google Sheets is an essential tool for modern fleet management.
This ready-to-use and fully interactive dashboard transforms raw operational data into powerful visual insights. Instead of manually compiling multiple reports, you can track total cost, fuel efficiency, vehicle activity, regional performance, and monthly trends — all within one dynamic Google Sheets environment.
Because the dashboard runs in Google Sheets, your team can collaborate in real time from anywhere, ensuring faster decision-making and better operational control.
🚀 Key Feature of Automotive Dashboard in Google Sheets
✅ Executive KPI Cards – Instantly view Total Cost, Fuel Cost, Maintenance Cost, Mileage, and Fuel Efficiency.
✅ Multi-Page Analytical Structure – Overview, Department, Region, Vehicle, and Monthly Trend pages.
✅ Interactive Filters & Slicers – Drill down by department, region, vehicle type, and fuel type.
✅ Fuel vs Maintenance Cost Comparison – Identify cost-heavy areas quickly.
✅ Vehicle Utilization Monitoring – Track active and under-maintenance vehicles clearly.
✅ Monthly Trend Analysis – Analyze performance patterns over time.
✅ Smart Search & Record Lookup – Find specific records instantly.
Because of these features, automotive managers gain full visibility into fleet operations without complex systems.
📦 What’s Inside the Automotive Dashboard in Google Sheets
This professionally structured dashboard includes multiple analytical pages designed for complete fleet performance tracking.
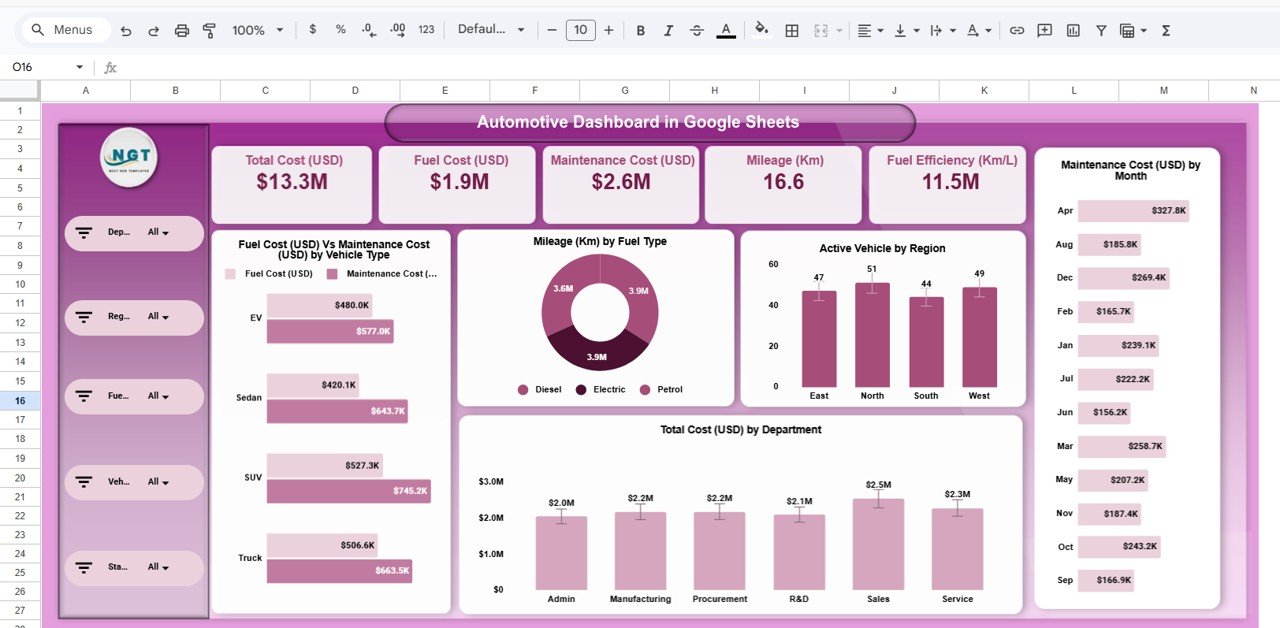
1️⃣ Overview Page – Executive Summary
The main dashboard presents a high-level operational snapshot:
-
Total Cost (USD)
-
Fuel Cost (USD)
-
Maintenance Cost (USD)
-
Mileage (Km)
-
Fuel Efficiency (Km/L)
Visual insights include:
-
Fuel Cost vs Maintenance Cost by Vehicle Type
-
Mileage by Fuel Type (Donut Chart)
-
Active Vehicles by Region
-
Maintenance Cost by Month
-
Total Cost by Department
This page gives leadership instant clarity.
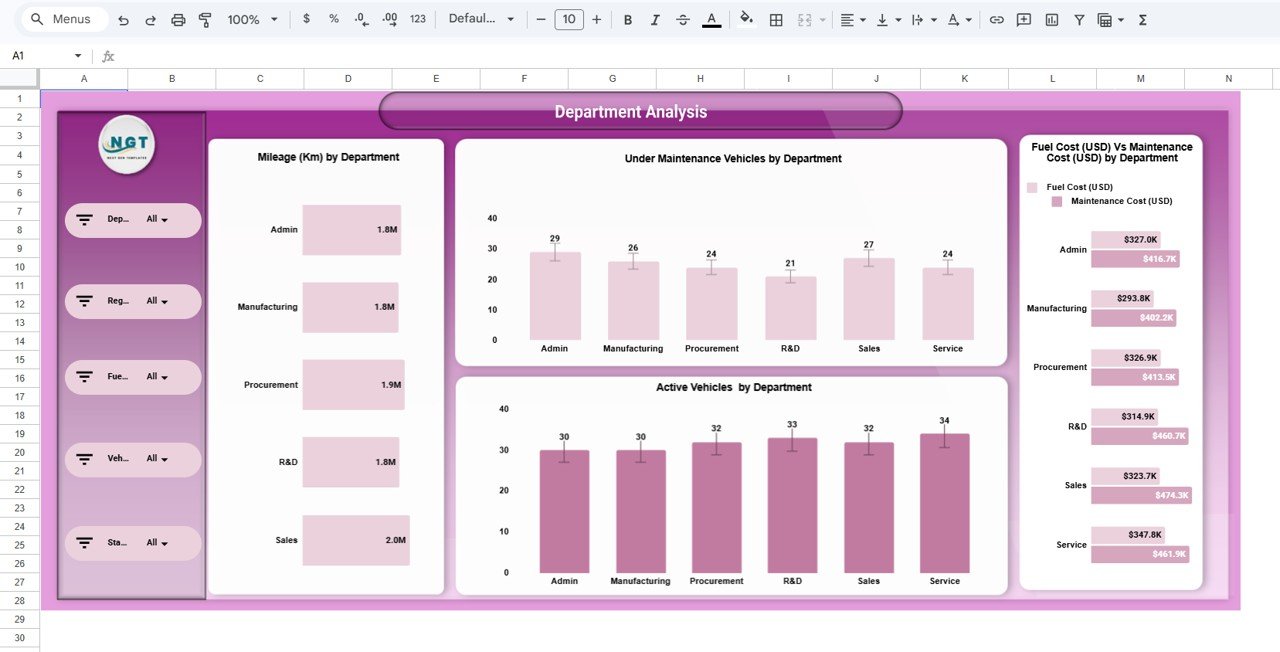
2️⃣ Department Analysis Page – Operational Comparison
Analyze performance across departments with reports on:
-
Mileage by Department
-
Under Maintenance Vehicles by Department
-
Active Vehicles by Department
-
Fuel Cost vs Maintenance Cost by Department
This helps identify high-cost departments and improve utilization.
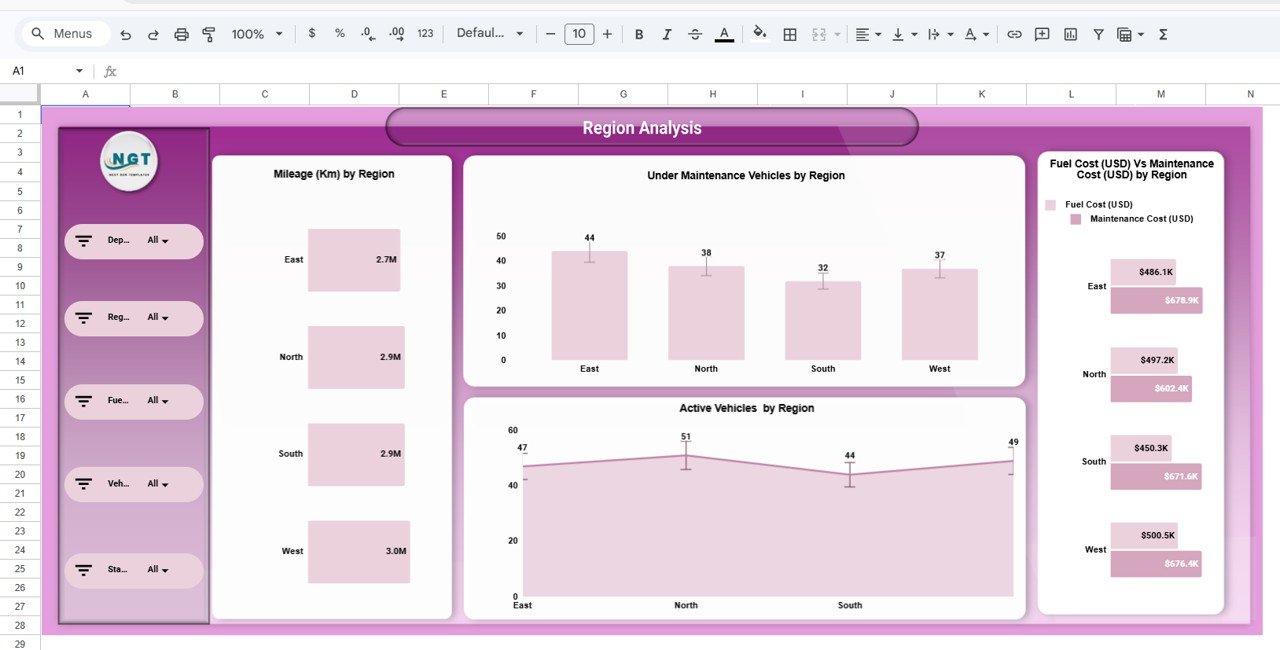
3️⃣ Region Analysis Page – Geographic Insights
Evaluate fleet performance by location:
-
Mileage by Region
-
Under Maintenance Vehicles by Region
-
Active Vehicles by Region
-
Fuel vs Maintenance Cost by Region
This supports regional cost control and performance benchmarking.
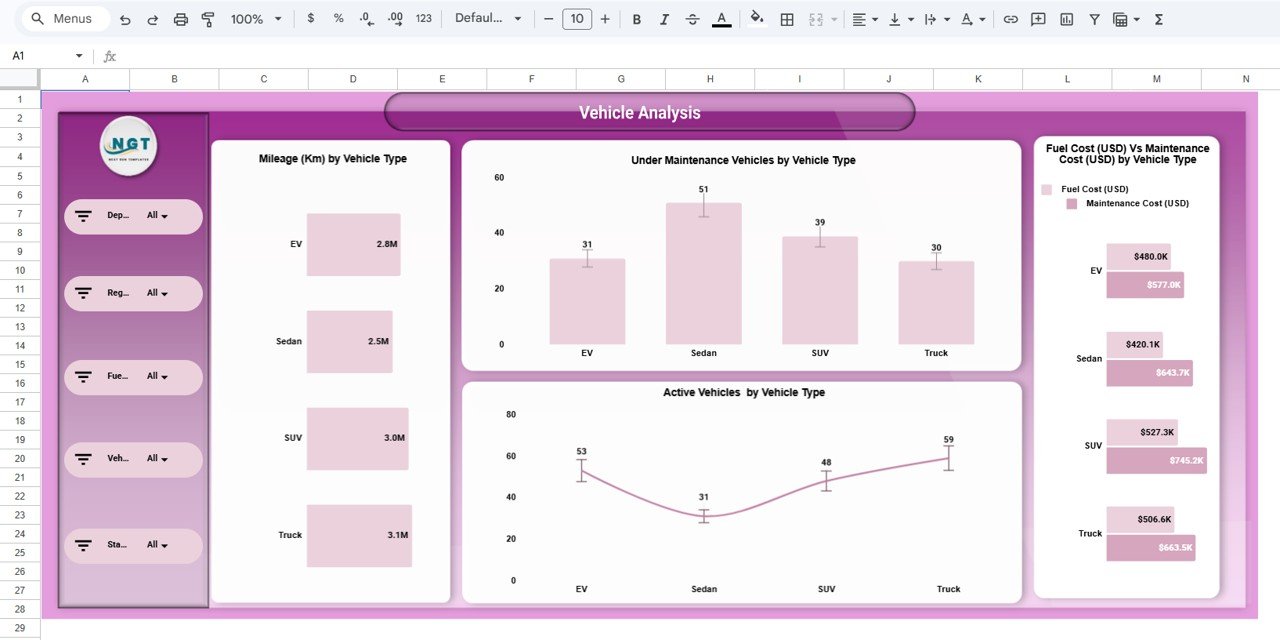
4️⃣ Vehicle Analysis Page – Category Performance
Track vehicle types such as EV, Sedan, SUV, and Truck:
-
Mileage by Vehicle Type
-
Under Maintenance Vehicles by Vehicle Type
-
Active Vehicles by Vehicle Type
-
Fuel vs Maintenance Cost by Vehicle Type
This helps detect underperforming vehicle categories.
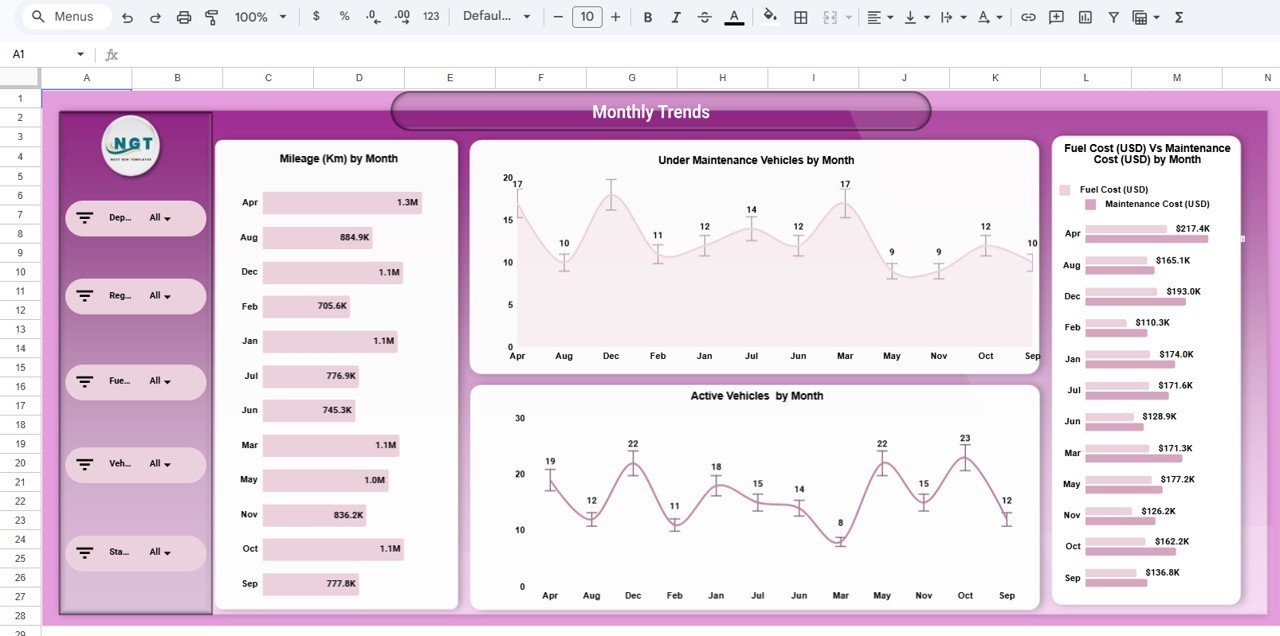
5️⃣ Monthly Trends Page – Time-Based Analysis
Monitor monthly operational changes:
-
Mileage by Month
-
Under Maintenance Vehicles by Month
-
Active Vehicles by Month
-
Fuel vs Maintenance Cost by Month
Trend analysis improves forecasting and budgeting accuracy.
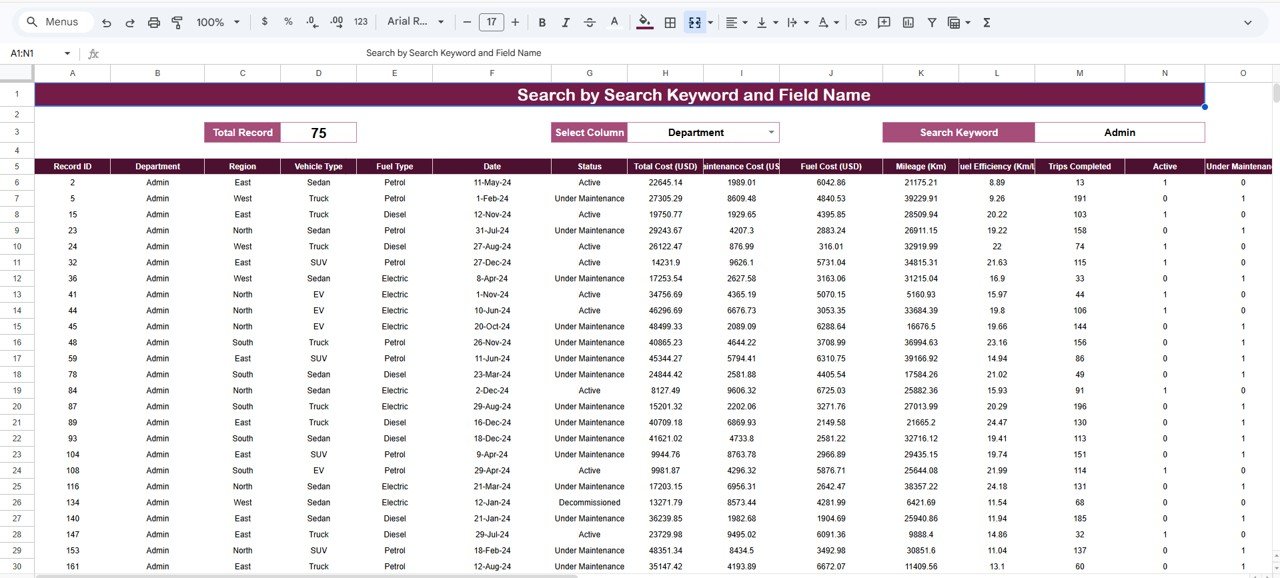
6️⃣ Search & Record Analysis Section – Advanced Lookup
Use keyword and field search to:
-
Select a column
-
Enter a search keyword
-
View filtered records instantly
This enhances data exploration and audit flexibility.
⚙️ How to Use the Automotive Dashboard in Google Sheets
Getting started is simple:
-
Open the Google Sheets template
-
Enter your fleet data into the data table
-
Use filters to drill down by region, department, or vehicle type
-
Review KPI cards for instant operational insight
-
Analyze trends before making strategic decisions
-
Use the Search panel for quick record lookup
Within minutes, your automotive data becomes clear and actionable.
👥 Who Can Benefit from This Automotive Dashboard in Google Sheets
This dashboard is ideal for organizations managing vehicles and transport operations.
Perfect for:
-
🚚 Fleet Managers
-
🚗 Automotive Companies
-
🏢 Corporate Transport Departments
-
🚛 Logistics Companies
-
🏭 Service Providers
-
🏛️ Government Transport Authorities
Because automotive operations require continuous monitoring, this dashboard supports multiple industries.
By implementing the Automotive Dashboard in Google Sheets, your organization gains:
-
Centralized fleet visibility
-
Real-time operational insights
-
Improved cost transparency
-
Better maintenance planning
-
Smarter vehicle utilization tracking
-
Faster data-driven decisions
In today’s competitive environment, reactive fleet management is expensive and inefficient. You need proactive performance monitoring.
This dashboard delivers exactly that.
🔗 Click here to read the Detailed blog post
Watch the step-by-step video tutorial: