In today’s fast-paced digital landscape, businesses are flooded with massive volumes of data every single day. However, when this data remains scattered across reports and spreadsheets, it becomes difficult to extract meaningful insights. As a result, organizations struggle with slow decision-making and missed opportunities.
So, how can you transform raw data into powerful, AI-driven insights instantly?
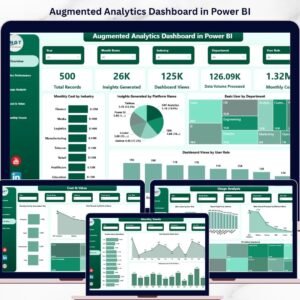
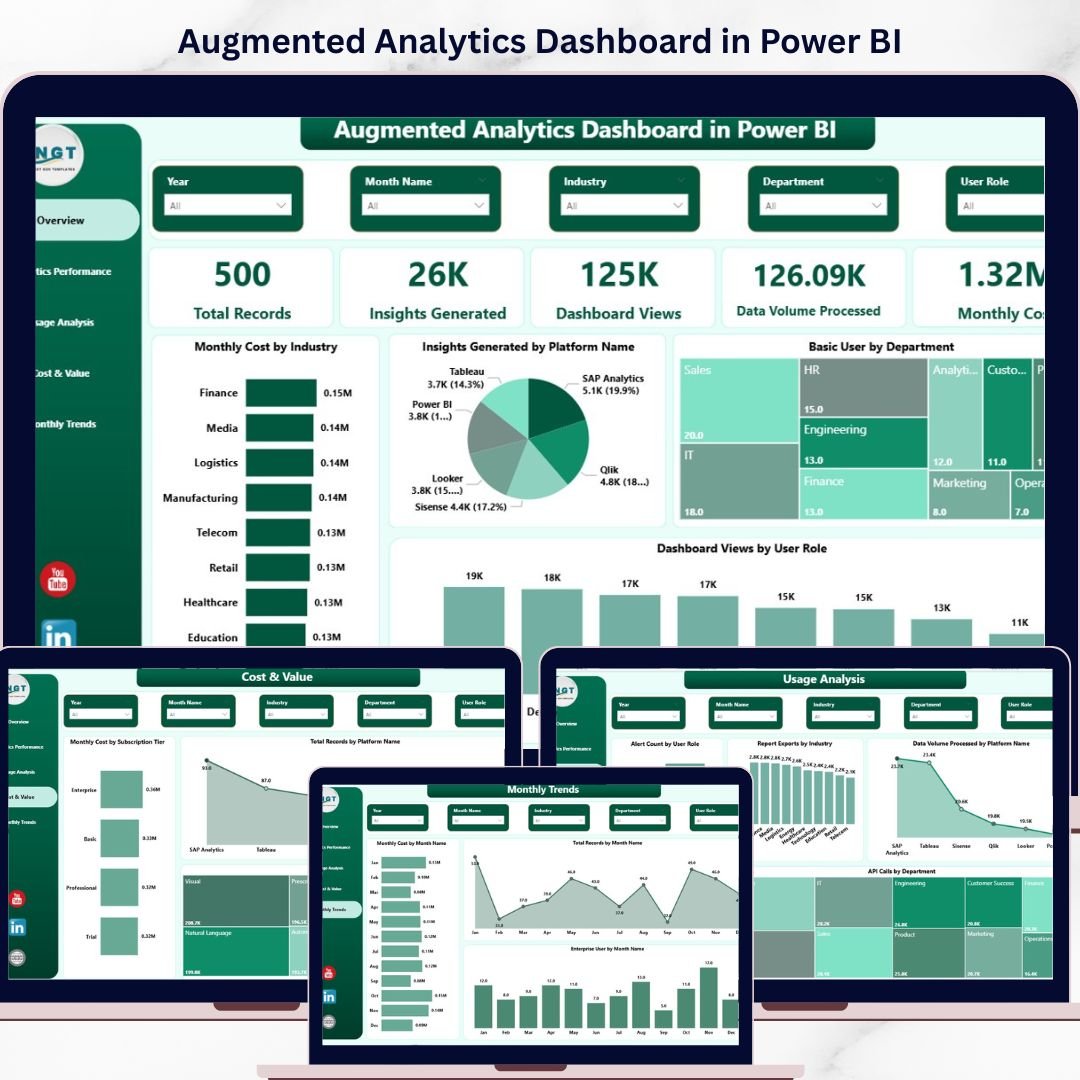
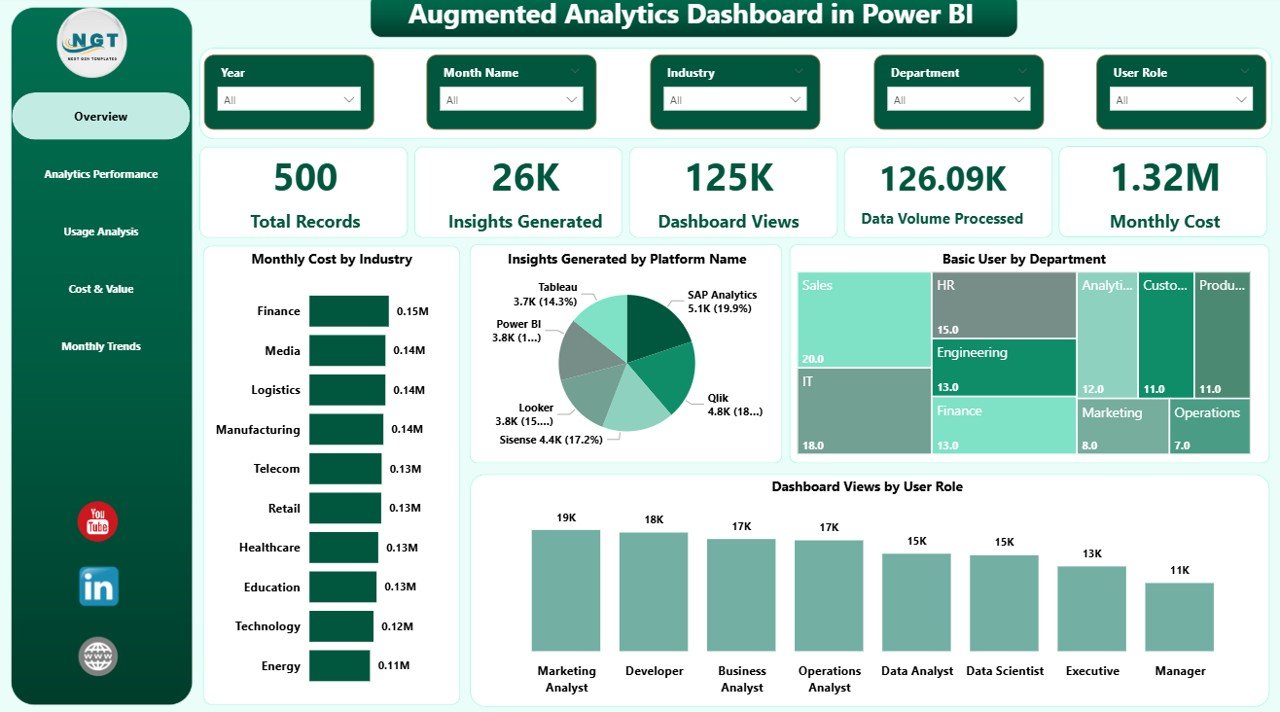
👉 The answer is the Augmented Analytics Dashboard in Power BI.
This advanced and interactive dashboard leverages artificial intelligence and business intelligence to automate insights, enhance accuracy, and improve decision-making. Moreover, it converts complex datasets into visually rich and easy-to-understand reports. Therefore, you can identify trends, monitor performance, and take action faster than ever before.
🚀 Key Features of Augmented Analytics Dashboard in Power BI
✨ AI-Powered Insights Generation
Automatically uncover hidden patterns and trends without manual analysis.
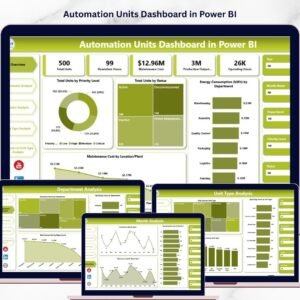
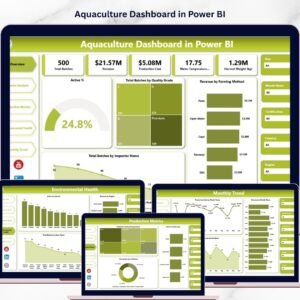
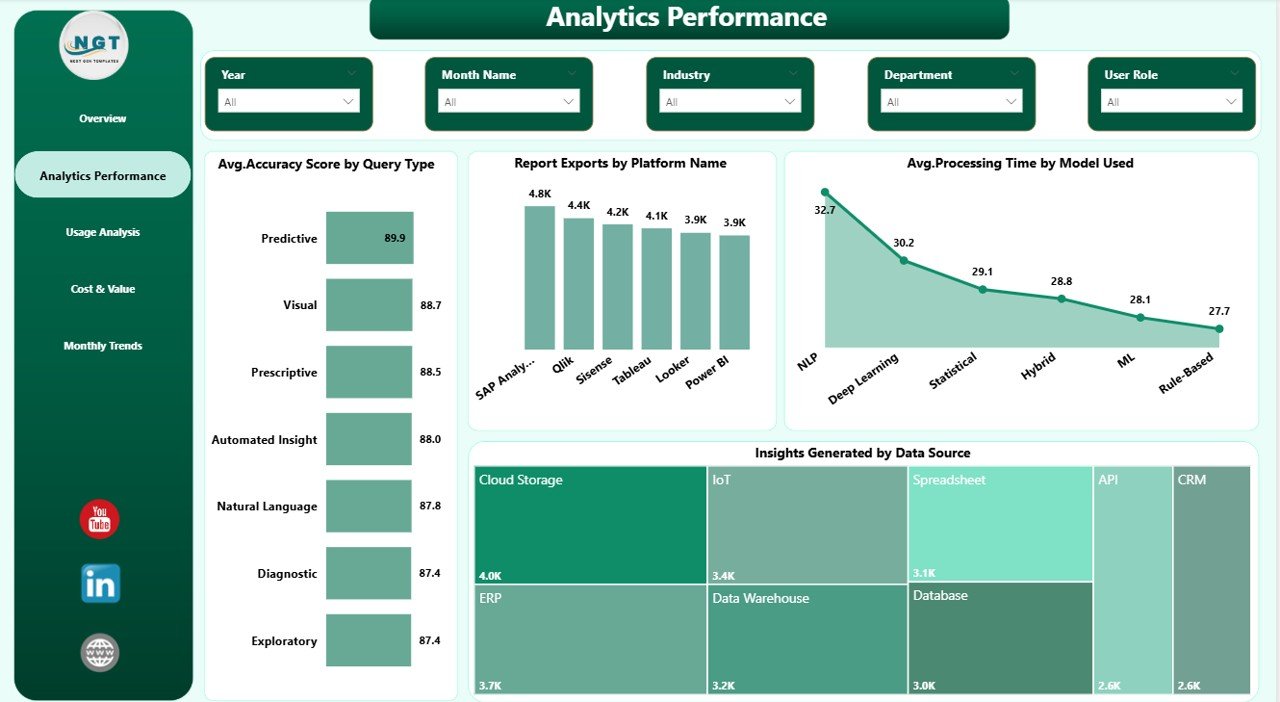
📊 5 Interactive Dashboard Pages
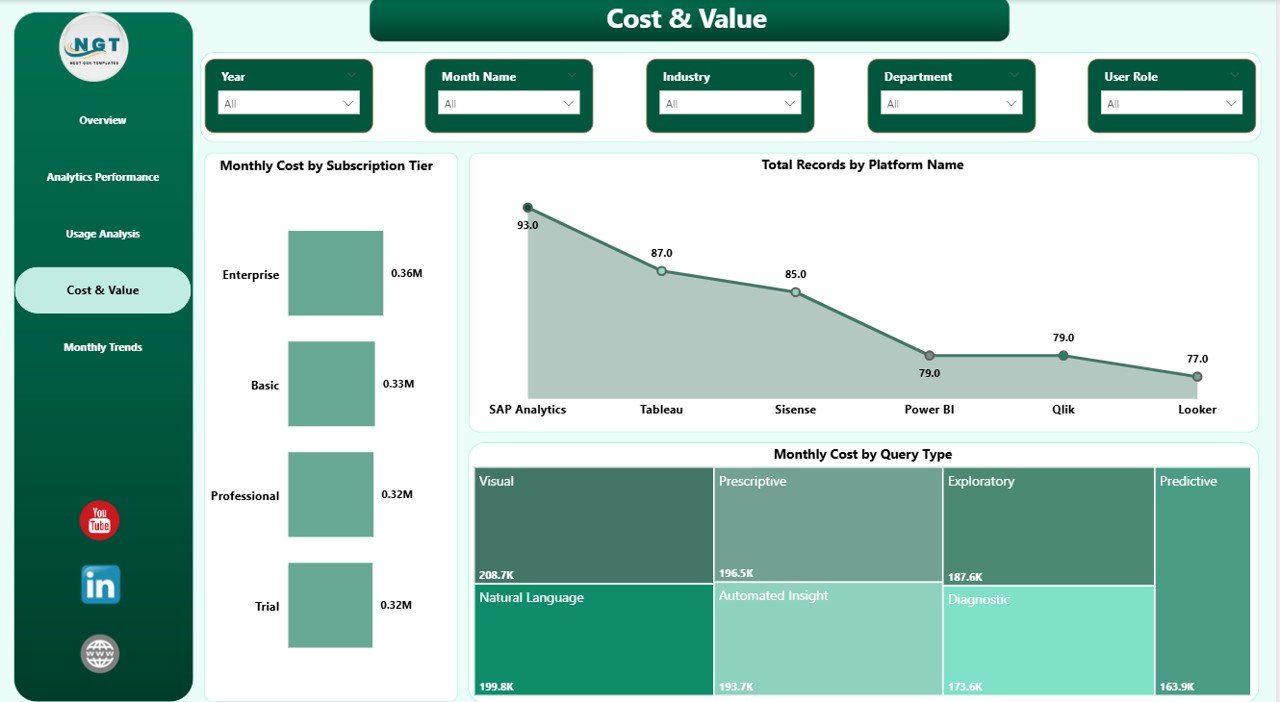
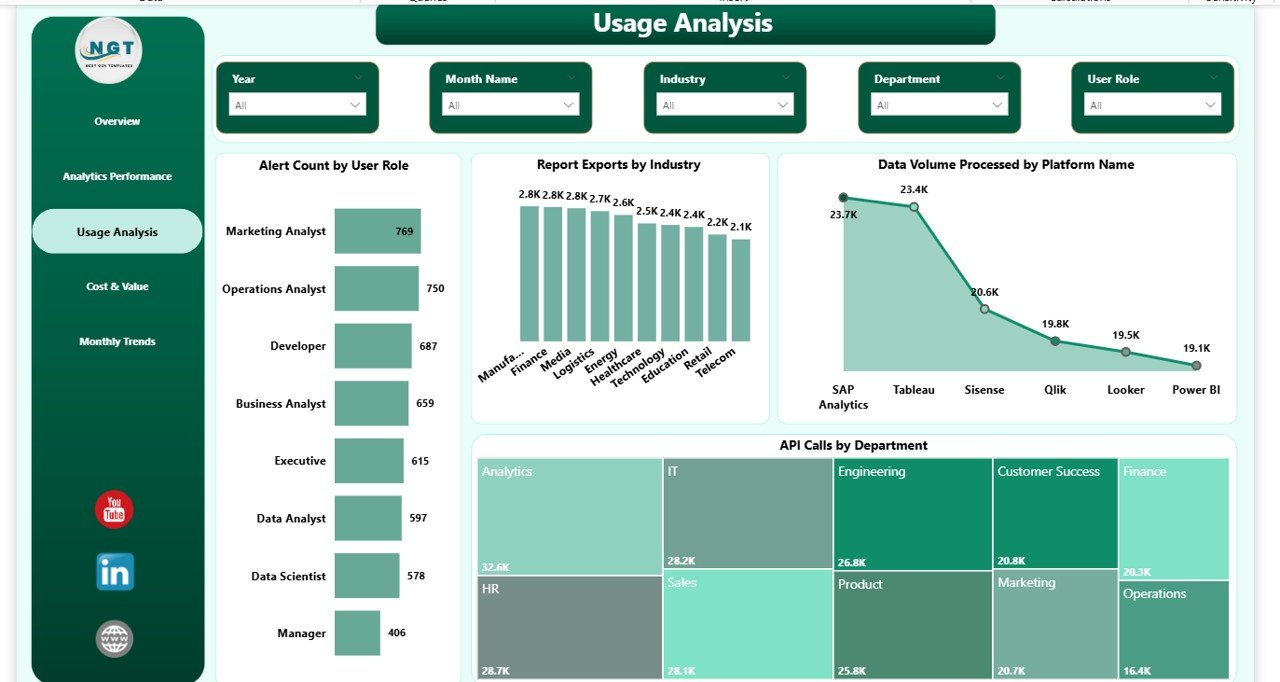
Includes Overview, Analytics Performance, Usage Analysis, Cost & Value, and Monthly Trends.
📈 Dynamic KPI Cards
Track key metrics like Total Records, Insights Generated, Monthly Cost, and more.
⚙️ Advanced Performance Tracking
Measure accuracy, processing time, and analytics efficiency with detailed visuals.
📉 User Behavior & Usage Insights
Understand how users interact with dashboards, APIs, and reports.
💰 Cost & ROI Monitoring
Analyze subscription costs, data usage, and value generated.
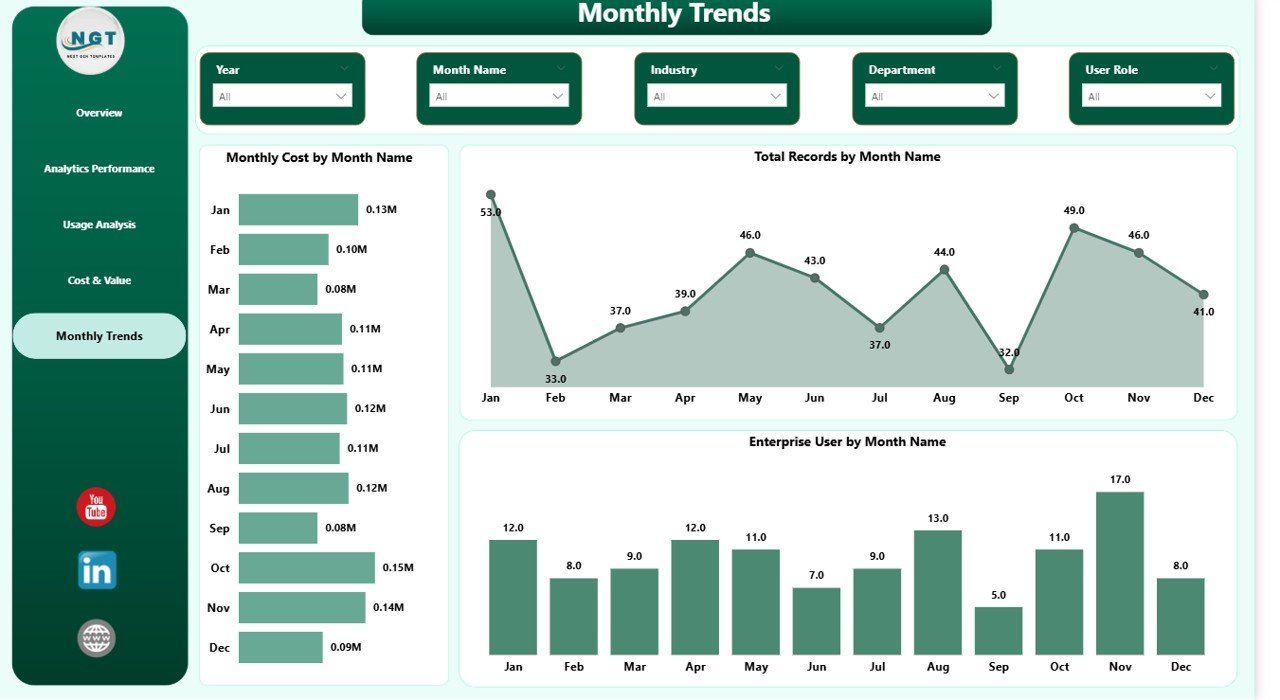
📅 Trend Analysis Over Time
Track monthly growth, user trends, and performance patterns.
🎯 Interactive Filters & Slicers
Drill down into data and perform customized analysis effortlessly.
📦 What’s Inside the Augmented Analytics Dashboard in Power BI
📁 Power BI Dashboard File (.pbix)
Fully functional and ready-to-use dashboard with interactive visuals.
📊 5 Structured Pages with Charts & KPIs
Each page is designed to provide specific insights—from performance to cost analysis.
📌 Pre-Built Visualizations
Includes bar charts, KPI cards, trend charts, and comparative visuals.
🎛️ Slicers & Filters for Easy Navigation
Allow users to explore data dynamically and efficiently.
📑 Well-Organized Data Model
Ensures smooth performance and easy customization.
🛠️ How to Use the Augmented Analytics Dashboard in Power BI
1️⃣ Import Your Data into Power BI
Load your dataset quickly into the dashboard.
2️⃣ Connect Data Sources
Link your data with the existing model for seamless integration.
3️⃣ Use Slicers for Filtering
Customize views based on departments, platforms, or time periods.
4️⃣ Analyze KPIs & Charts
Monitor performance metrics and identify key insights.
5️⃣ Make Data-Driven Decisions
Use AI-powered insights to improve strategy and outcomes.
👉 Within minutes, you’ll turn complex data into actionable intelligence.
🎯 Who Can Benefit from This Augmented Analytics Dashboard in Power BI
👨💼 Business Analysts – Gain deeper insights and improve reporting efficiency
📊 Data Analysts & Scientists – Automate analysis and reduce manual work
🧠 Decision Makers & Executives – Make faster, data-driven decisions
💻 IT & BI Teams – Monitor system performance and analytics efficiency
🏢 Industries (Finance, Healthcare, Retail, Tech) – Optimize operations and strategy
This dashboard is designed for anyone who wants to unlock the true power of data using AI-driven analytics.
Click here to read the Detailed blog post
Watch the step-by-step video tutorial: