
Understanding performance is crucial for every arts and culture organization. Whether you run a museum, gallery, theater, cultural center, or creative program, you deal with changing visitor behavior, shifting funding sources, and unpredictable event outcomes. To make confident decisions, you need accurate and real-time insights. The Arts & Culture KPI Dashboard in Power BI is built exactly for that purpose. This ready-to-use dashboard transforms complex data into clean visuals, giving you clear performance visibility in just one click.Arts & Culture KPI Dashboard in Power BI
With this dashboard, your entire team gains access to powerful insights—ranging from visitor engagement and sponsorship income to event performance and operational efficiency. Instead of juggling spreadsheets or manually comparing reports, you get an automated Power BI dashboard that updates instantly whenever new data is added to the Excel source file. It’s fast, easy, and designed for cultural organizations of every size.
✨ Key Features of Arts & Culture KPI Dashboard in Power BI
This dashboard is packed with features that help cultural leaders make smarter decisions every month.
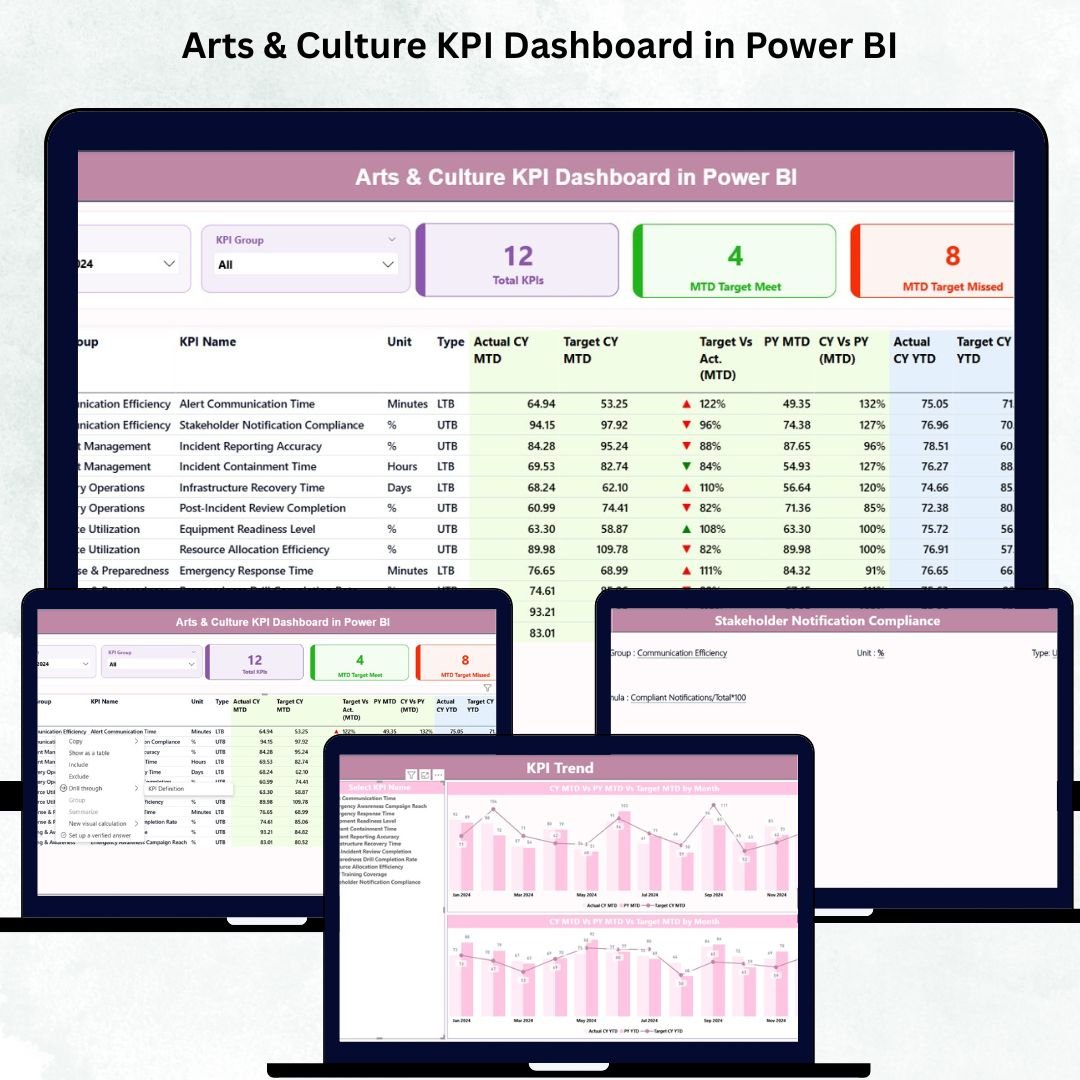
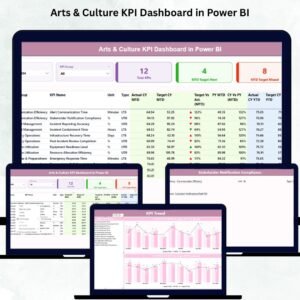
🎭 Interactive Summary Page – View KPIs, performance cards, and detailed tables for Monthly (MTD) and Year-to-Date (YTD) insights.
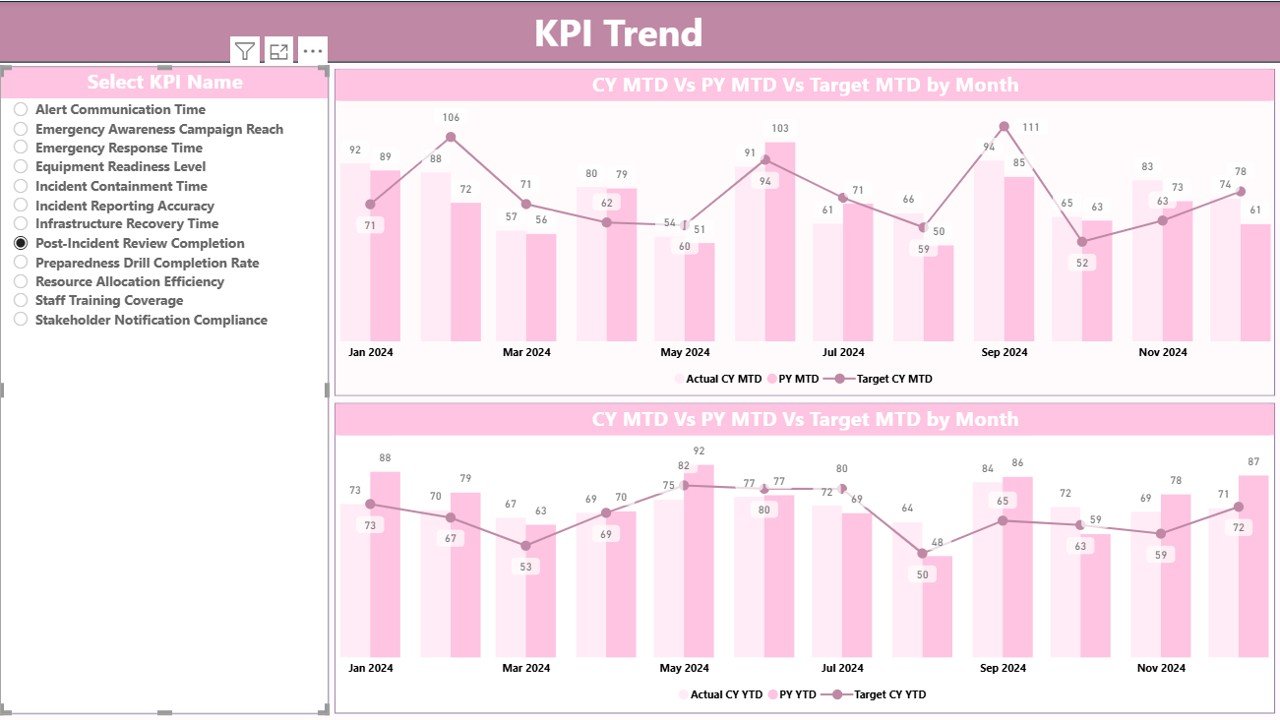
📊 KPI Trend Charts – Analyze month-wise and year-wise performance using combo charts for actuals vs targets.
📅 Powerful Slicers – Quickly filter data by Month or KPI Category for focused analysis.
📈 Instant Trend Comparison – Compare Current Year vs Previous Year performance for deeper visibility.
🔍 Detailed KPI Table – Includes KPI Group, KPI Type (LTB/UTB), Targets, Actuals, and performance icons.
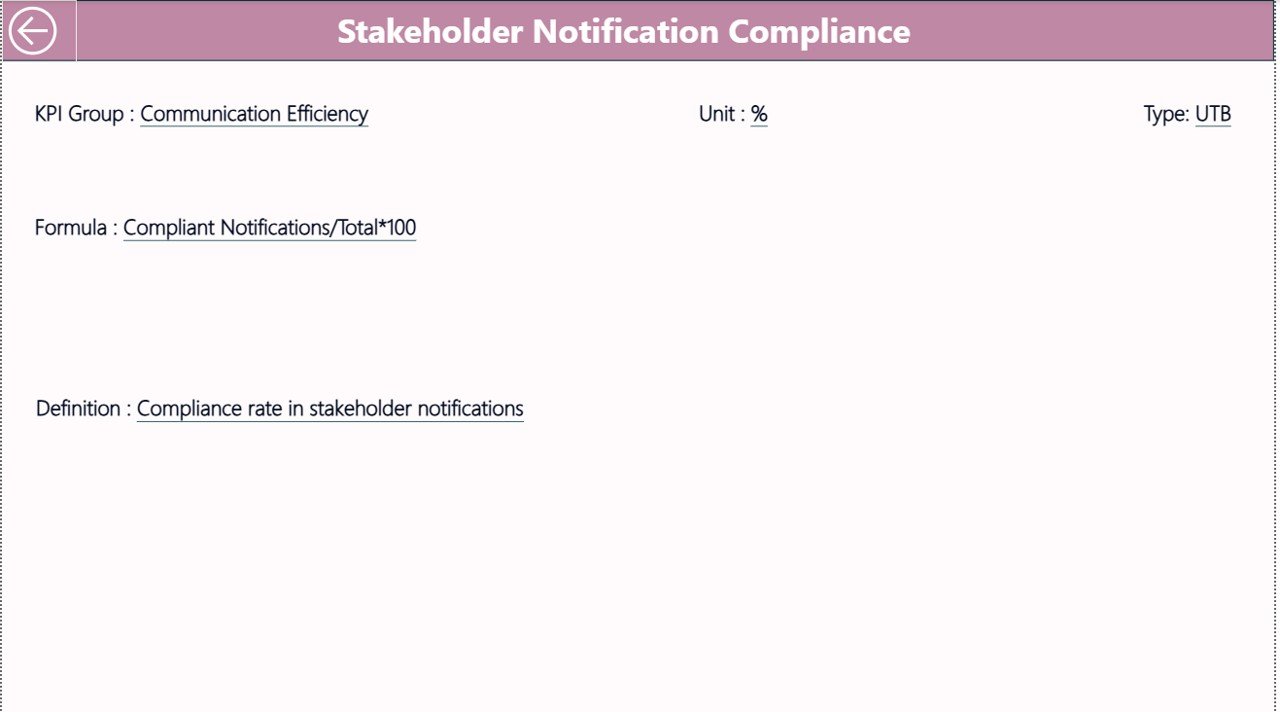
📘 KPI Definition Page – Understand formulas, logic, and definitions behind every KPI for complete transparency.Arts & Culture KPI Dashboard in Power BI
💾 Excel-Driven System – Update data in simple Excel sheets, and the dashboard refreshes automatically.
🚀 Ready to Use – No coding or advanced Power BI skills required—everything is pre-built.

📦 What’s Inside the Arts & Culture KPI Dashboard in Power BI
When you download this product, you receive everything needed for smooth reporting and performance tracking.
📁 Power BI File (.PBIX) – A fully designed and automated Arts & Culture KPI Dashboard.
📄 3 Dashboard Pages –Arts & Culture KPI Dashboard in Power BI
-
Summary Page
-
KPI Trend Page
-
KPI Definition Page
📊 Combo Trend Charts – Monthly and yearly comparisons for each KPI.
📘 Excel Data Source File – Includes sheets for Actual Data, Target Data, and KPI Definitions.
🧾 Structured KPI Entries – KPI number, group, name, unit, type, formulas, and definitions.
🟢 Performance Icons – Green ▲ for target met and red ▼ for target missed.
🧩 Fully Customizable KPIs – Add, edit, or remove KPIs as your organization grows.
You get a complete package designed for clarity, accuracy, and professional reporting.
🛠️ How to Use the Arts & Culture KPI Dashboard in Power BI
Using this dashboard is simple—even if you are not a technical expert.
1️⃣ Enter data in Excel – Update Actuals, Targets, and KPI definitions.
2️⃣ Refresh Power BI – All visuals update instantly.
3️⃣ Filter by Month or KPI Group – Explore performance from different angles.
4️⃣ Select a KPI – View MTD/YTD trends on the Trend Page.
5️⃣ Drill Through to Definition Page – Understand the formula behind each KPI.
6️⃣ Review MTD & YTD insights – Compare performance against targets and previous years.
7️⃣ Use visuals for reporting – Export pages for board meetings, presentations, and progress reviews.
The dashboard is optimized for instant understanding and faster analysis.
👥 Who Can Benefit from This Arts & Culture KPI Dashboard in Power BI
This dashboard is perfect for:
🎨 Museums & Art Galleries – Track visitors, exhibitions, ticket sales, and engagement.
🎭 Theaters & Performing Arts Groups – Monitor show attendance, revenue, and audience satisfaction.
🏛️ Cultural Centers & Nonprofits – Measure outreach, education programs, and community impact.
🎉 Event & Festival Organizers – Analyze participation, ticketing, and sponsorship results.
📚 Educational & Cultural Institutions – Track learning programs, workshops, and regional engagement.
💼 Management & Reporting Teams – Generate quick insights for boards, funders, and stakeholders.
If you want clarity, accuracy, and real-time performance insights, this dashboard is the perfect solution.
Click here to read the Detailed blog post
Watch the step-by-step video tutorial:


Reviews
There are no reviews yet.