


In today’s world of creative innovation, arts and culture organizations need the same analytical power that big businesses use to track growth and impact. The 🎭 Arts & Culture KPI Dashboard in Excel is your all-in-one tool to visualize performance, funding impact, visitor satisfaction, and community engagement — all from a single Excel workbook.
This ready-to-use, interactive dashboard helps museums, art centers, galleries, and cultural institutions measure what truly matters — from audience engagement to financial transparency — and convert raw data into actionable insights.
✨ Key Features of the Arts & Culture KPI Dashboard in Excel
-
📊 Interactive Dashboard Interface – Instantly view Month-to-Date (MTD) and Year-to-Date (YTD) performance with color-coded visuals and up/down arrows.
-
🎯 Dynamic Filters – Select months, KPI groups, and categories through intuitive drop-downs for quick performance analysis.
-
💡 Comprehensive KPI Coverage – Track exhibitions, visitor counts, event participation, social reach, and funding impact all in one place.
-
🔁 Real-Time Comparisons – Compare Actual vs Target and Current vs Previous Year values instantly.
-
🎨 Customizable Visuals – Modify charts, color schemes, or KPIs as per your organization’s goals.
-
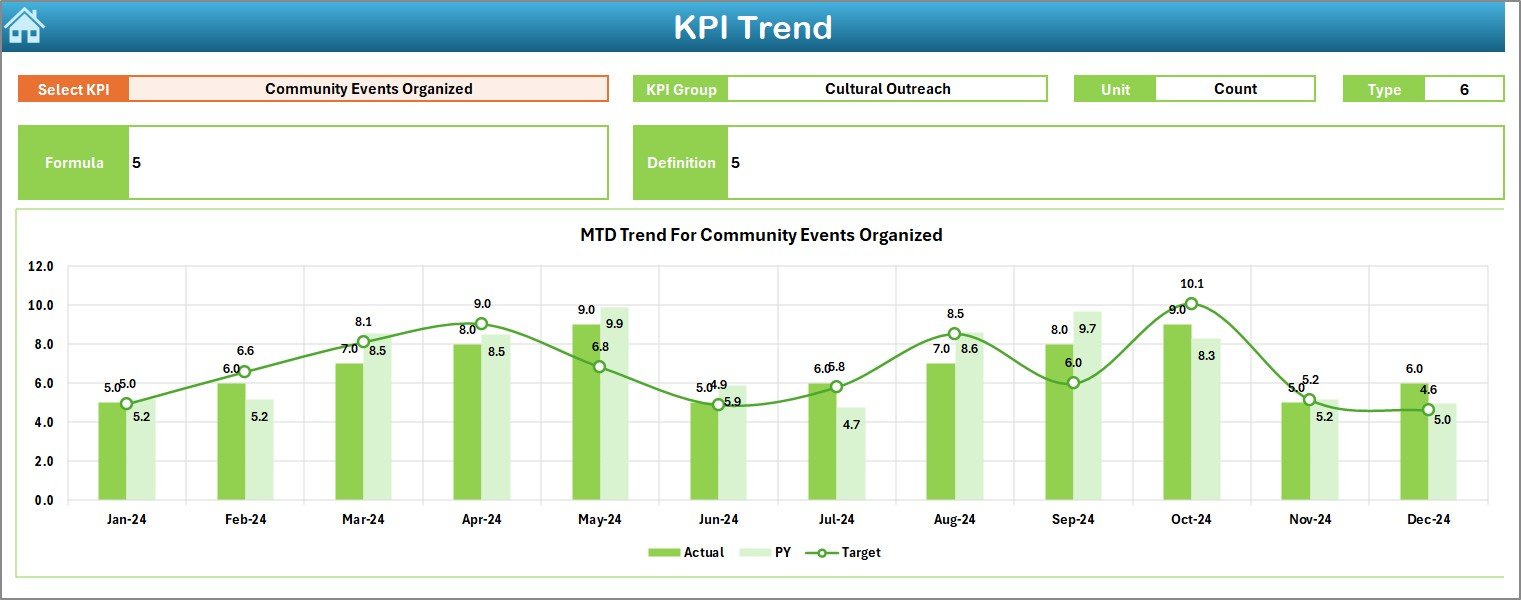
📈 Trend Monitoring – Evaluate KPI progress with dynamic charts and performance patterns.
-
🔐 User-Friendly Design – No coding or BI software needed — everything runs smoothly within Excel.
-
🧾 KPI Definition Transparency – Each KPI is defined with formula, type, and meaning to ensure consistent understanding.
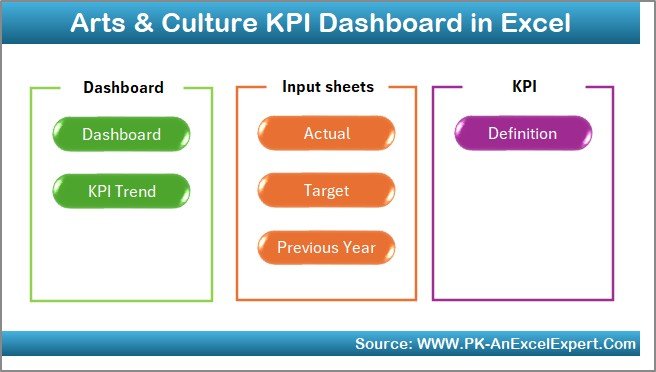
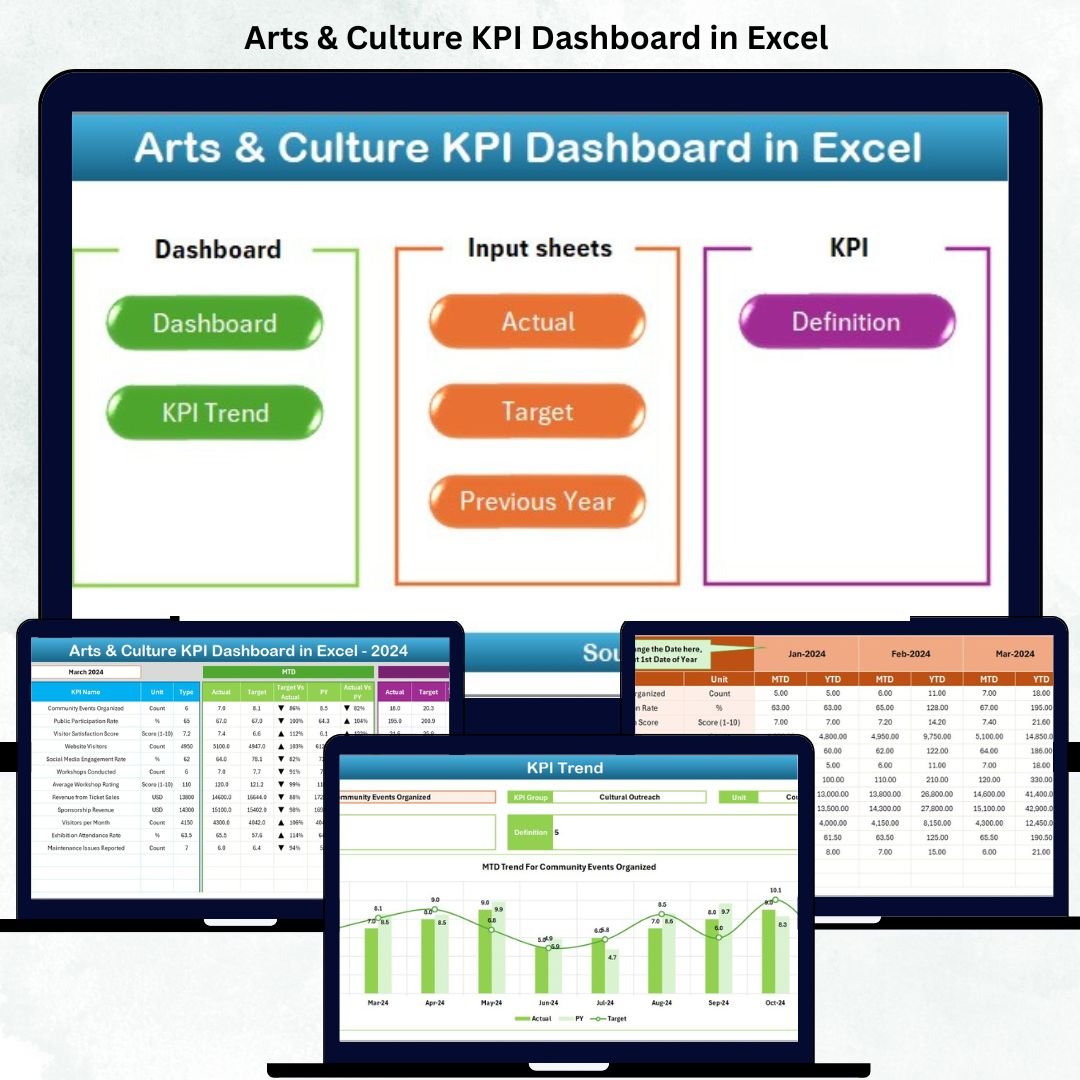
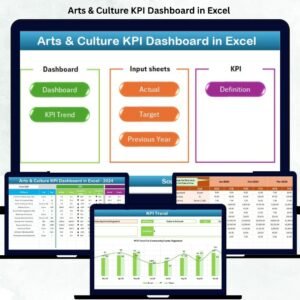
📂 What’s Inside the Arts & Culture KPI Dashboard
This dashboard includes seven pre-built Excel worksheets, each designed for a specific purpose:
1️⃣ Summary Page – The home interface with navigation buttons to access other sheets easily.
2️⃣ Dashboard Sheet Tab – The main visualization hub showing MTD/YTD Actual vs Target comparisons.
3️⃣ Trend Sheet Tab – Visualize performance trends by KPI, group, or unit through automated charts.
4️⃣ Actual Numbers Input Sheet – Enter monthly data for MTD and YTD metrics effortlessly.
5️⃣ Target Sheet Tab – Define performance targets for each KPI and instantly compare gaps.
6️⃣ Previous Year Numbers Sheet – Track year-over-year progress and growth trends.
7️⃣ KPI Definition Sheet – Maintain clarity by defining KPIs, formulas, and performance direction (UTB/LTB).
This structured setup makes it simple to manage performance for exhibitions, festivals, cultural events, and funding activities.
🧭 How to Use the Arts & Culture KPI Dashboard
Using this Excel template is simple and intuitive:
1️⃣ Enter the Actual performance data in the “Actual Numbers Input Sheet.”
2️⃣ Add your monthly or yearly targets in the “Target Sheet Tab.”
3️⃣ Provide previous year values to analyze year-on-year performance.
4️⃣ Use the Dashboard and Trend sheets to instantly visualize data through charts and KPIs.
5️⃣ Customize KPI definitions, units, or visuals anytime — no advanced Excel skills required!
Within minutes, you’ll have a complete view of your organization’s performance, helping you make smarter and faster decisions.
👥 Who Can Benefit from This Dashboard
The Arts & Culture KPI Dashboard in Excel is ideal for:
🎭 Museums & Art Galleries – Track exhibitions, ticket sales, and visitor engagement metrics.
🎤 Performing Arts Institutions – Measure event success and audience participation.
🏛️ Cultural Foundations & NGOs – Monitor funding utilization and project performance.
📚 Heritage & Educational Institutions – Evaluate community outreach and cultural education initiatives.
🎨 Event Planners & Organizers – Analyze event attendance, satisfaction, and promotional impact.
📊 Government & Policy Bodies – Review cultural program outcomes and grant impact.
With this dashboard, every creative organization can transform numbers into stories — stories that reflect growth, creativity, and community impact.


Reviews
There are no reviews yet.