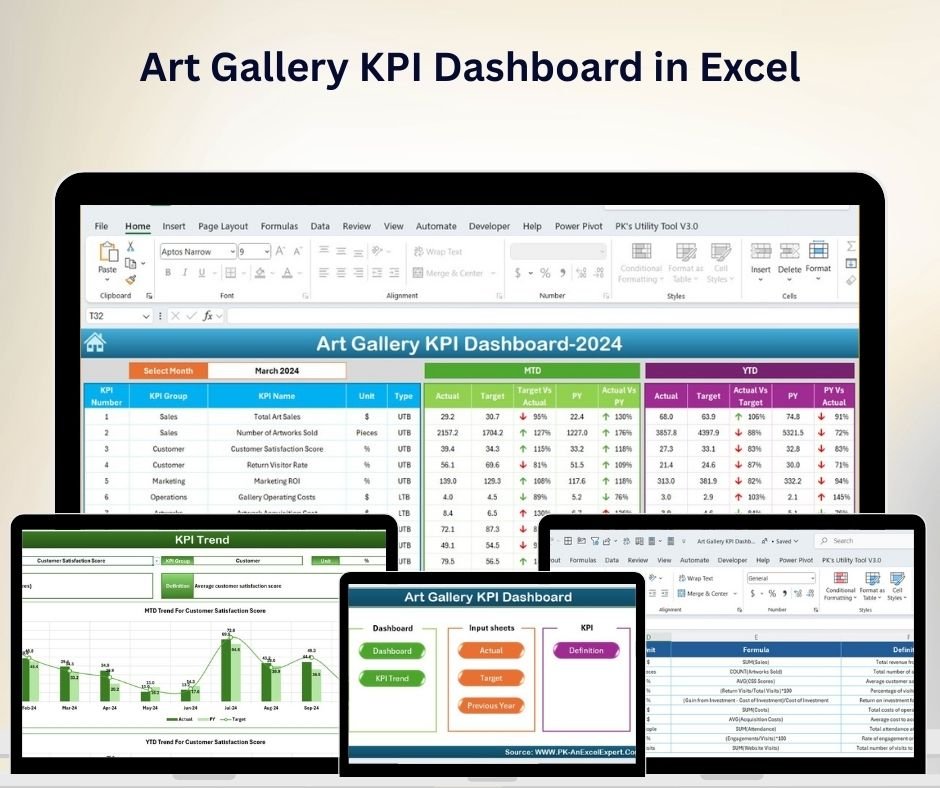


The Art Gallery KPI Dashboard in Excel is an essential tool for art gallery managers, curators, and owners to track and analyze key performance indicators (KPIs) related to gallery operations. This Excel-based dashboard provides insights into visitor engagement, sales, inventory, and exhibition performance, making it easier to manage your gallery and optimize performance.
By tracking crucial metrics such as art sales, foot traffic, exhibition success, and customer satisfaction, this dashboard enables you to make data-driven decisions that enhance the gallery’s growth and profitability. Whether you’re running a small independent gallery or a large institution, this customizable dashboard helps you stay on top of your art business.

Key Features of the Art Gallery KPI Dashboard in Excel
📊 Sales Tracking & Revenue Analysis
Track the sales of artworks, including revenue generated from different categories such as paintings, sculptures, and prints. Monitor sales trends, average sale price, and artist performance.
📈 Visitor Engagement & Foot Traffic
Measure gallery foot traffic, including daily, weekly, and monthly visitor counts. Track which exhibitions attract the most visitors and use this data to plan future shows.
💡 Exhibition Performance Monitoring
Evaluate the success of individual exhibitions based on visitor numbers, sales, and customer feedback. Identify popular exhibitions and themes that resonate with your audience.
📉 Customer Satisfaction Metrics
Use customer feedback and surveys to measure visitor satisfaction. Track NPS (Net Promoter Score) and other satisfaction-related KPIs to ensure your customers are happy with their experience.
🔄 Artist Performance Monitoring
Monitor the performance of individual artists by tracking their artwork sales, popularity, and customer feedback. Identify top-performing artists and allocate resources effectively.
⚙️ Customizable Dashboard
Customize the dashboard to reflect your gallery’s specific needs. Add or modify KPIs, change the data layout, and adjust charts to match your business model.
Why You’ll Love the Art Gallery KPI Dashboard in Excel
✅ Comprehensive Data Tracking
Track all essential metrics, from sales and foot traffic to customer satisfaction, in one centralized location.
✅ Boost Sales & Revenue
Monitor art sales trends and analyze which pieces, artists, or exhibitions generate the most revenue. Use this data to optimize pricing and marketing strategies.
✅ Enhance Visitor Experience
Understand visitor preferences and improve exhibition planning by tracking foot traffic and engagement metrics.
✅ Optimize Gallery Operations
Gain insights into exhibition performance and artist success to streamline future gallery operations and events.
✅ Customizable & Scalable
This dashboard is flexible, allowing you to tailor the data and KPIs to suit your gallery’s unique needs, whether you run a small independent gallery or a large gallery network.
What’s Inside the Art Gallery KPI Dashboard in Excel?
-
Sales Tracking & Revenue Analysis: Monitor sales by artwork type, artist, and exhibition.
-
Visitor Engagement: Track foot traffic and engagement for different exhibitions.
-
Exhibition Performance Monitoring: Evaluate individual exhibition success and performance.
-
Customer Satisfaction Metrics: Measure visitor satisfaction and identify areas for improvement.
-
Artist Performance Tracking: Track the sales and popularity of individual artists.
-
Customizable Features: Tailor the dashboard to fit your gallery’s specific needs.
How to Use the Art Gallery KPI Dashboard in Excel
1️⃣ Download the Template: Access the Art Gallery KPI Dashboard in Excel instantly.
2️⃣ Input Sales Data: Track artwork sales, revenue, and other financial data.
3️⃣ Monitor Visitor Traffic: Record foot traffic and visitor data for each exhibition.
4️⃣ Evaluate Exhibition Performance: Track the success of exhibitions through visitor counts and sales.
5️⃣ Optimize Your Gallery Operations: Use insights from the dashboard to optimize exhibitions, marketing, and sales strategies.
Who Can Benefit from the Art Gallery KPI Dashboard in Excel?
🔹 Art Gallery Managers & Curators
🔹 Art Dealers & Sellers
🔹 Exhibition Organizers
🔹 Gallery Owners & Business Managers
🔹 Marketing & Sales Teams
🔹 Artists & Art Collectives
🔹 Nonprofit Organizations Operating Art Galleries
Make smarter, data-driven decisions to enhance your gallery’s performance with the Art Gallery KPI Dashboard in Excel. Track sales, monitor exhibition success, and optimize operations for a thriving art business.
Click here to read the Detailed blog post
Visit our YouTube channel to learn step-by-step video tutorials
Youtube.com/@PKAnExcelExpert


Reviews
There are no reviews yet.