The AR-VR industry doesn’t wait. Innovation moves fast. Investors expect growth. Customers demand immersive experiences. Teams must deliver results consistently.
Yet many AR-VR companies still rely on disconnected spreadsheets and manual reporting. That leads to confusion, delays, and missed targets.
What if you could track everything in one powerful, structured, and easy-to-use system?
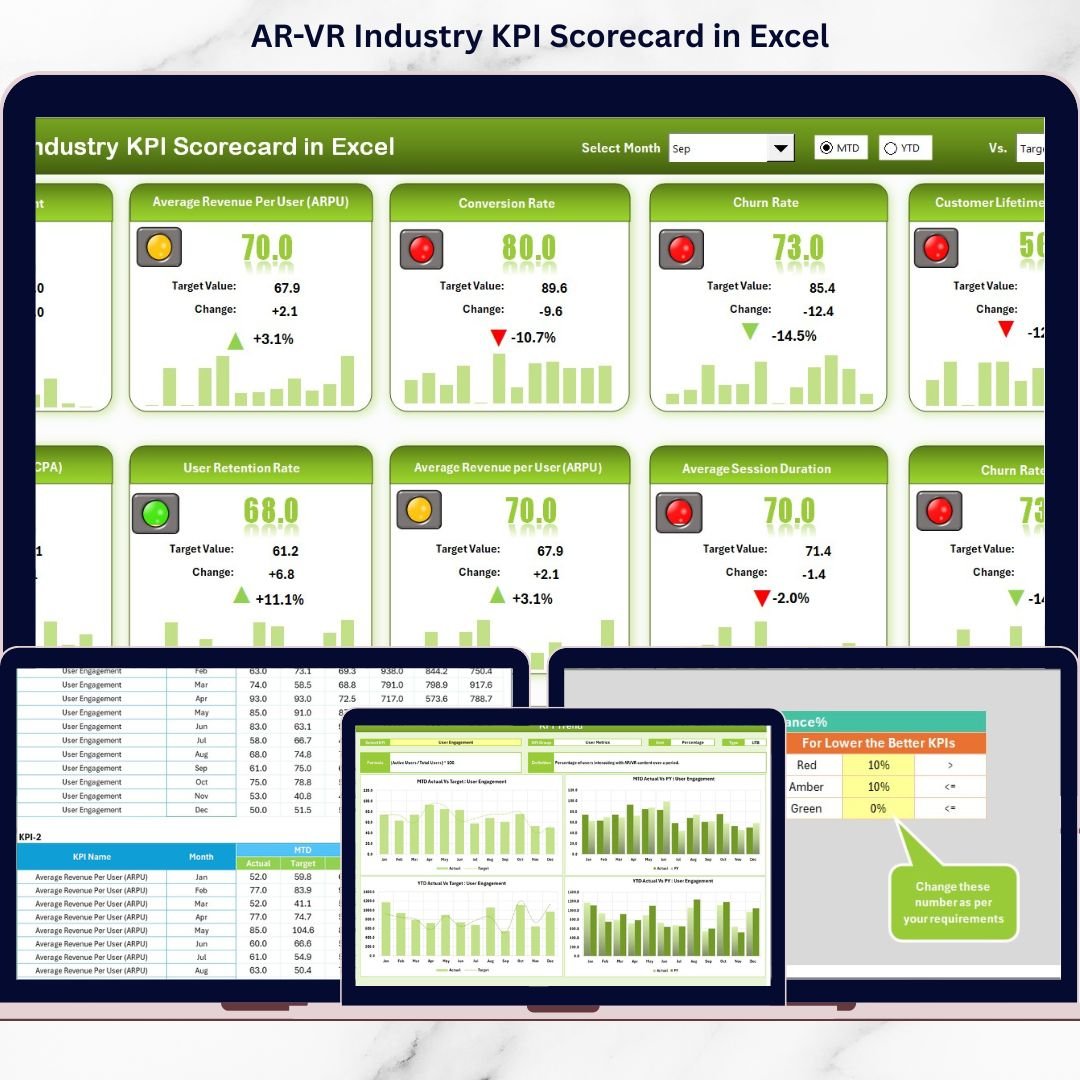
Introducing the AR-VR Industry KPI Scorecard in Excel — a ready-to-use performance tracking template designed specifically for immersive technology businesses.
This professionally designed Excel scorecard allows you to monitor MTD and YTD performance, compare actual vs target values, visualize trends, and make smarter decisions — all in one place.
No complex software. No expensive BI tools. Just clarity and control.
🚀 Key Features of AR-VR Industry KPI Scorecard in Excel
📊 MTD & YTD Performance Tracking
Switch between Month-to-Date and Year-to-Date views instantly using dropdown menus.
🎯 Actual vs Target Comparison
Identify performance gaps quickly with side-by-side comparisons.
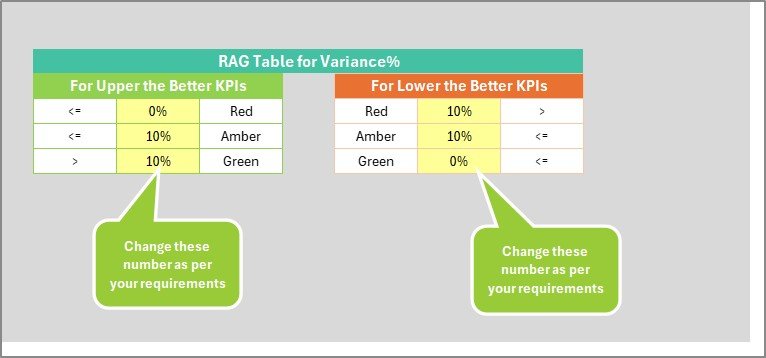
🟢 Smart Visual Indicators
Conditional formatting with green, yellow, and red signals makes performance easy to understand.
📈 Dynamic Trend Analysis
Analyze growth patterns with MTD, YTD, and Previous Year comparisons.
📂 4 Structured Worksheets
Scorecard Sheet, KPI Trend Sheet, Input Data Sheet, and KPI Definition Sheet.
🔄 Automatic Calculations
Update data in the input sheet and watch the dashboard update instantly.
🛠 Fully Customizable
Add new KPIs, modify formulas, and adapt the layout to your business model.
💰 Cost-Effective & Practical
Built entirely in Excel — no additional tools required.

📦 What’s Inside the AR-VR Industry KPI Scorecard in Excel
This ready-to-use template includes four powerful worksheets:
1️⃣ Scorecard Sheet – Main Performance Dashboard
View 10 KPIs in one centralized dashboard.
Track:
-
KPI Name
-
KPI Group
-
Unit
-
Type (Lower the Better / Upper the Better)
-
Actual MTD & Target MTD
-
Actual YTD & Target YTD
Visual indicators highlight performance instantly.
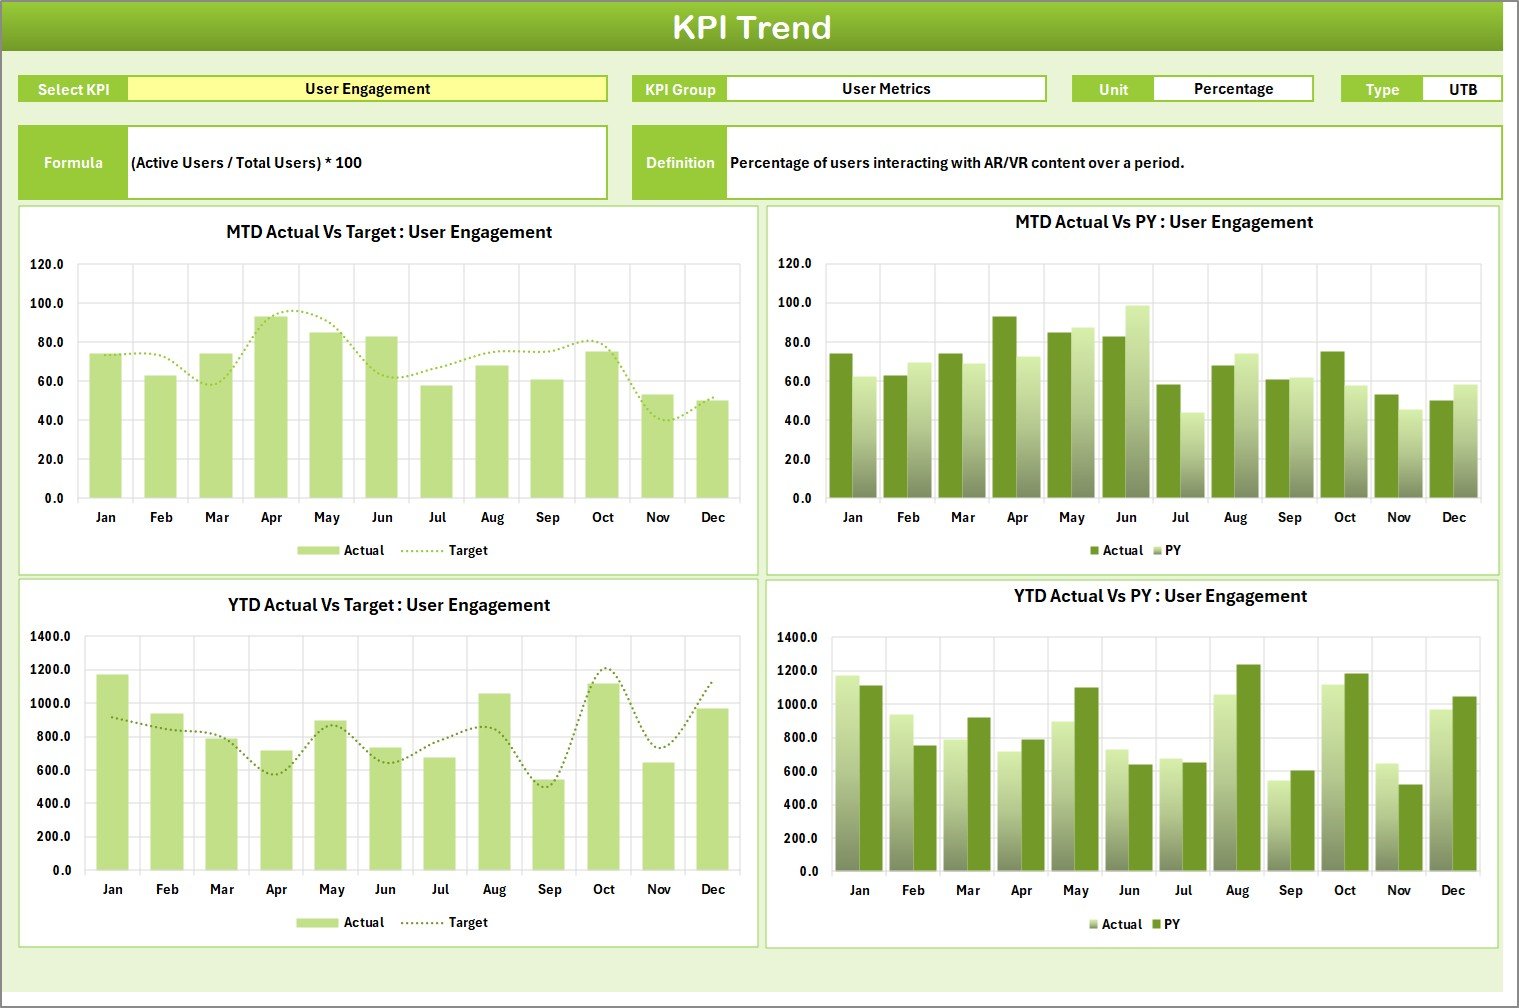
2️⃣ KPI Trend Sheet – Deep Analysis
Select any KPI from the dropdown (Cell C3) and analyze:
-
MTD trend chart
-
YTD trend chart
-
Actual vs Target comparison
-
Previous Year comparison
-
KPI formula and definition
Perfect for strategic performance reviews.
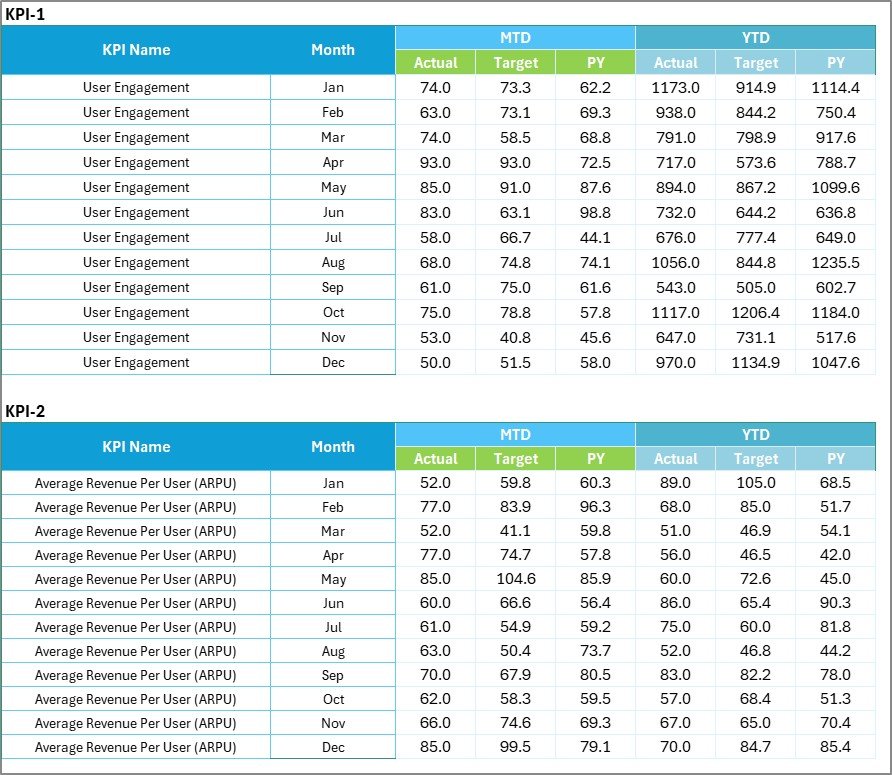
3️⃣ Input Data Sheet – Easy Data Entry
Enter monthly actual and target values.
All calculations update automatically across the dashboard.
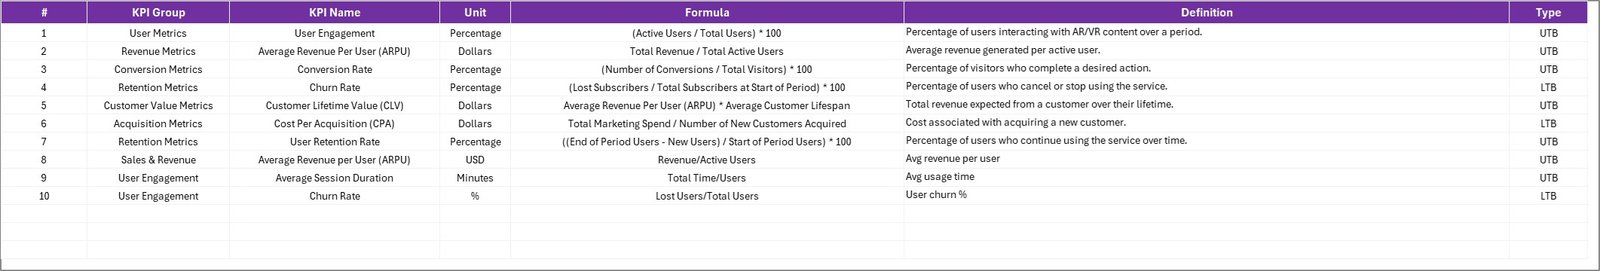
4️⃣ KPI Definition Sheet – Documentation Hub
Store KPI Name, Group, Unit, Formula, and Definition.
Ensures clarity across teams and prevents misinterpretation.
⚙️ How to Use the AR-VR Industry KPI Scorecard in Excel
Using the template is simple:
Step 1: Enter your monthly actual and target values in the Input Data Sheet.
Step 2: Define or customize KPIs in the KPI Definition Sheet.
Step 3: Use dropdowns to switch between MTD and YTD views.
Step 4: Review color indicators and trend charts.
Step 5: Conduct monthly performance meetings using the scorecard.
Within minutes, your team gains full visibility of revenue, user engagement, product performance, and operational efficiency.
👥 Who Can Benefit from This AR-VR Industry KPI Scorecard?
✅ AR-VR Startups seeking investor-ready reporting
✅ Product Managers tracking feature releases and bug resolution
✅ CEOs and Founders needing performance clarity
✅ Operations Teams monitoring efficiency metrics
✅ Marketing Teams tracking CAC and ROI
✅ Investor Relations Teams preparing structured reports
Whether you are a startup proving product-market fit or a growing immersive tech company scaling operations, this scorecard keeps your performance aligned with strategy.
Instead of guessing performance, you measure it clearly.
Instead of reacting late, you act proactively.
Instead of scattered sheets, you operate with structure.
If your AR-VR business wants accountability, visibility, and growth — this KPI Scorecard is your competitive advantage.
Click here to read the Detailed blog post
Watch the step-by-step video tutorial:


