Running a successful aquatic pet store requires more than just great products—it demands smart data management. Aquatic Pet Stores Dashboard in Power BI From tracking sales and inventory to monitoring customer satisfaction and return rates, managing everything manually can quickly become overwhelming.
Many store owners still rely on disconnected spreadsheets and reports. As a result, they miss valuable insights, struggle to identify trends, and often make delayed decisions.
But what if you could manage everything in one powerful dashboard? 🤔
Aquatic Pet Stores Dashboard in Power BI That’s exactly where the Aquatic Pet Stores Dashboard in Power BI becomes a game-changing solution! 🚀
Aquatic Pet Stores Dashboard in Power BI This ready-to-use and interactive dashboard allows you to track sales performance, analyze product trends, monitor customer behavior, and evaluate store performance—all in one centralized platform. Instead of dealing with complex data, you get visually rich and easy-to-understand insights that help you make faster and smarter business decisions.
With real-time updates and dynamic visuals, this dashboard empowers you to stay ahead of the competition. Whether you manage a single store or multiple locations, you gain complete control over your retail operations and profitability. ⚡
📊 Key Features of Aquatic Pet Stores Dashboard in Power BI
✨ All-in-One Retail Dashboard – Manage sales, products, and customer insights in one place.
🛒 Sales Performance Tracking – Monitor total transactions, revenue, and quantity sold.
💰 Cost & Profit Analysis – Track cost of goods and improve profitability.
📦 Product Performance Insights – Identify best-selling and low-performing products.
🏬 Store-Level Analysis – Compare performance across different store locations.
👥 Customer Behavior Insights – Understand customer types, preferences, and satisfaction.
🔁 Return Rate Tracking – Monitor product returns and reduce losses.
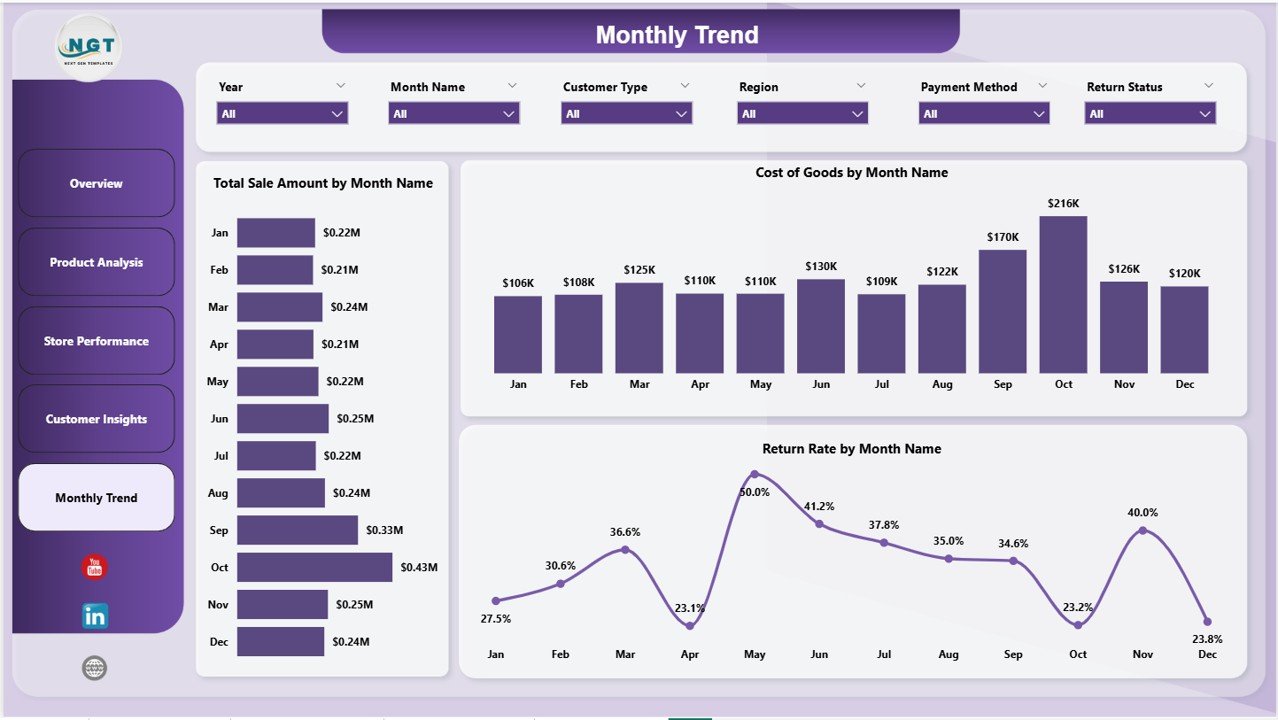
📅 Monthly Trends Analysis – Identify seasonal patterns and growth opportunities.
⚡ Real-Time Data Updates – Make faster decisions with dynamic dashboards.
🎛️ Interactive Filters & Drill-Downs – Explore data with ease and precision.
📂 What’s Inside the Aquatic Pet Stores Dashboard in Power BI
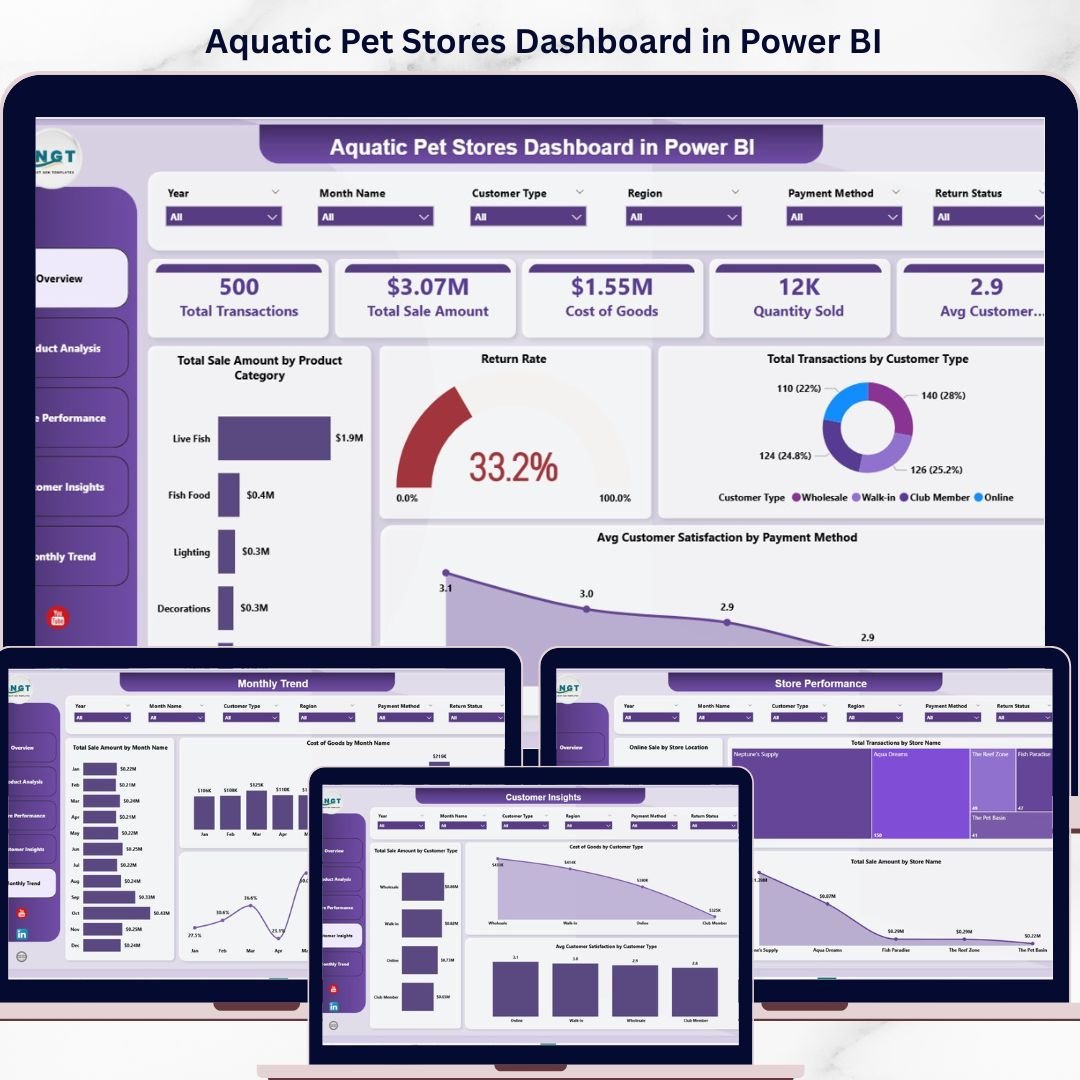
This dashboard includes 5 powerful and interactive pages for complete retail analysis:
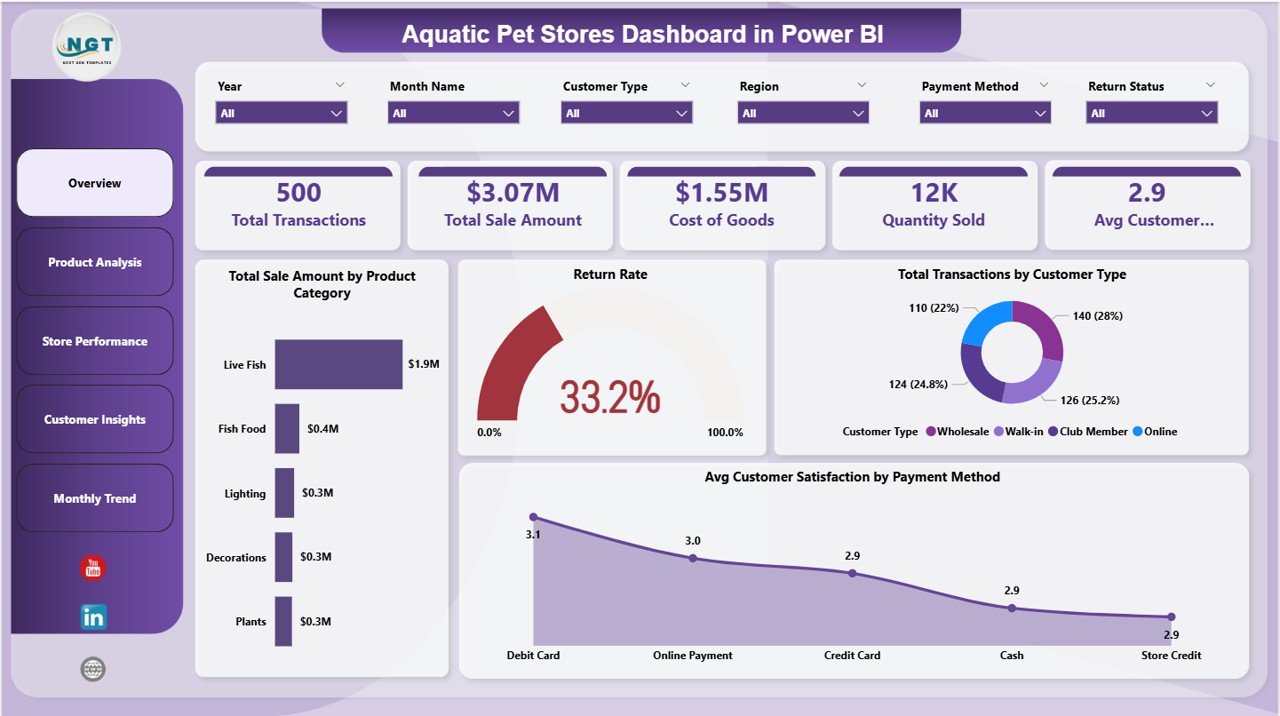
📊 Overview Page – Get a quick snapshot of KPIs and overall store performance.
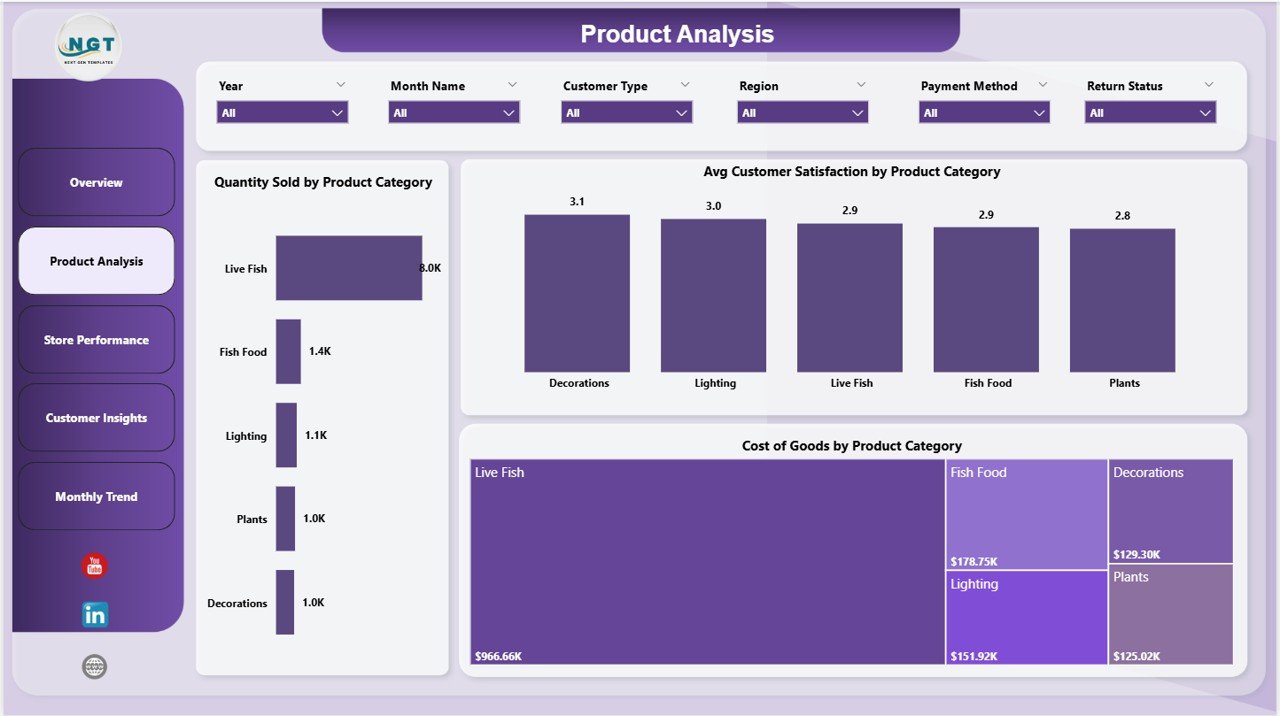
📦 Product Analysis – Analyze product categories, sales volume, and customer satisfaction.
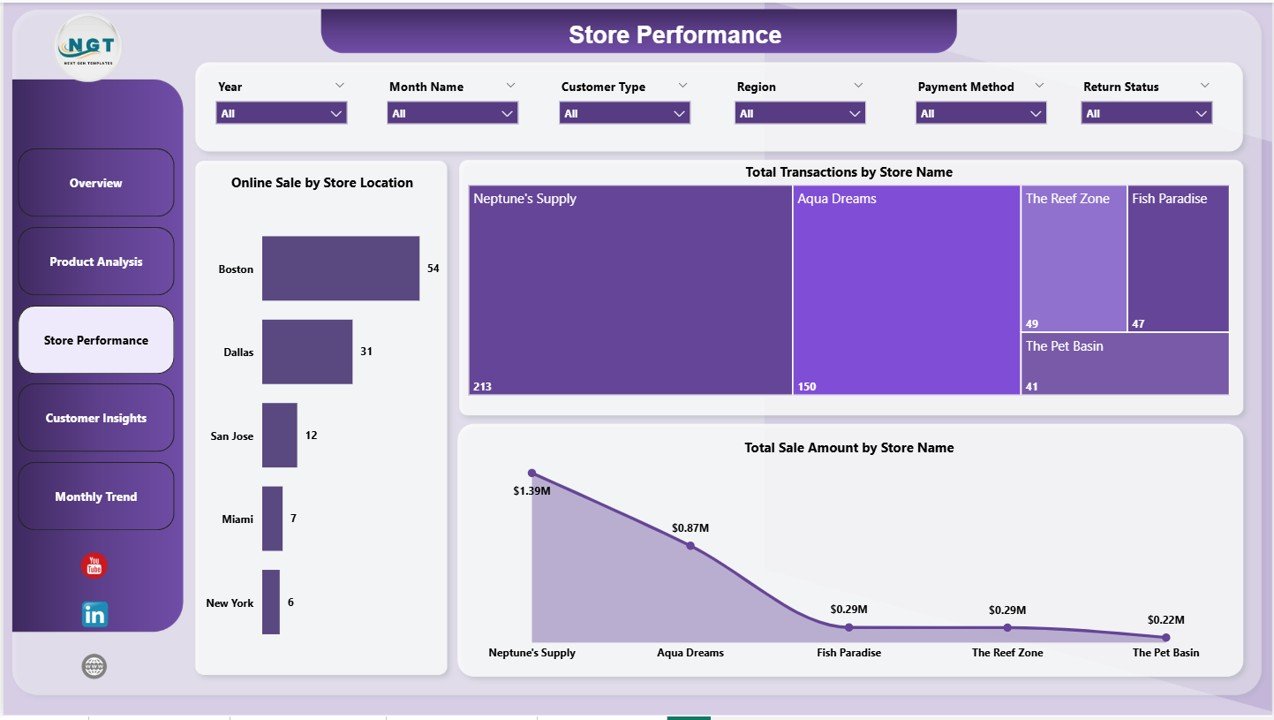
🏬 Store Performance – Compare store-level sales, transactions, and online performance.
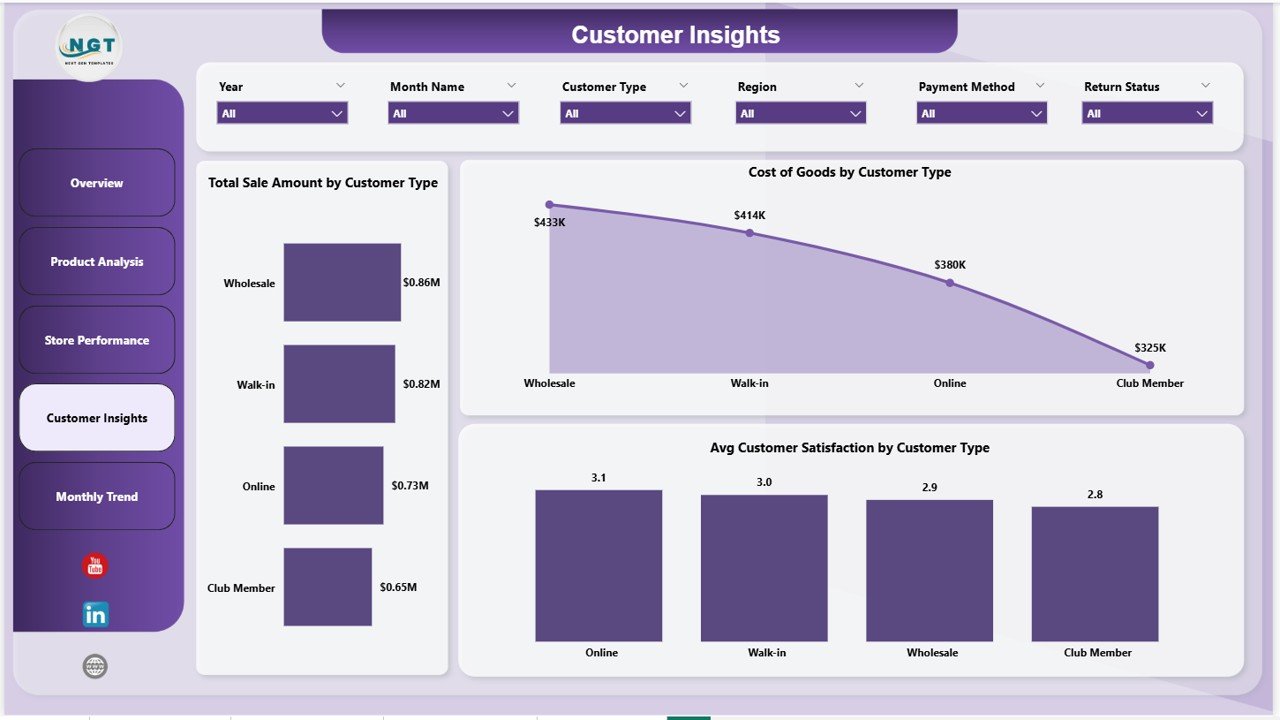
👥 Customer Insights – Understand buying behavior and improve customer retention.
📅 Monthly Trends – Track performance trends, sales growth, and return rates over time.
Each page is designed to deliver clear, actionable insights to optimize your business. 🔍
⚙️ How to Use the Aquatic Pet Stores Dashboard in Power BI
Using this dashboard is simple and effective:
📥 Load Your Data – Import sales, product, and customer data into Power BI.
🔗 Connect Data Sources – Link datasets with the dashboard.
🎛️ Use Filters (Slicers) – Analyze data by store, product category, or customer type.
📊 Monitor KPI Cards – Track key metrics like sales, cost, and satisfaction.
🔍 Explore Visuals – Drill down into charts for deeper insights.
📈 Track Trends – Monitor monthly performance and return patterns.
Within minutes, you can turn raw data into powerful business insights! ⚡
👥 Who Can Benefit from This Aquatic Pet Stores Dashboard in Power BI
This dashboard is ideal for:
🐠 Pet Store Owners – Track sales, profit, and business performance.
🏬 Retail Managers – Monitor store operations and improve efficiency.
📊 Business Analysts – Gain deep insights using interactive visuals.
📦 Inventory Managers – Optimize product performance and stock levels.
🌍 Franchise Operators – Compare multiple store locations effectively.
If you run or manage a pet store, this dashboard is a must-have tool! 🏆
📖 Click hare to read the Detailed blog post
🎥 Visit our YouTube channel to learn step-by-step video tutorials
👉 https://www.youtube.com/@PKAnExcelExpert


