Antique Dealers KPI Dashboard in Power BI The antique business is not just about buying and selling rare items. It is about precision, timing, inventory control, and financial discipline. Whether you deal in estate collections, auction treasures, vintage furniture, or rare collectibles, you must monitor performance consistently.
If you still rely on static spreadsheets, you cannot clearly track revenue trends, inventory turnover, auction success rates, and profit margins in one professional view.
That is exactly why you need the Antique Dealers KPI Dashboard in Power BI.
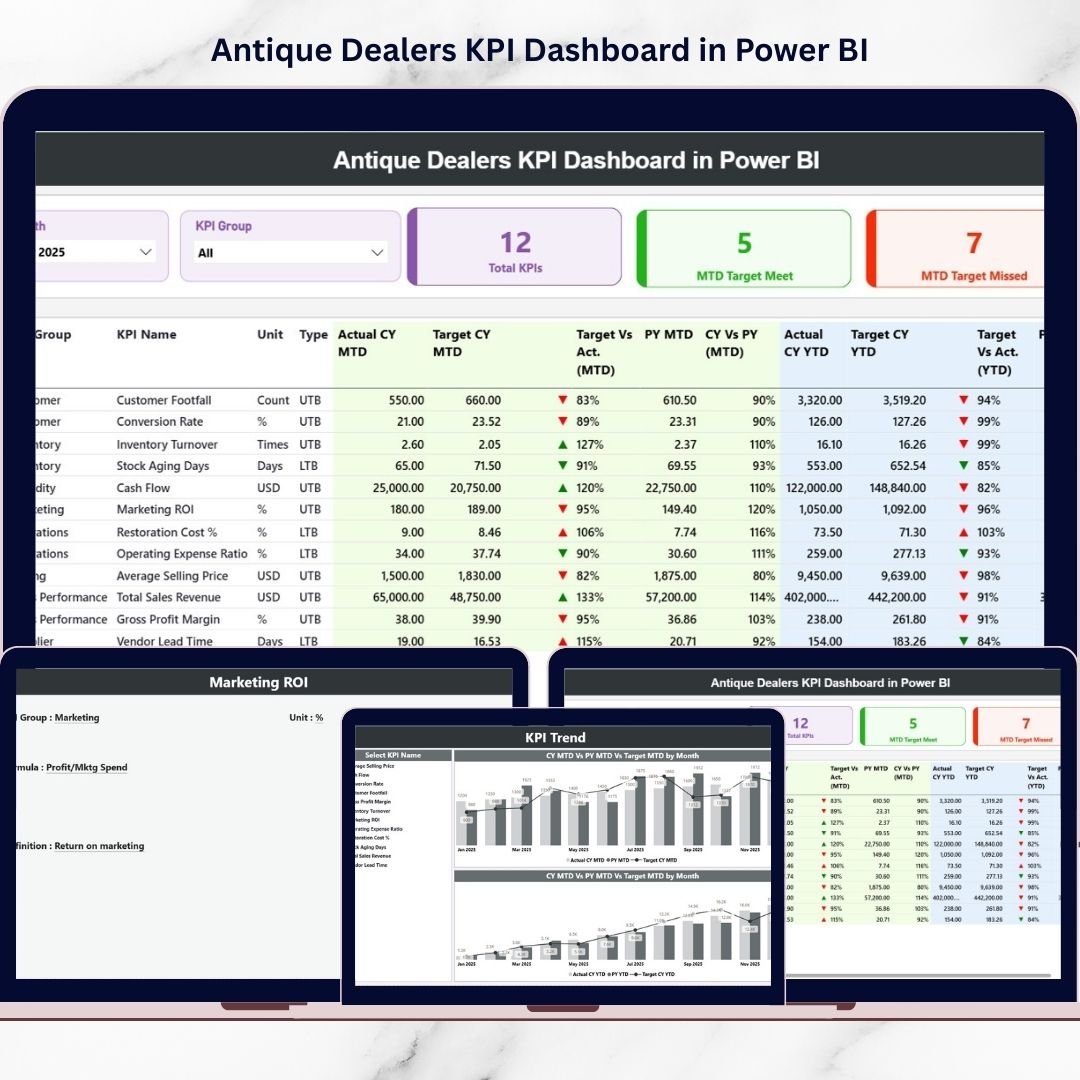
Antique Dealers KPI Dashboard in Power BI This ready-to-use, professionally designed Power BI dashboard transforms your Excel data into interactive and dynamic reports. Instead of manually reviewing multiple sheets, you can filter data by month, analyze KPI groups, compare actual vs target, and evaluate year-over-year growth instantly.
It is powerful.
It is interactive.
And it is built for serious antique professionals.
🚀 Key Feature of Antique Dealers KPI Dashboard in Power BI
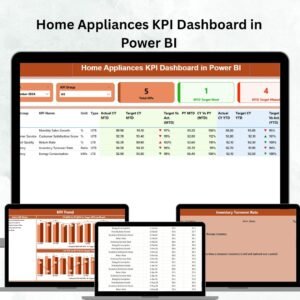
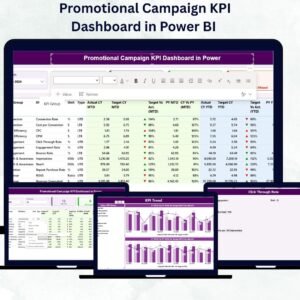
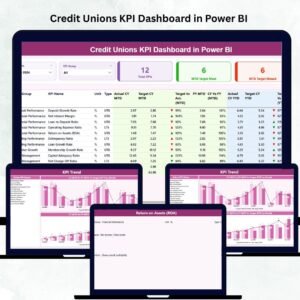
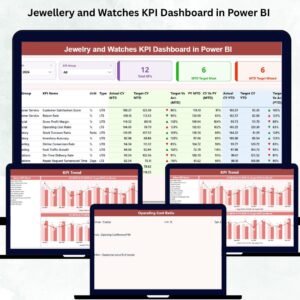
📊 Interactive Summary Page
Use Month and KPI Group slicers to filter performance instantly.
🎯 Target vs Actual Monitoring
Track MTD and YTD performance with automatic percentage calculations.
📈 Year-over-Year Comparison
Compare Current Year vs Previous Year results clearly.
🔢 Smart KPI Cards
Quickly view:
-
Total KPIs Count
-
MTD Target Meet Count
-
MTD Target Missed Count
📉 Visual Performance Indicators
Green ▲ and Red ▼ icons show KPI status instantly.
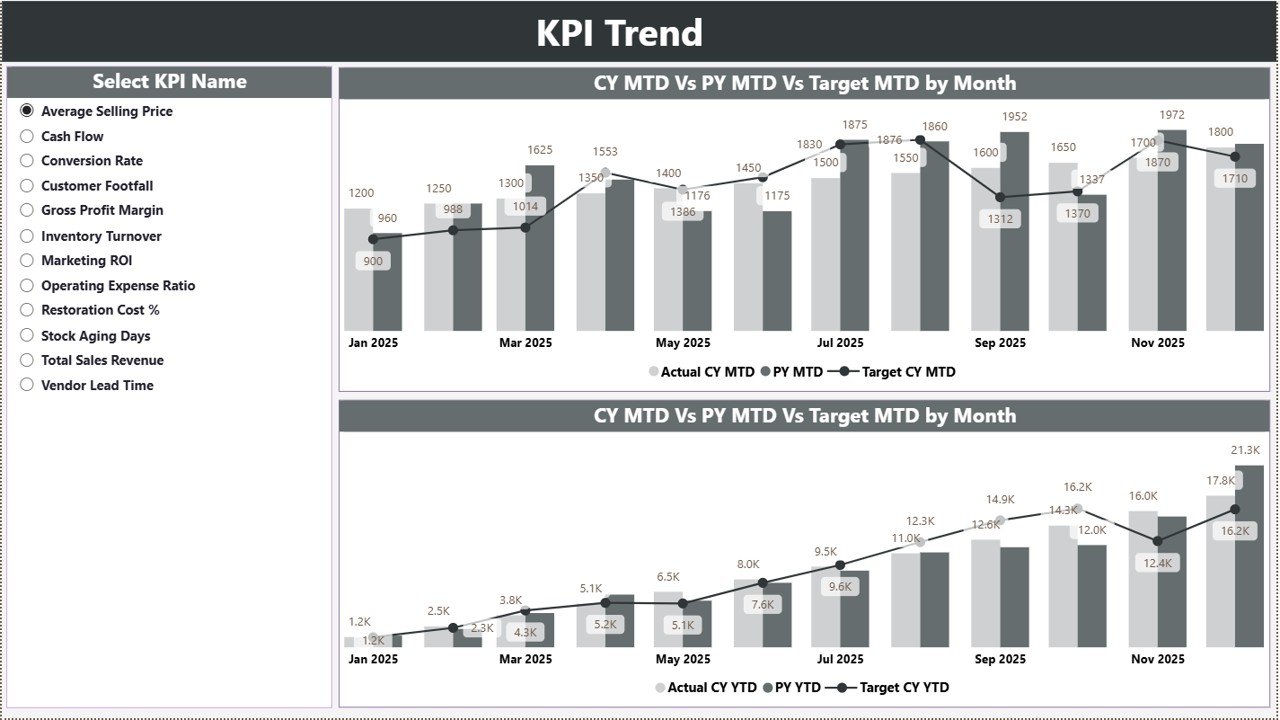
📊 Dynamic Trend Charts
Combo charts display Actual, Target, and Previous Year comparisons visually.
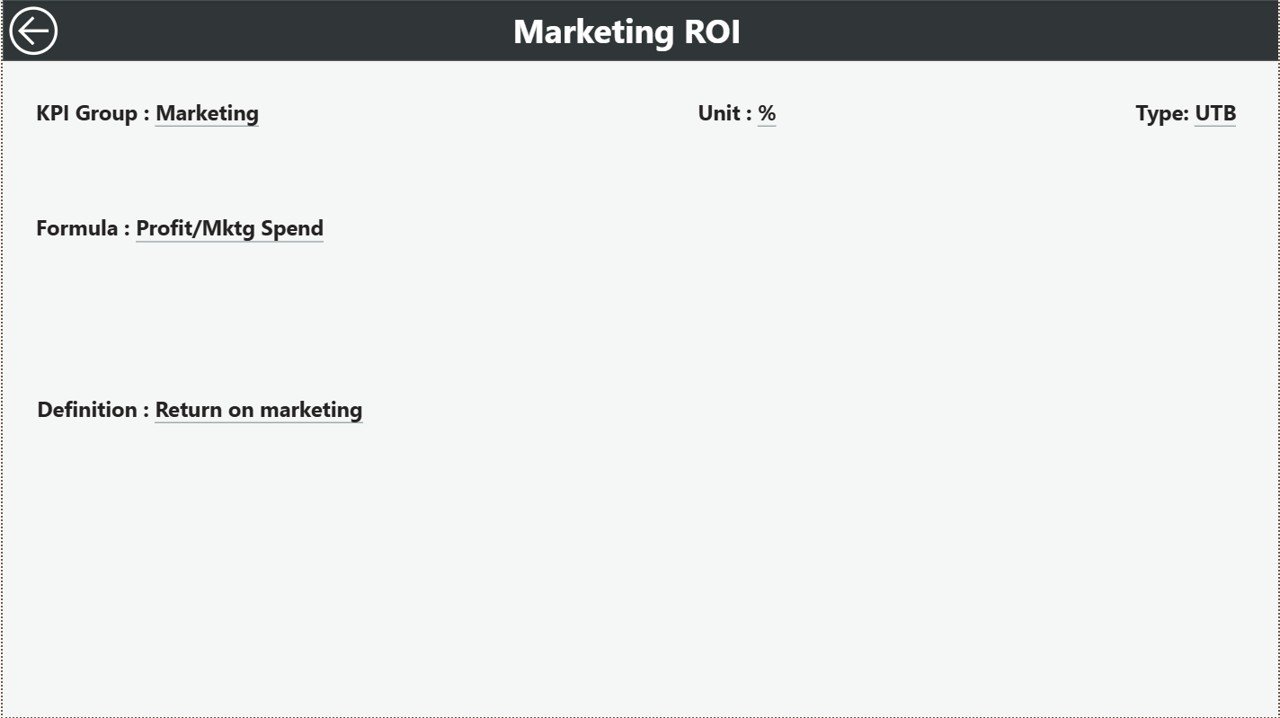
🔍 Drill-Through KPI Definitions
Click any KPI to view its formula, definition, and type (LTB/UTB).
📦 What’s Inside the Antique Dealers KPI Dashboard in Power BI
This dashboard includes 3 structured and professional report pages:
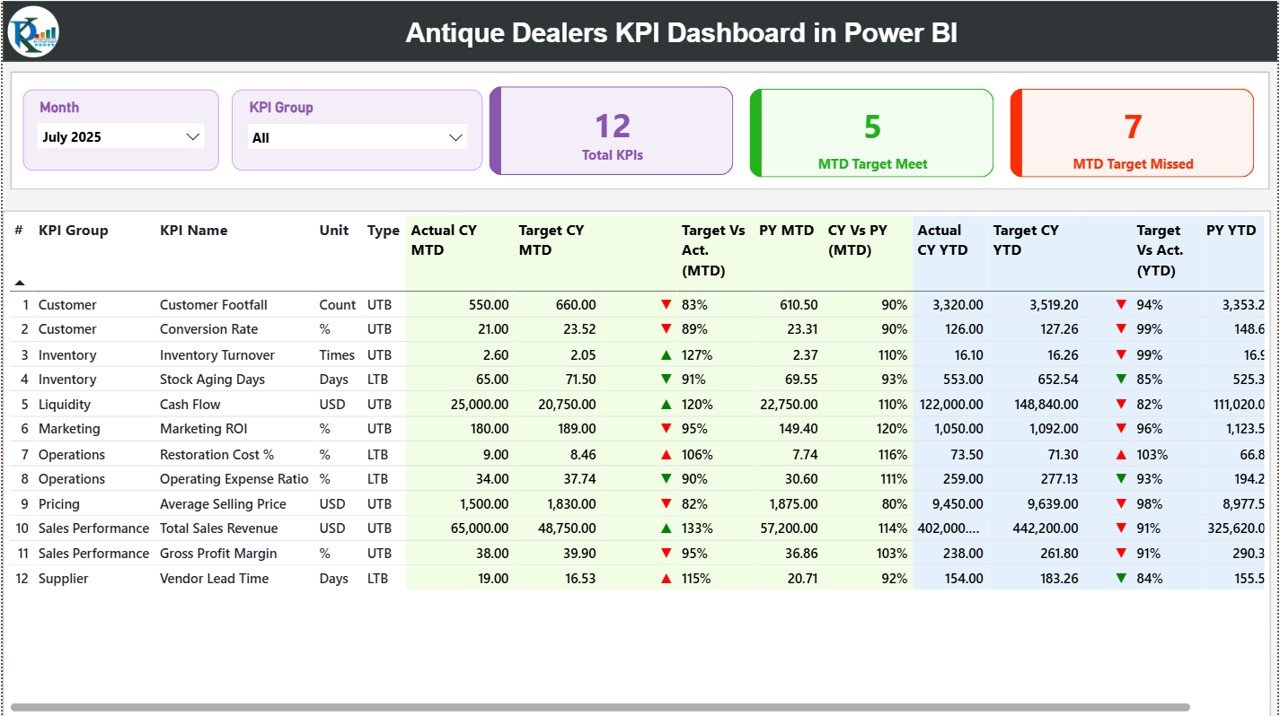
✔️ Summary Page – Central KPI overview with slicers, KPI cards, and detailed KPI table.
✔️ KPI Trend Page – Interactive combo charts for MTD and YTD performance analysis.
✔️ KPI Definition Page – Drill-through page showing KPI number, group, unit, formula, and explanation.
The dashboard connects to a structured Excel data source with:
• Input Actual Sheet
• Input Target Sheet
• KPI Definition Sheet
Once you refresh the report, all visuals update automatically.
No manual calculations required.
🛠️ How to Use the Antique Dealers KPI Dashboard in Power BI
Using this dashboard is simple and systematic:
1️⃣ Enter monthly MTD and YTD data in the Input Actual sheet.
2️⃣ Define targets in the Input Target sheet.
3️⃣ Maintain KPI definitions in the KPI Definition sheet.
4️⃣ Refresh the Power BI file.
5️⃣ Use slicers to analyze data by month or KPI group.
The dashboard automatically calculates:
✔ Target vs Actual %
✔ Current Year vs Previous Year %
✔ KPI performance indicators
✔ Trend comparisons
You do not need advanced Power BI expertise. Basic refresh and filter knowledge is enough.
🏛️ Who Can Benefit from This Antique Dealers KPI Dashboard in Power BI
This dashboard is ideal for:
🏺 Antique Dealers
🏷️ Auction Houses
🛍️ Vintage Store Owners
📦 Estate Sale Managers
💎 Collectible Traders
🏬 Multi-Location Antique Businesses
If you want structured analytics, professional reporting, and stronger financial control, this dashboard is designed for you.
Instead of guessing performance, you can now:
✔ Monitor revenue growth
✔ Track inventory turnover
✔ Analyze auction conversion rates
✔ Evaluate gross and net profit margins
✔ Identify slow-moving stock
✔ Improve cash flow planning
This is not just a Power BI file.
It is your business intelligence command center.
⭐ Why This Dashboard Will Transform Your Antique Business
• Real-time interactive filtering
• Clear target achievement visibility
• Structured KPI tracking
• Professional visual reporting
• Drill-through transparency
• Better strategic planning
The antique industry demands financial clarity and smart decisions.
This dashboard gives you both.
If you want to improve pricing strategies, optimize purchasing decisions, reduce dead inventory, and increase profitability, this Antique Dealers KPI Dashboard in Power BI will change how you manage your business.
Stop relying on spreadsheets.
Start analyzing visually.
Start growing confidently. 🏺📊