
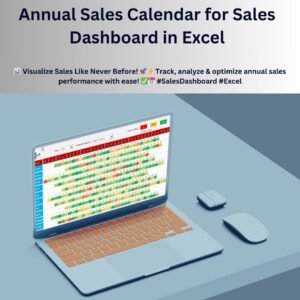
Managing and analyzing sales data effectively is crucial for any business. The Annual Sales Calendar for Sales Dashboard in Excel offers an intuitive and dynamic way to track and visualize sales performance across the year. This powerful tool provides clear insights into individual employee performance, sales trends, and revenue distribution, all in a single, well-structured dashboard.
Key Features of the Annual Sales Calendar for Sales Dashboard
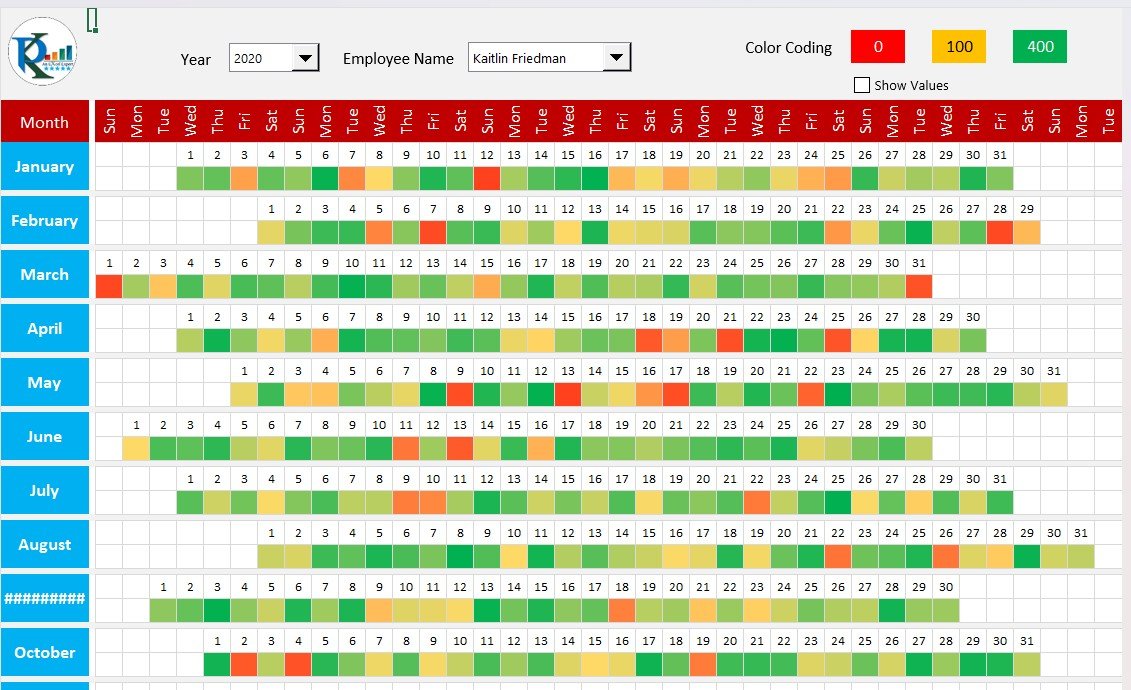
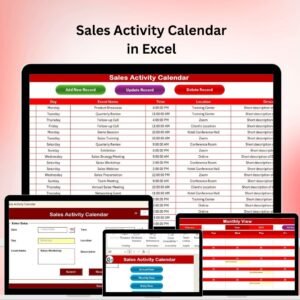
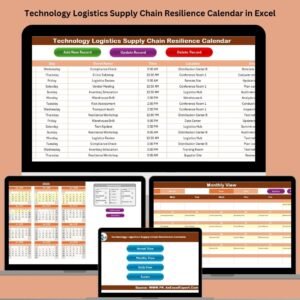
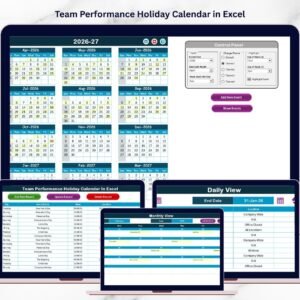
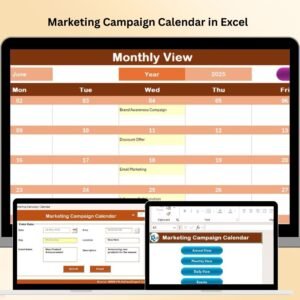
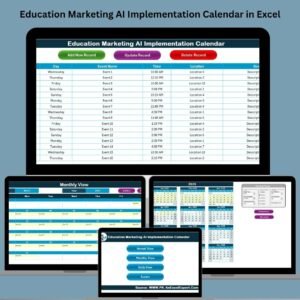
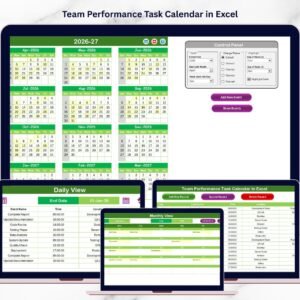
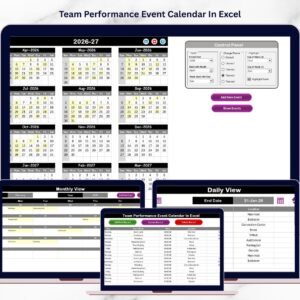
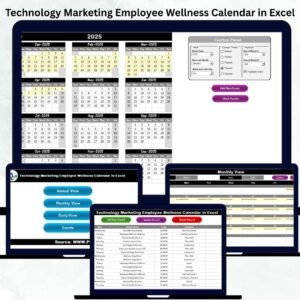
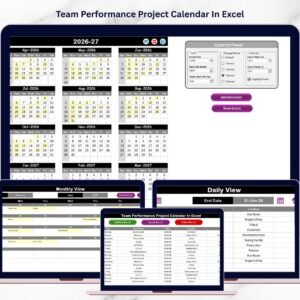
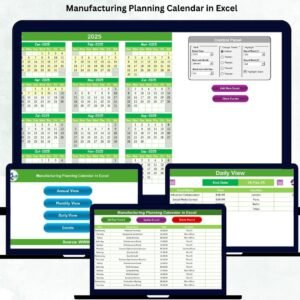
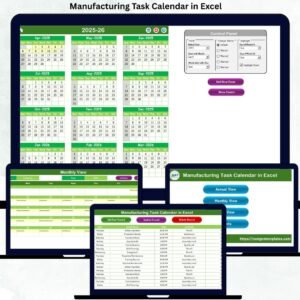
✔ Interactive Sales Calendar
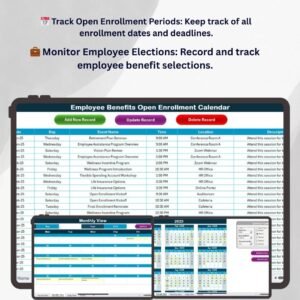
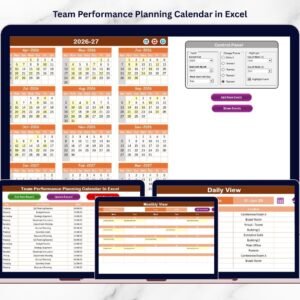
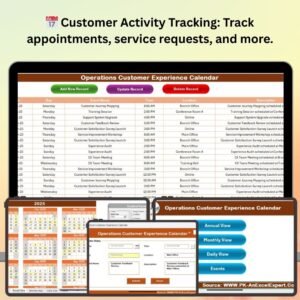
The calendar view displays sales data for the selected year and employee, enriched with conditional formatting to highlight performance levels. Each day is color-coded based on sales performance, making it easy to spot trends, high-performing periods, and areas that need attention.
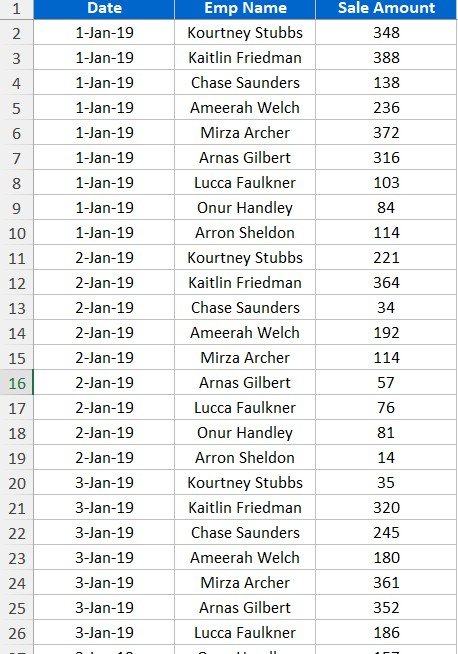
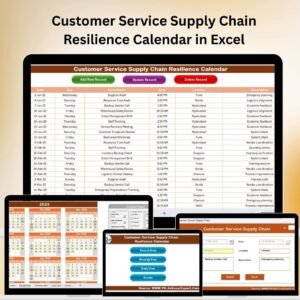
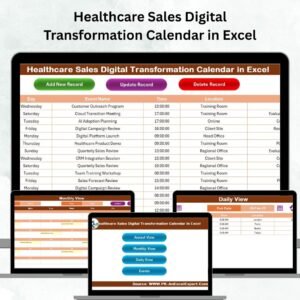
✔ Data-Driven Design
The dashboard integrates a comprehensive Data Sheet, organizing dates, employee names, and sales figures in an easy-to-use format. This structured approach ensures accuracy, clarity, and efficiency in sales tracking.
✔ Supportive Information Sheet
A Support Sheet includes unique lists of employees, years, and other crucial details. This helps maintain data consistency, making the dashboard highly customizable while ensuring seamless navigation.
✔ Yearly and Employee-Level Analysis
Users can filter sales data by year and by employee, enabling them to analyze performance at both macro and micro levels. This helps sales managers track overall team performance and identify top performers or areas needing improvement.
✔ Automated Calculations and Formatting
The tool automatically updates sales figures, performance metrics, and calendar colors as new data is added. Conditional formatting ensures that high sales figures are highlighted in green, moderate performance in yellow, and low performance in red.
✔ Easy-to-Use Interface
Designed with user-friendly dropdowns and selection options, the dashboard enables quick access to relevant data, eliminating the need for complex manual data handling.
✔ Efficient Data Filtering
Users can apply filters to view sales records for specific employees, compare their performance over different months, and analyze historical trends. This helps in forecasting future sales performance and making data-driven business decisions.
✔ Versatile Customization
The template is fully customizable, allowing businesses to adapt it to their unique sales tracking needs. Whether you’re tracking sales for retail, e-commerce, services, or B2B operations, this dashboard provides valuable insights.
How This Sales Calendar Benefits Your Business
- 📊 Quickly identify sales trends across the year
- ✅ Monitor employee performance with real-time data
- 🎯 Improve sales strategies with detailed analytics
- 🚀 Boost revenue growth by identifying peak selling periods
This Annual Sales Calendar for Sales Dashboard in Excel is the perfect solution for businesses looking to streamline their sales performance tracking, enhance team productivity, and make data-driven decisions with ease.
Click here to read the detailed blog post
Watch the step-by-step video tutorial:
Also check our Inventory Management Form in Excel


Reviews
There are no reviews yet.