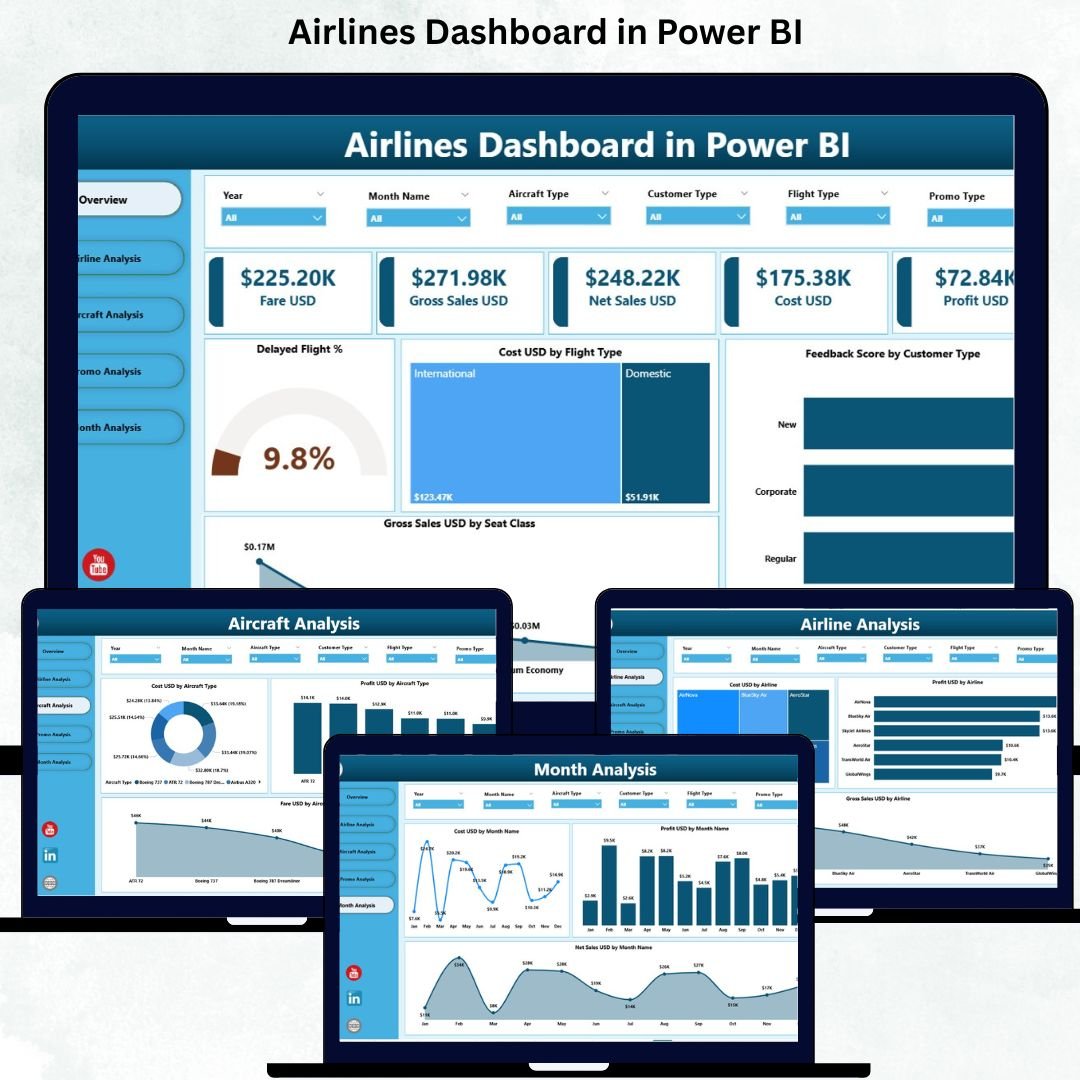
Managing airline operations is complex, fast-moving, and highly competitive. Every flight generates massive amounts of operational, financial, and customer data. When this information lives in scattered spreadsheets, airline teams struggle to make quick, informed decisions. That’s why the Airlines Dashboard in Power BI is a game-changing solution—bringing clarity, speed, and real-time insights directly to your screen.
This dashboard converts raw aviation data into clean, interactive, and decision-ready visuals, empowering airline managers to track KPIs, monitor performance, and solve issues instantly. Whether you want to analyze delayed flights, compare aircraft types, study customer feedback, or measure promotional performance, this dashboard gives you everything in one place.
✈️ Key Features of the Airlines Dashboard in Power BI
Our Airlines Dashboard is built with a powerful five-page structure designed for airline operations, finance, customer experience, and leadership teams.
⭐ 1. Overview Page – Quick Executive Summary

This page provides a complete helicopter view of airline performance.
It includes:
-
Delayed Flight %
-
Cost (USD) by Flight Type
-
Feedback Score by Customer Type
-
Gross Sales (USD) by Seat Class
You’ll instantly know how flights performed, how customers responded, and how sales varied across seat classes—all at a glance.
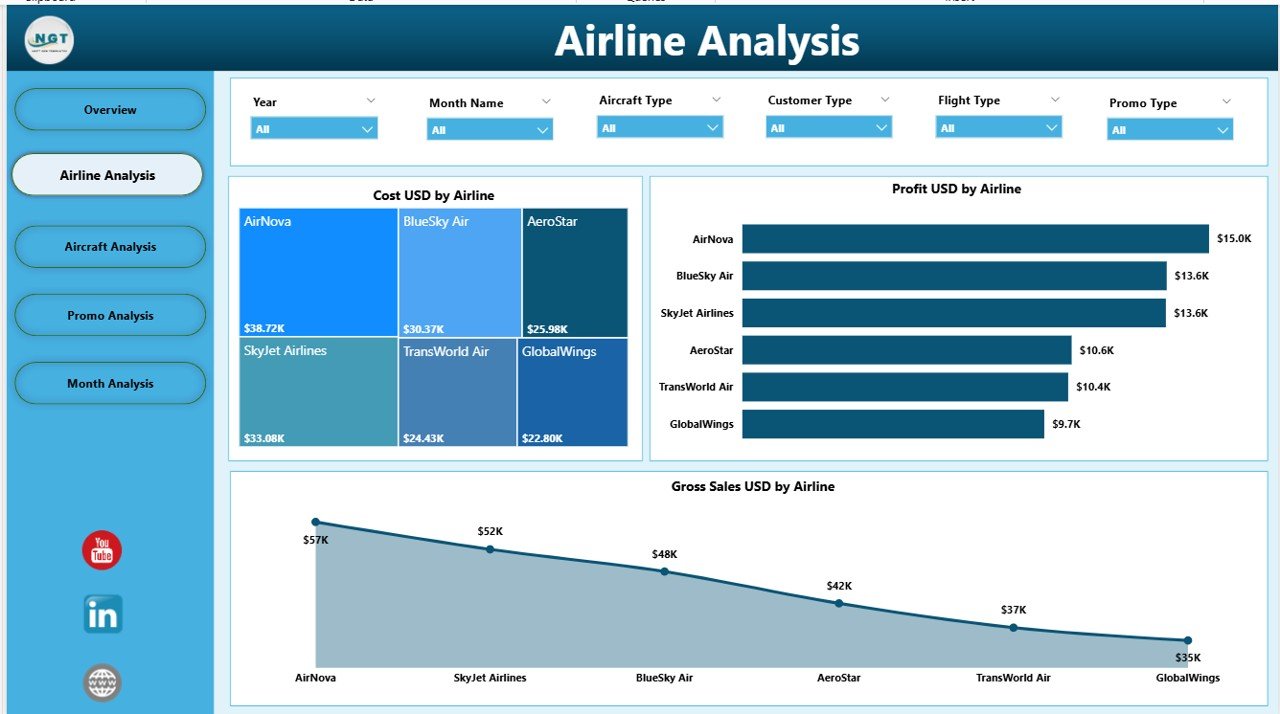
⭐ 2. Airline Analysis – Compare Airline Brands
Perfect for airlines with multiple brands or partner carriers.
You can analyze:
-
Cost by Airline
-
Gross Sales by Airline
-
Profit by Airline
Identify which airline is most profitable, which one produces high costs, and which brand is your strongest performer.
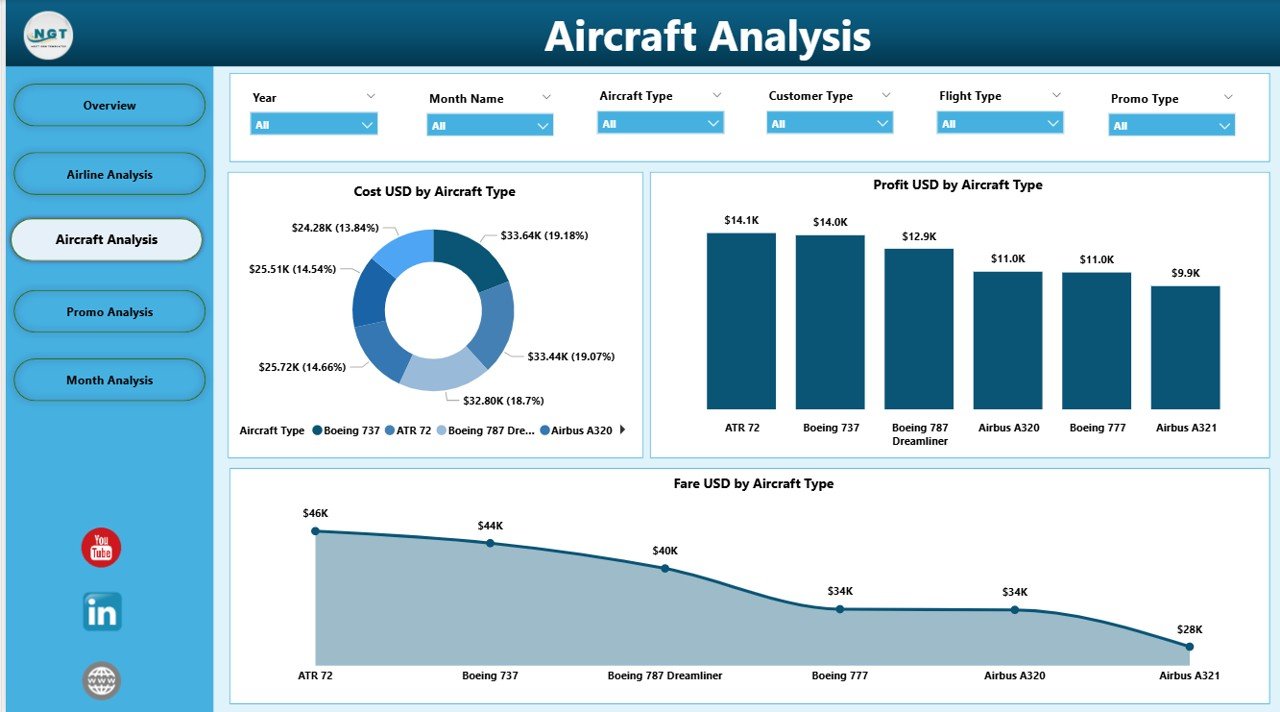
⭐ 3. Aircraft Analysis – Fleet Performance Insights
Aircraft models differ in cost, fuel usage, capacity, and maintenance.
This page helps you measure:
-
Cost by Aircraft Type
-
Profit by Aircraft Type
-
Fare by Aircraft Type
Use these insights for route planning, cost control, and fleet optimization.
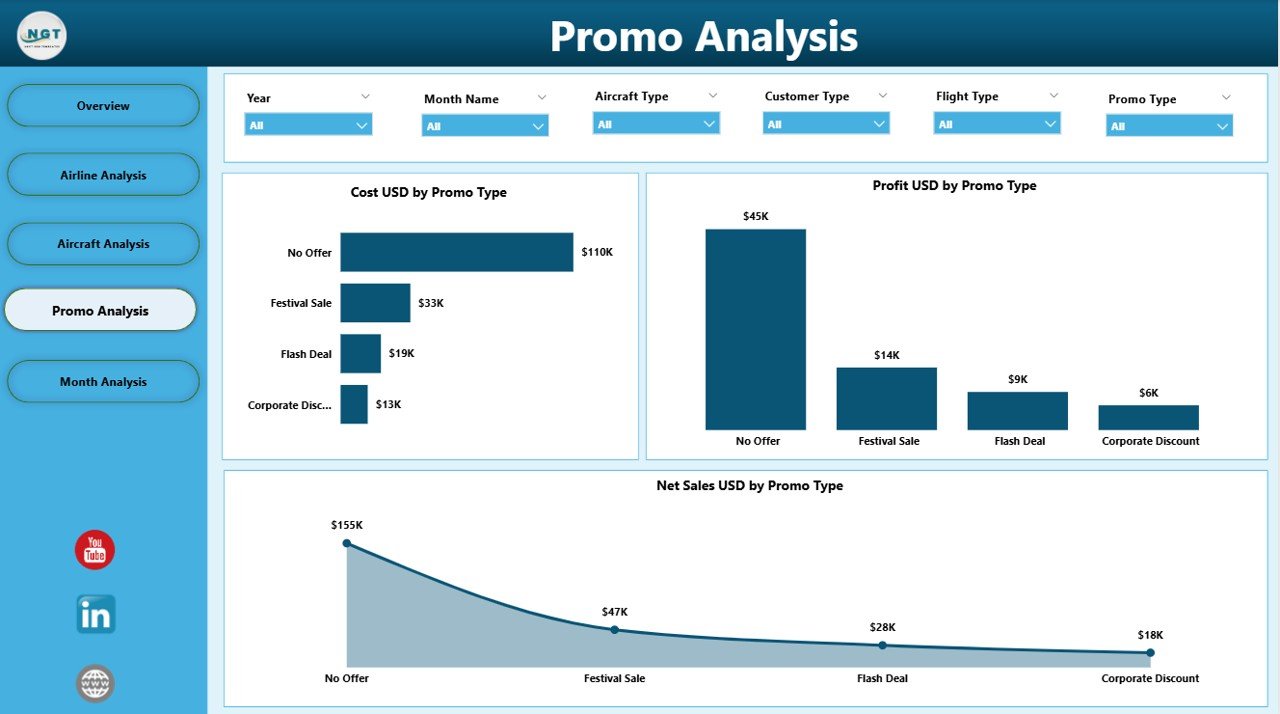
⭐ 4. Promo Analysis – Winning Promotions at a Glance
Every promotion affects sales differently.
This page shows:
-
Cost by Promo Type
-
Profit by Promo Type
-
Net Sales by Promo Type
Understand which promotions attract customers, which ones reduce profits, and which campaigns should continue.
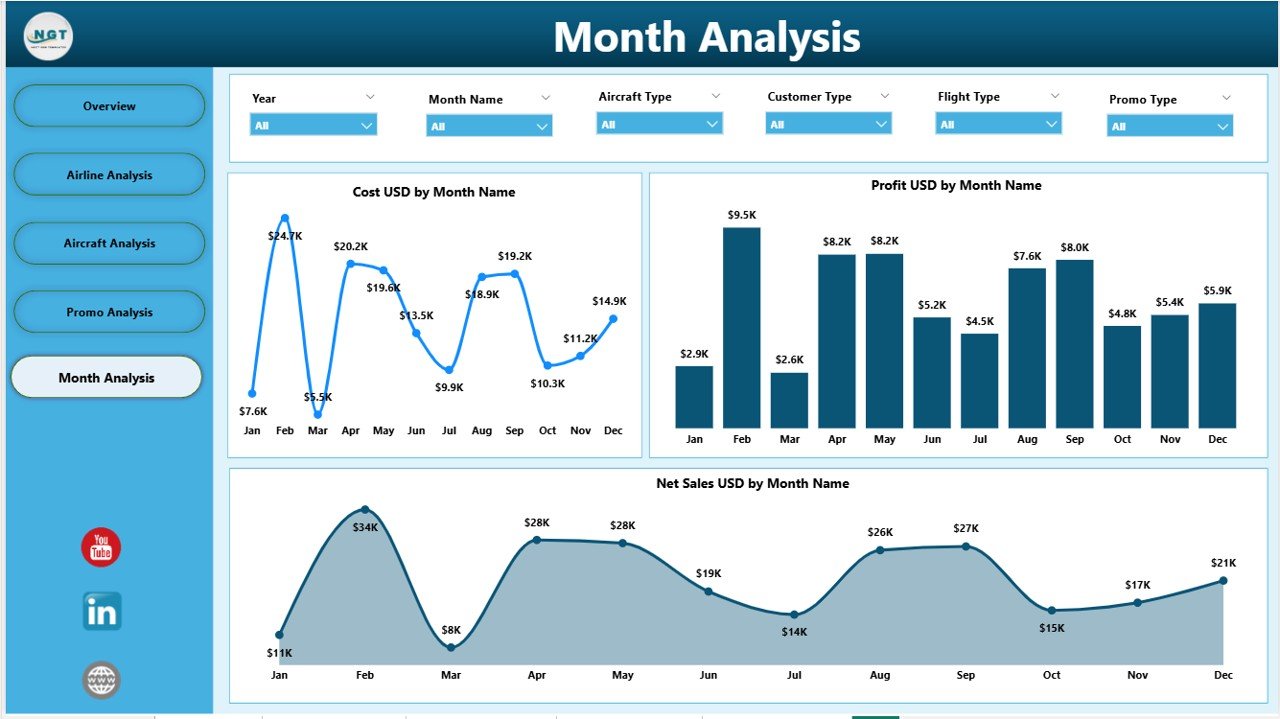
⭐ 5. Monthly Trends – Seasonal & Demand Patterns
Airline performance changes monthly due to weather, holidays, fuel prices, and demand shifts.
Track:
-
Monthly Cost
-
Monthly Profit
-
Net Sales Month-by-Month
Plan better with clear seasonal patterns and budgeting insights.
📦 What’s Inside the Airlines Dashboard in Power BI
You get an end-to-end dashboard file built with professional-quality visualizations.
Inside, you’ll find:
-
Fully built 5-page dashboard
-
Clean slicers for month, airline, aircraft type, promo type, and seat class
-
KPI cards for real-time monitoring
-
Interactive charts and trend lines
-
A structured layout with clear navigation
-
Color-coded visuals for effortless understanding
-
Optimized Power BI model for fast performance
-
Excel sample dataset included
This product is ready to use—just load your data and start analyzing.
🧩 How to Use the Airlines Dashboard in Power BI
Using this dashboard is extremely simple:
-
Open the Power BI file in the Power BI Desktop application.
-
Load your airline dataset (Excel or database).
-
Refresh the visuals to update insights.
-
Use the slicers to filter by month, airline, flight type, customer type, promo, and more.
-
Explore each page to track KPIs for costs, sales, performance, and feedback.
No coding. No complex setup. Just plug, refresh, and visualize.
👤 Who Can Benefit from This Airlines Dashboard in Power BI
This dashboard is built to support all key aviation roles:
-
✈ Airline Managers – Track performance instantly
-
📊 Finance Teams – Monitor costs, profit, and monthly sales
-
🎧 Customer Experience Teams – Improve feedback scores
-
🛫 Operations Managers – Reduce delays and improve efficiency
-
🛩 Fleet Planning Teams – Compare aircraft types
-
📈 Aviation Analysts – Present insights with clarity
-
🎯 Marketing Teams – Optimize promotions with data
Any airline or aviation business can transform decision-making with this tool.
### Click hare to read the Detailed blog post
Visit our YouTube channel to learn step-by-step video tutorials
👉 Youtube.com/@PKAnExcelExpert


Reviews
There are no reviews yet.