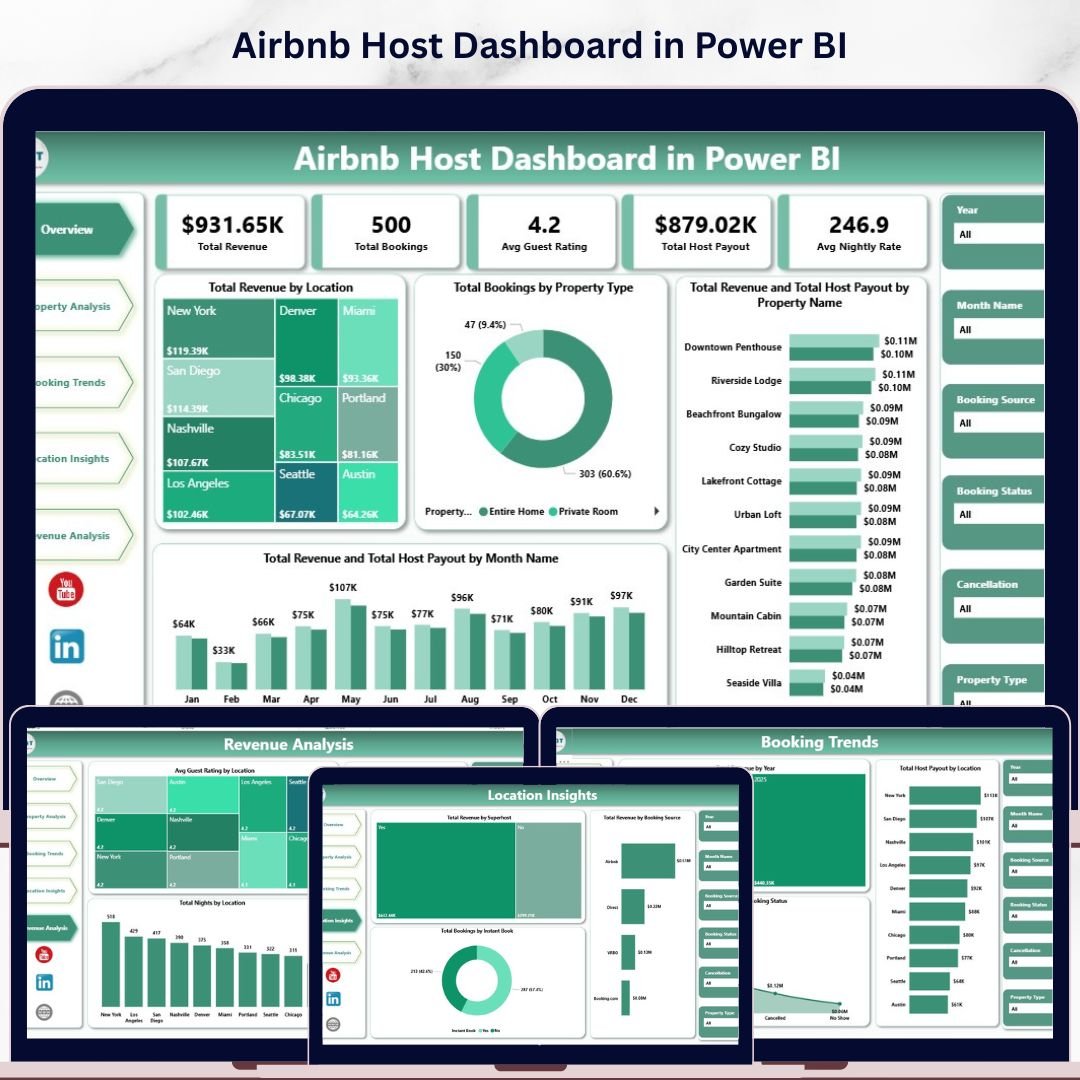
Airbnb Host Dashboard in Power BI is a professional ready-to-use analytics tool built specifically for Airbnb hosts, property managers, and vacation rental operators who want to track their hosting business performance using interactive Power BI visuals. Whether you manage a single listing or a multi-property portfolio across multiple locations, this dashboard transforms your raw booking and revenue data into clear, actionable insights that help you make smarter hosting decisions.
Managing an Airbnb hosting business requires tracking dozens of performance metrics including total revenue, host payouts, guest ratings, nightly rates, booking trends, and location-wise performance. Without a centralized reporting system, hosts often struggle to understand which properties generate the most income and which locations attract the best guest ratings. The Airbnb Host Dashboard in Power BI solves this challenge by consolidating all your hosting data into one dynamic, interactive reporting system powered by Microsoft Power BI.
This dashboard includes 5 interactive analytical pages covering Overview, Property Analysis, Booking Trends, Location Insights, and Revenue Analysis. Each page delivers focused insights using dynamic visuals, KPI cards, and slicers that allow you to filter data instantly by property type, location, year, month, booking status, and more. Simply connect your data source, refresh the dataset, and every chart and KPI updates automatically.
🔑 Key Features of Airbnb Host Dashboard in Power BI
📊 5 Interactive Dashboard Pages — Analyze Airbnb hosting performance across Overview, Property Analysis, Booking Trends, Location Insights, and Revenue Analysis pages with dynamic Power BI visuals.
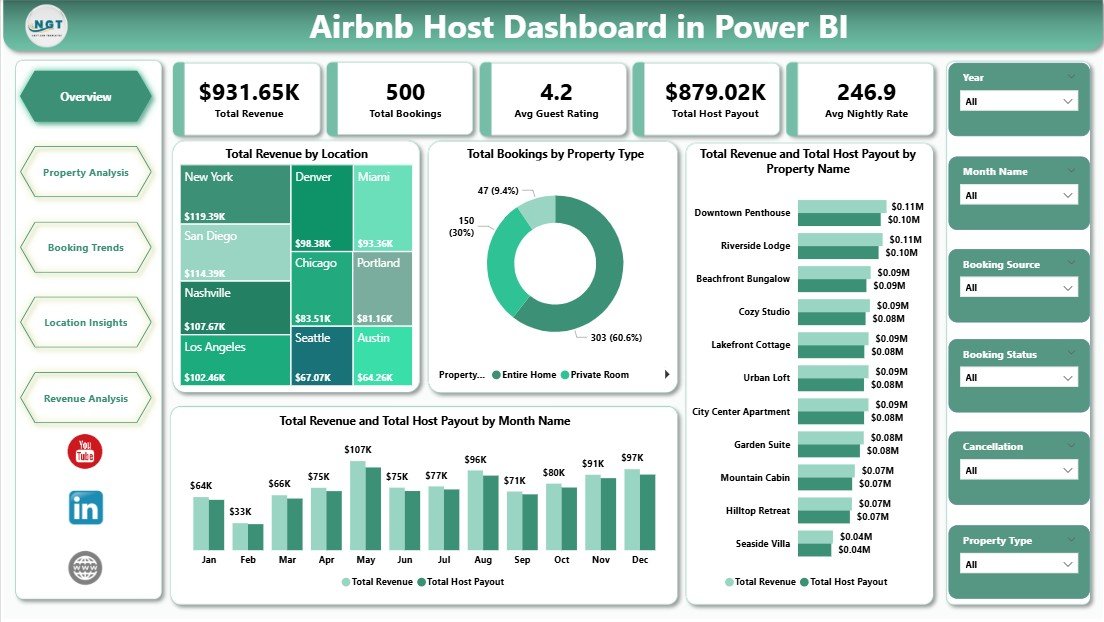
📈 Dynamic KPI Cards — Track Total Revenue, Total Bookings, Avg Guest Rating, Total Host Payout, and Avg Nightly Rate at a glance on the Overview page.
🎛 Interactive Slicers and Filters — Filter dashboard data instantly by property type, location, booking source, superhost status, month, year, and booking status to analyze specific segments.
🏠 Property-Level Performance — Compare revenue, guest ratings, and total nights across all your Airbnb properties to identify top performers and underperformers.
📍 Location-Based Insights — Analyze Avg Guest Rating, Avg Nightly Rate, and Total Nights across all your hosting locations to optimize your geographic strategy.
💰 Revenue Breakdown Analysis — Understand revenue distribution by superhost status, booking source, and instant book availability to maximize earnings.
🔄 Auto-Refreshing Power BI Visuals — All charts and KPIs update automatically when you refresh your connected data source in Power BI Desktop.
📋 Professional DAX-Powered Calculations — Built-in DAX measures handle all KPI calculations, ensuring accurate and reliable analytics across every page.
📦 What’s Inside the Airbnb Host Dashboard in Power BI
The dashboard contains 5 analytical pages designed to analyze every aspect of your Airbnb hosting business.
🏠 Overview Page — Main Airbnb Analytics Dashboard
 Overview Page
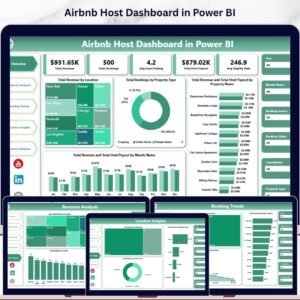
The Overview Page provides a high-level snapshot of your entire Airbnb hosting business. It displays 5 KPI cards: Total Revenue, Total Bookings, Avg Guest Rating, Total Host Payout, and Avg Nightly Rate. The page also includes interactive charts showing Total Revenue by Location, Total Bookings by Property Type, Total Revenue and Total Host Payout by Property Name, and Total Revenue and Total Host Payout by Month Name. Multiple slicers allow you to filter the entire dashboard instantly.
📊 Property Analysis Page
 Property Analysis
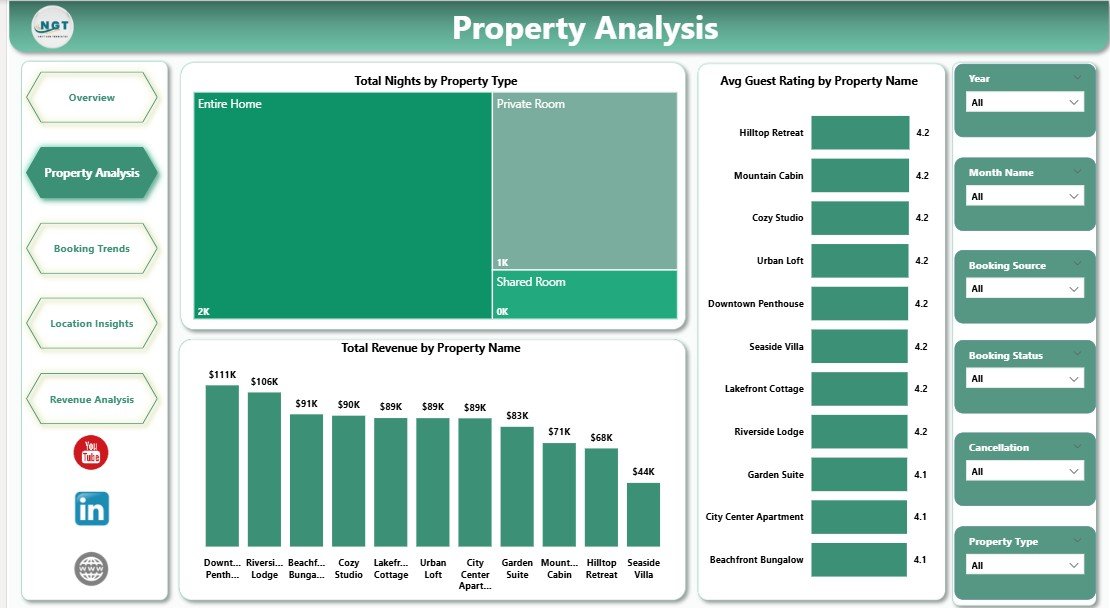
The Property Analysis page focuses on property-level performance with charts analyzing Total Nights by Property Type, Avg Guest Rating by Property Name, and Total Revenue by Property Name.
📈 Booking Trends Page
 Booking Trends
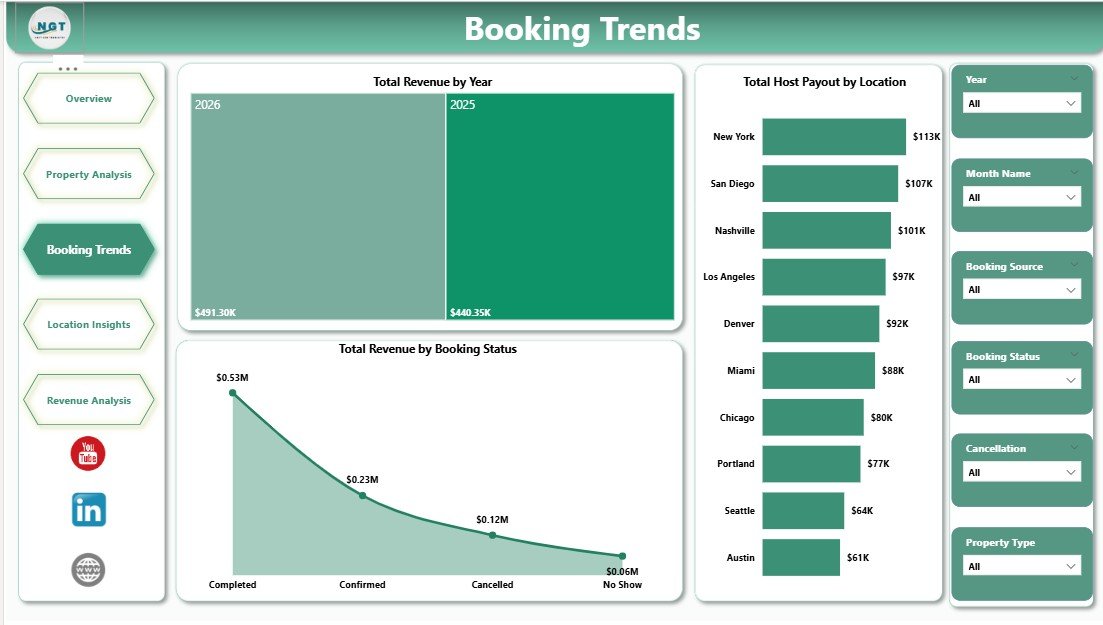
The Booking Trends page analyzes Total Revenue by Year, Total Host Payout by Location, and Total Revenue by Booking Status.
📍 Location Insights Page
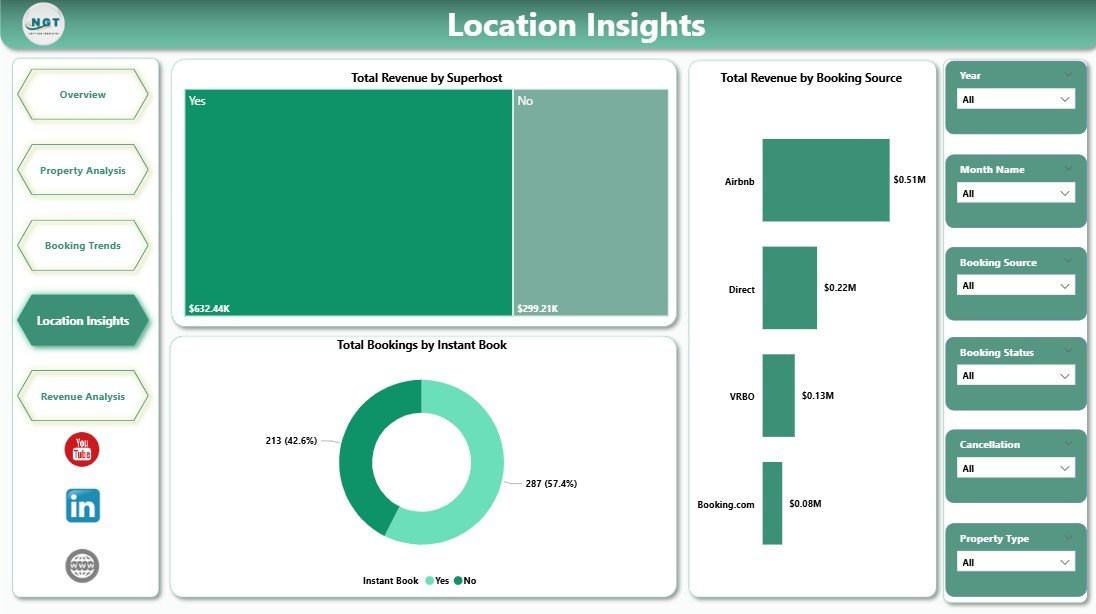 Location Insights
The Location Insights page includes Total Revenue by Superhost, Total Revenue by Booking Source, and Total Bookings by Instant Book.
💰 Revenue Analysis Page
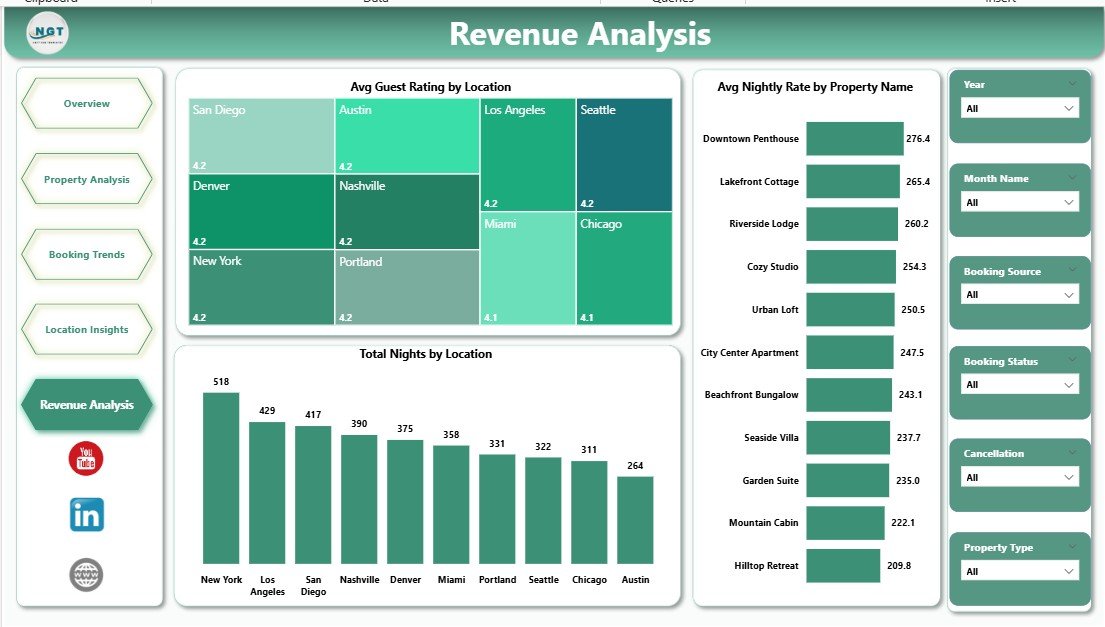 Revenue Analysis
The Revenue Analysis page features Avg Guest Rating by Location, Avg Nightly Rate by Property Name, and Total Nights by Location.
⚙️ How to Use the Airbnb Host Dashboard in Power BI
1️⃣ Download and open the .pbix file in Power BI Desktop (free from Microsoft).
2️⃣ Connect your own Airbnb booking dataset or replace the sample data with your records.
3️⃣ Click Refresh in the Home tab to update all visuals and KPI cards.
4️⃣ Use slicers on each page to filter data by property type, location, year, month, or booking status.
5️⃣ Explore all 5 analytical pages to gain complete insights into your Airbnb hosting business.
👥 Who Can Benefit from This Airbnb Host Dashboard in Power BI
🏠 Airbnb Hosts — Track revenue, guest ratings, and property performance across all listings.
🏢 Property Managers — Monitor multi-property portfolios and identify top performers across locations.
📊 Rental Business Analysts — Study booking trends, cancellation patterns, and revenue distribution.
💼 Vacation Rental Owners — Optimize nightly rates and superhost strategies based on data-driven insights.
📈 Hospitality Consultants — Deliver professional hosting analytics reports to clients using Power BI.
🎓 Students and Data Enthusiasts — Learn Power BI dashboard building with a real-world Airbnb hosting dataset.
❓ Frequently Asked Questions
What KPIs does the Airbnb Host Dashboard in Power BI track?
The Airbnb Host Dashboard in Power BI tracks 5 key performance indicators including Total Revenue, Total Bookings, Avg Guest Rating, Total Host Payout, and Avg Nightly Rate.
Do I need advanced Power BI skills to use this dashboard?
No. Simply open the .pbix file in Power BI Desktop, replace the sample data with your own records, and click Refresh.
Can I track multiple Airbnb properties with this dashboard?
Yes. Use the built-in slicers to filter by property name, property type, or location to compare performance across your entire portfolio.
How is this different from the Airbnb Host Dashboard in Excel?
The Power BI version offers more advanced visualization capabilities, larger dataset handling, and DAX-powered calculations. The Airbnb Host Dashboard in Excel is ideal for users who prefer Excel with pivot tables.
Can I connect live data sources to this dashboard?
Yes. Power BI Desktop supports connecting to Excel files, databases, CSV files, and cloud data sources with scheduled refreshes.
Can I use this dashboard for Vrbo or other rental platforms?
Absolutely. The data structure works for any short-term rental platform including Vrbo, Booking.com, and similar services.
🔗 Explore Related Templates
🏠 Airbnb Host Dashboard in Excel — The Excel version with pivot-based interactive charts and slicers.
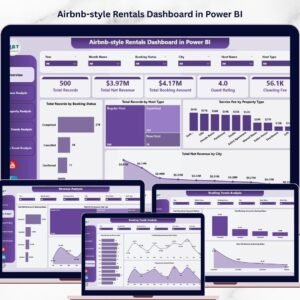
📊 Airbnb-style Rentals Dashboard in Power BI — Advanced Power BI rental analytics with booking and host evaluation.
📈 Airbnb-style Rentals Dashboard in Excel — Comprehensive Excel dashboard for short-term rental analytics.
Browse our complete collection of Power BI Dashboard Templates and Hospitality & Tourism Templates.
📖 Click here to read the Detailed Blog Post
🎥 Visit our YouTube channel to learn step-by-step video tutorials
👉 YouTube.com/@NextGenTemplates


Reviews
There are no reviews yet.