

Key Features of AI Research Labs KPI Dashboard in Power BI
Unlock the power of data-driven decision-making with the AI Research Labs KPI Dashboard in Power BI, a ready-to-use, fully customizable dashboard designed to track and analyze your key performance indicators (KPIs) effortlessly. This dashboard offers an intuitive interface with seamless data refresh capabilities-simply update your Excel data file, connect it to the Power BI file, and hit refresh to see your latest insights instantly.
Featuring three dynamic pages, this dashboard provides comprehensive insights into your KPIs:
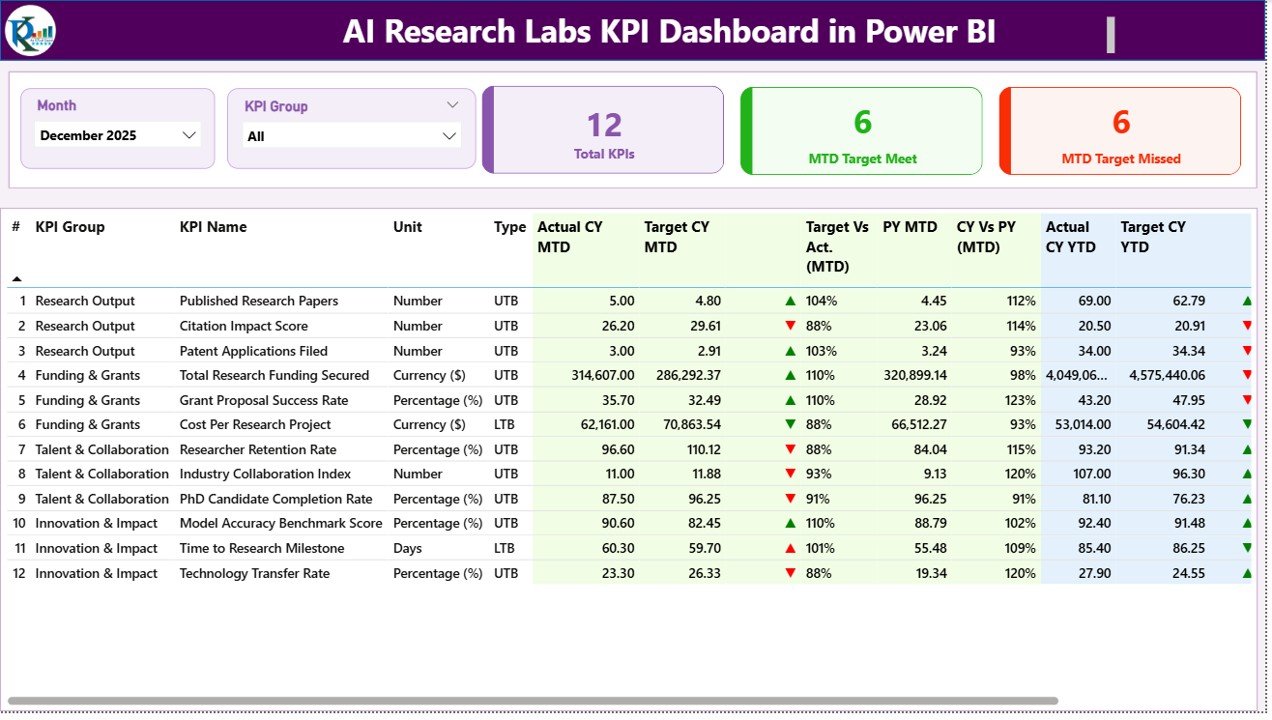
📊 Summary Page: This is your control center. Easily filter data by Month and KPI Group using slicers at the top. The page highlights three key cards showing total KPIs count, month-to-date (MTD) target meets, and MTD target misses. A detailed table below breaks down each KPI with crucial metrics such as KPI Number, Group, Name, Unit, Type (Lower the Better or Upper the Better), Actual and Target values for MTD and Year-to-Date (YTD), along with visual status icons indicating performance trends through red/green arrows. The table also compares current period data with previous year for both MTD and YTD, offering a quick glance at progress and performance over time.
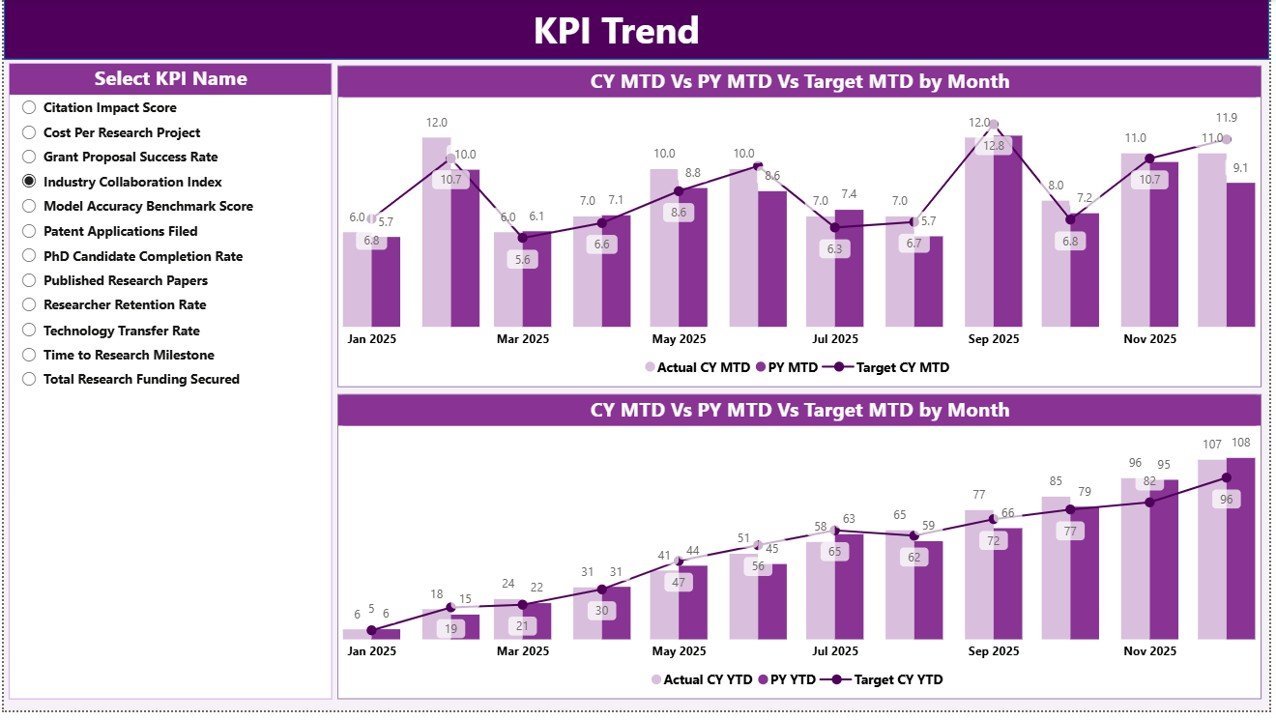
📈 KPI Trend Page: Visualize your KPI progress with two combo charts displaying Actual values for Current Year, Previous Year, and Targets for both MTD and YTD. Easily switch between KPIs using the slicer on the left, allowing you to track trends and identify patterns quickly.
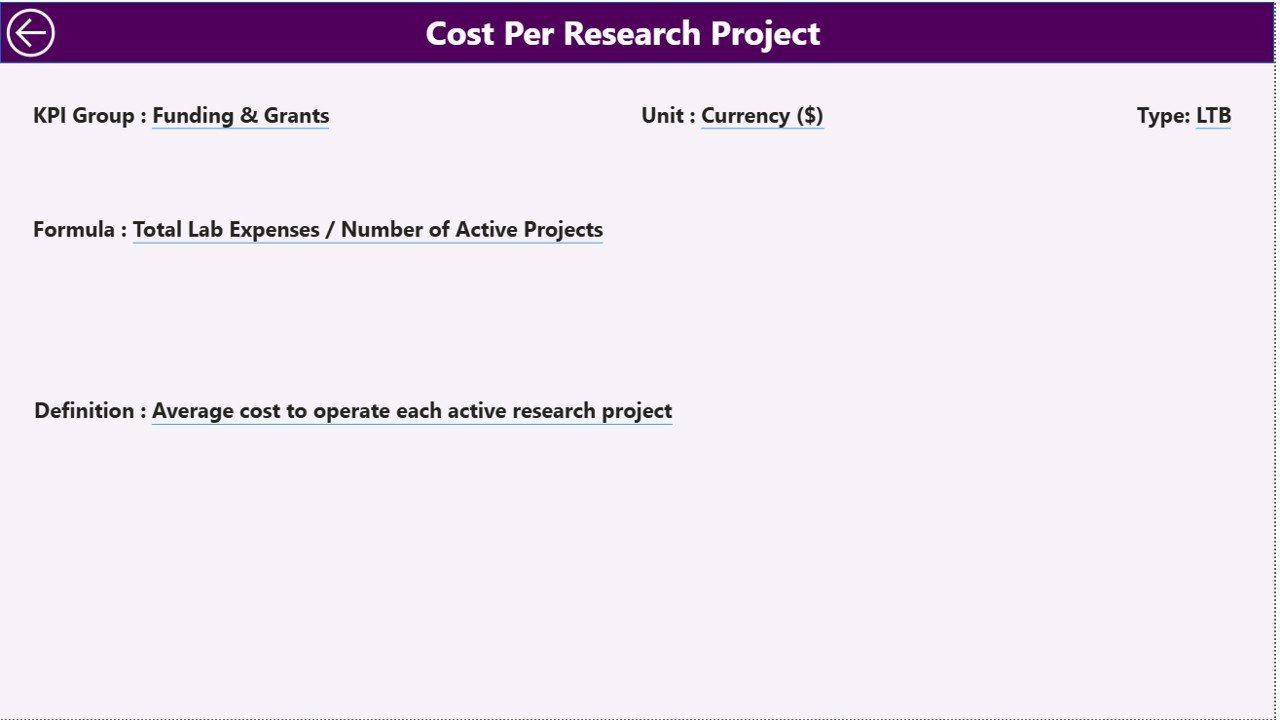
🔍 KPI Definition Page: A hidden drill-through page that provides detailed KPI definitions and formulas. Access this page directly from the Summary Page by drilling through any KPI. Navigate back effortlessly with the back button located at the top left corner.
What’s Inside the AI Research Labs KPI Dashboard in Power BI
Inside this powerful dashboard package, you will find:
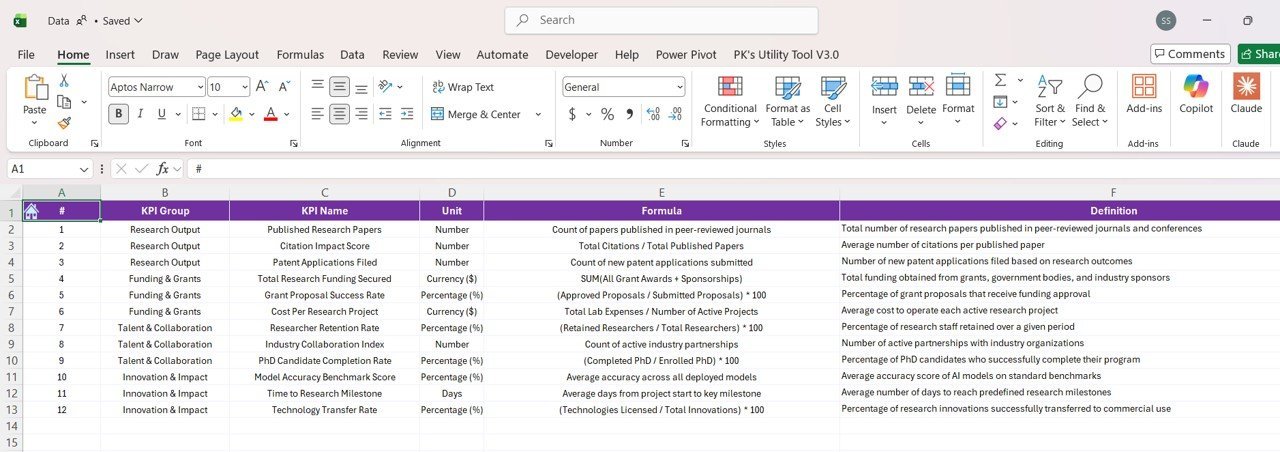
📁 An easy-to-use Excel data source file with three crucial worksheets:
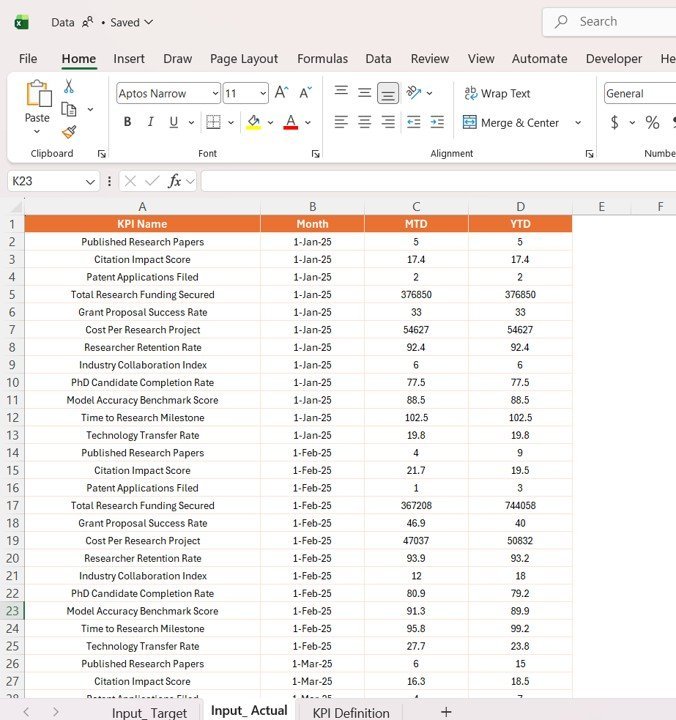
📝 Input_ Actual Sheet: Fill in actual KPI values by month, including MTD and YTD figures.
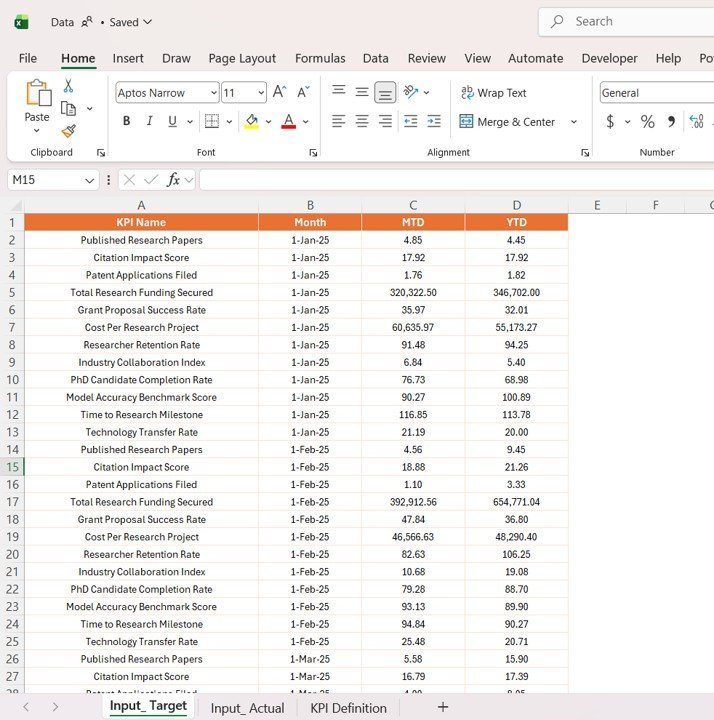
🎯 Input_ Target Sheet: Input your target KPI values by month, corresponding to MTD and YTD goals.
📚 KPI Definition Sheet: Enter KPI details such as Number, Group, Name, Unit, Formula, Definition, and Type (Lower the Better or Upper the Better).
🖥️ The Power BI desktop (.pbix) dashboard file preloaded with all visuals, slicers, and interactions ready to connect with your data.
📈 Interactive report pages to monitor overall KPI health, trends, and detailed definitions for in-depth understanding.
How to Use the AI Research Labs KPI Dashboard in Power BI
Using this dashboard is straightforward and requires minimal setup:
🔄 Step 1: Update the Excel data source file by entering your actual and target KPI values in the respective sheets.
🔗 Step 2: Open the Power BI dashboard file and connect it to your updated Excel data source.
🔄 Step 3: Click the Refresh button on the Home tab in Power BI to load the latest data.
🔍 Step 4: Use the slicers on the Summary and KPI Trend pages to filter by Month, KPI Group, or KPI Name.
📊 Step 5: Drill through to the KPI Definition page from the Summary page for detailed KPI insights.
🚀 No advanced technical skills required-designed for quick implementation and immediate insights.
Who Can Benefit from This AI Research Labs KPI Dashboard in Power BI
This dashboard is crafted for professionals and organizations who want to harness data for strategic growth:
👩💼 Business Analysts: Quickly track KPI performance and generate actionable insights.
📊 Data Scientists & Researchers: Visualize research lab productivity and efficiency metrics with ease.
📈 Managers & Executives: Monitor critical KPIs to make informed decisions and align teams towards goals.
🏢 Corporate Strategy Teams: Evaluate monthly and yearly performance against targets to drive better planning.
📉 Operations Teams: Identify areas where KPIs are underperforming through clear visual indicators.
🌐 AI and Tech Startups: Leverage robust KPI tracking to sustain growth and optimize resources.
📈 Consultants: Use this dashboard as a customizable tool for client reporting and performance measurement.
Click here to read the Detailed blog post.
Visit our YouTube channel to learn step-by-step video tutorials.


Reviews
There are no reviews yet.