Managing agricultural equipment production can be extremely complex. Manufacturers must coordinate production lines, departments, workforce shifts, quality control processes, and order delivery timelines. When organizations rely only on manual reports or scattered spreadsheets, it becomes difficult to monitor production performance, track costs, identify delays, and measure profitability.
This is where the Agricultural Equipment Production Dashboard in Power BI becomes a powerful solution.
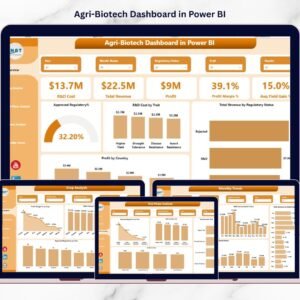
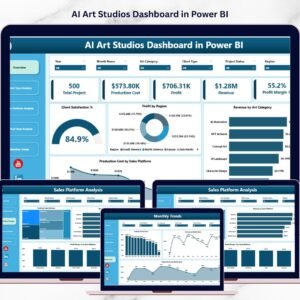
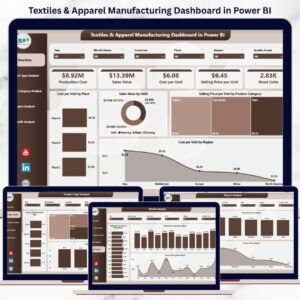
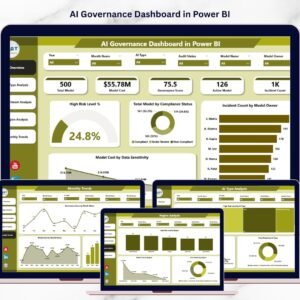
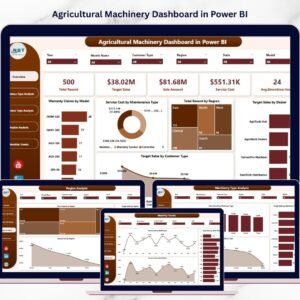
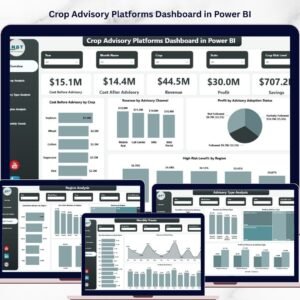
This professionally designed dashboard helps agricultural machinery manufacturers analyze production performance, monitor equipment output, track operational costs, evaluate product quality, and analyze revenue trends in a single interactive interface.
The dashboard converts raw production data into clear visual insights using charts, KPI indicators, and dynamic filters. As a result, production managers, operations leaders, and executives can quickly identify bottlenecks, improve efficiency, and make data-driven decisions.
Whether your organization produces tractors, harvesters, irrigation equipment, or seed drills, this dashboard provides the operational visibility needed to optimize manufacturing performance and improve profitability.
🚜 Key Feature of Agricultural Equipment Production Dashboard in Power BI
This dashboard includes five powerful analytical pages that allow manufacturing companies to monitor production operations from multiple perspectives.
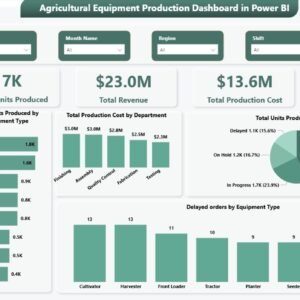
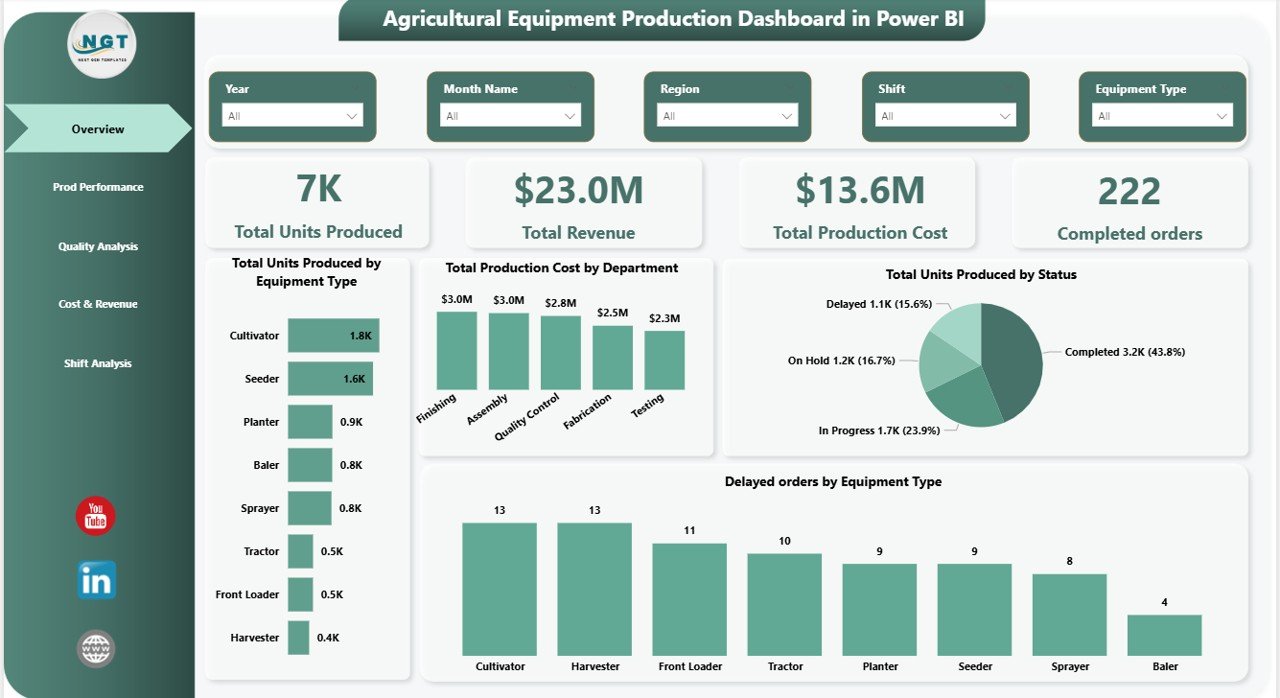
📊 Interactive Overview Dashboard
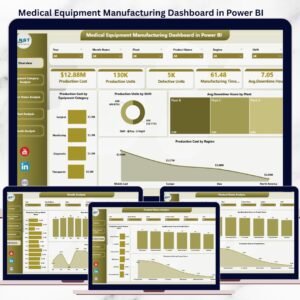
The main dashboard provides a high-level summary of production operations using KPI cards such as Total Units Produced, Total Revenue, Total Production Cost, Completed Orders, and Production Efficiency.
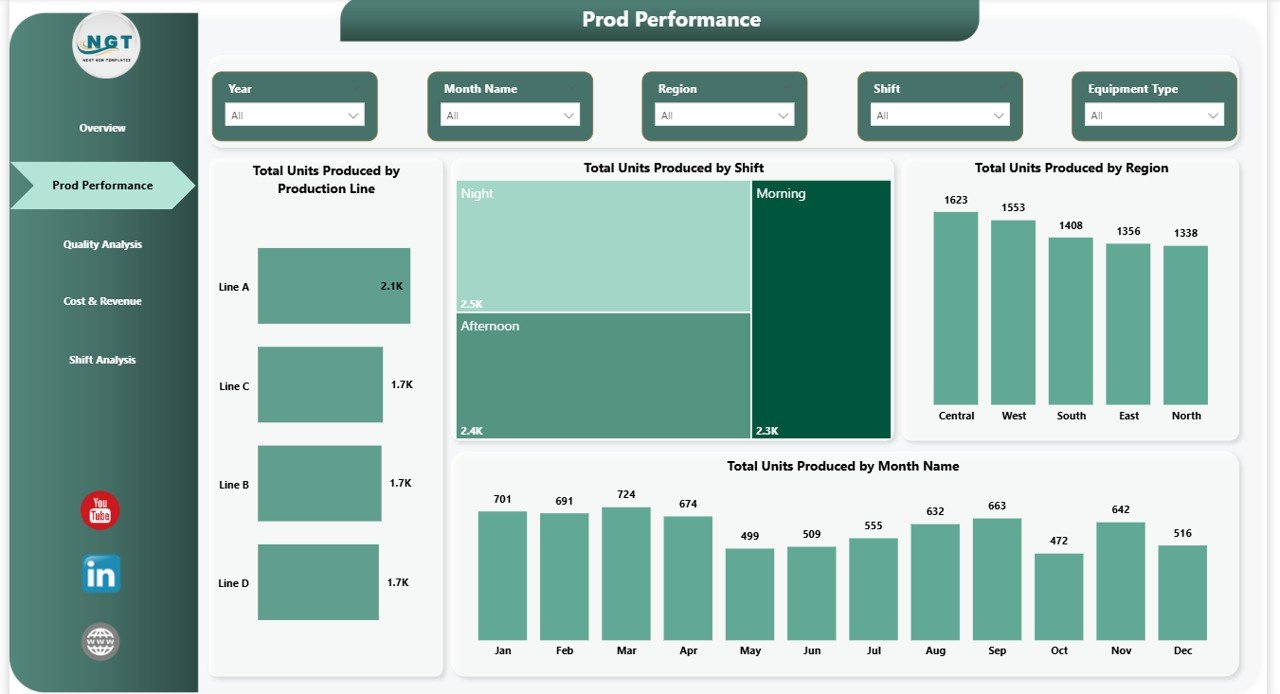
⚙️ Production Performance Analysis
Analyze production output across different production lines, shifts, regions, and months to identify high-performing and low-performing areas.
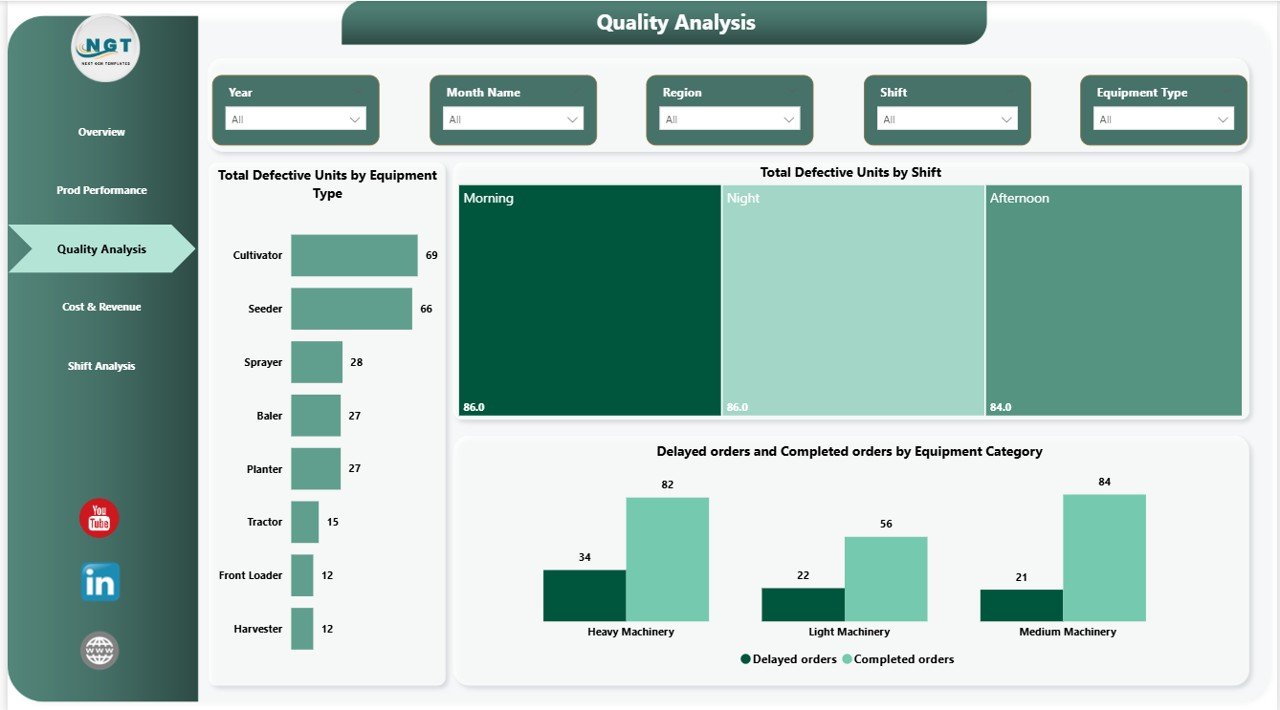
📉 Quality Monitoring Dashboard
Track defective units by equipment type and production shift. This helps quality control teams quickly identify operational issues and reduce defect rates.
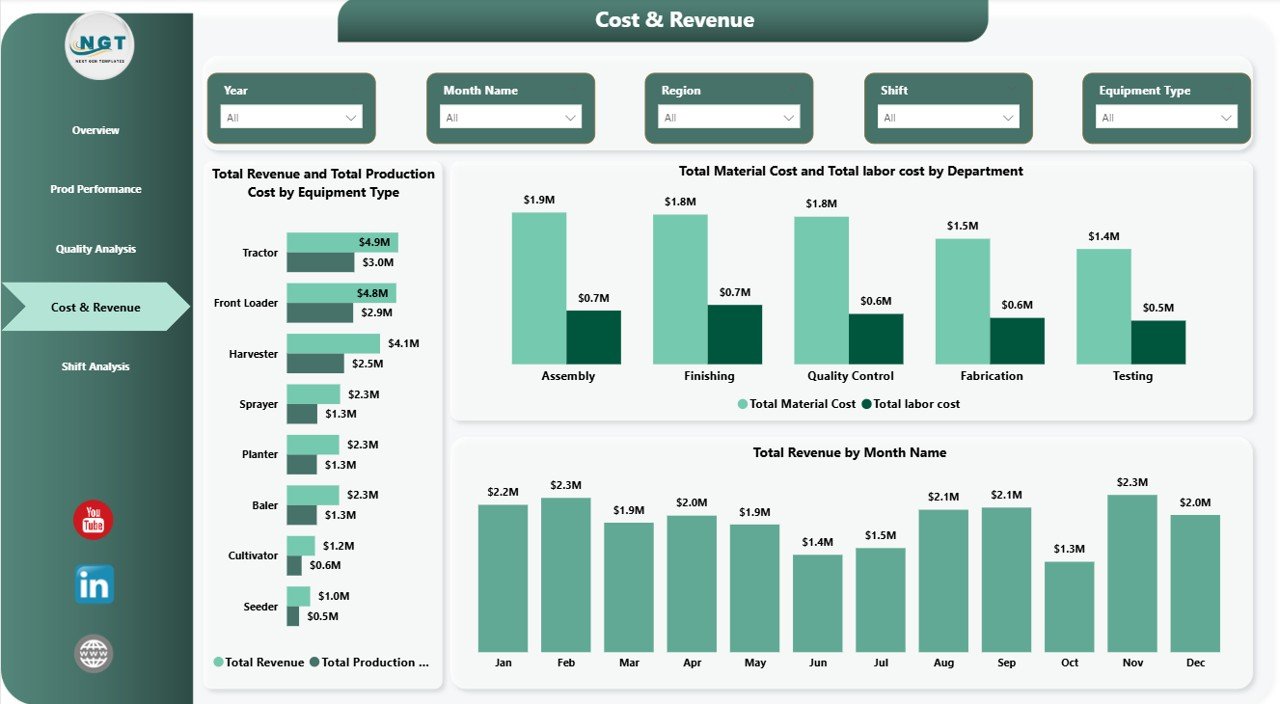
💰 Cost & Revenue Analysis
Monitor production costs, material expenses, labor costs, and equipment profitability. Managers can easily identify cost drivers and improve financial efficiency.
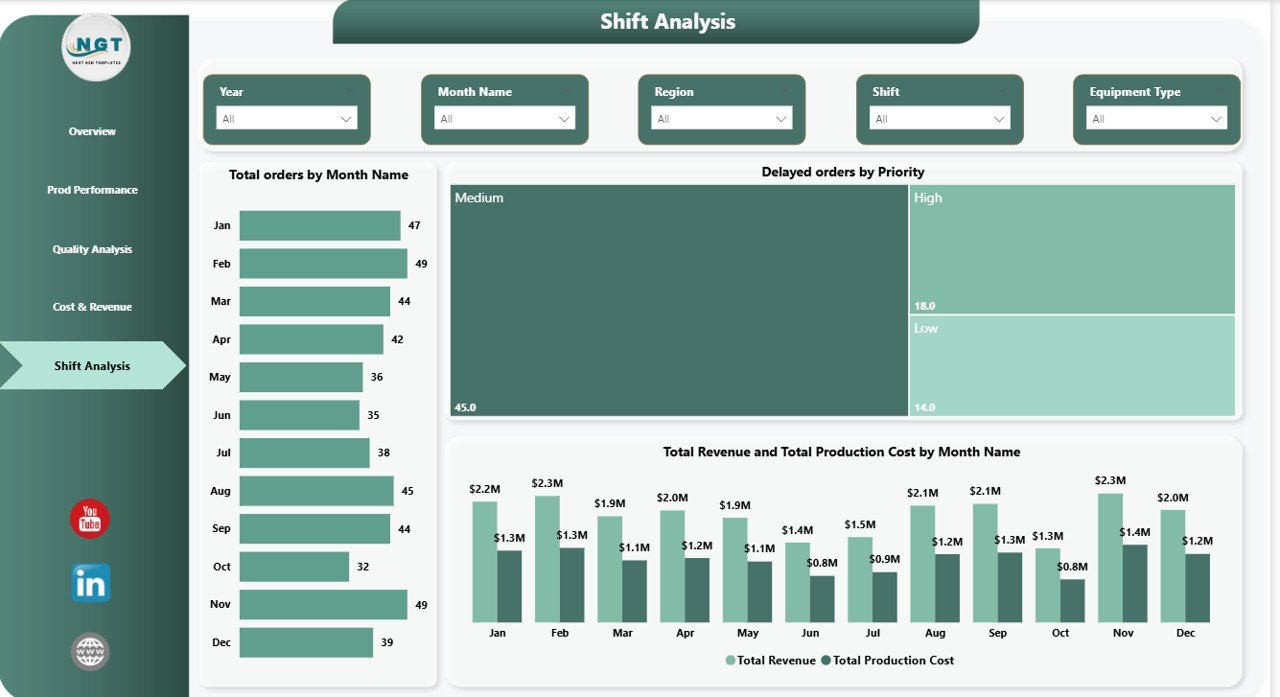
📅 Shift Analysis Analysis
Understand monthly trends in production output, orders received, delayed orders, and revenue generation to support better production planning.
🎯 Dynamic Slicers & Filters
Interactive filters allow users to quickly analyze production data based on specific parameters, improving dashboard usability.
⚡ Real-Time Data Insights
Power BI visualization enables fast analysis of large production datasets.
📈 Performance KPI Cards
Monitor key manufacturing metrics instantly without analyzing raw data manually.
🔎 Operational Bottleneck Detection
Identify delayed orders, production inefficiencies, and high defect areas instantly.
🏭 Manufacturing-Focused Analytics
Designed specifically for agricultural equipment manufacturers.
📊 What’s Inside the Agricultural Equipment Production Dashboard in Power BI
This dashboard includes five interactive analytical pages designed to provide deep operational insights.
✔ Overview Dashboard Page
✔ Production Performance Analysis Page
✔ Quality Analysis Page
✔ Cost & Revenue Analysis Page
✔ Month-wise Production Analysis Page
Each page contains professionally designed charts, slicers, KPI cards, and performance visuals that make production monitoring simple and efficient.
The dashboard analyzes key manufacturing metrics such as:
• Total Units Produced
• Production Cost
• Revenue Generated
• Completed Orders
• Delayed Orders
• Defective Units
• Production Efficiency
These metrics help managers evaluate operational performance and identify areas for improvement.
⚙️ How to Use the Agricultural Equipment Production Dashboard in Power BI
Using this dashboard is simple and user-friendly.
1️⃣ Import your production data into the connected Excel dataset.
2️⃣ Refresh the Power BI dashboard to update visuals.
3️⃣ Use interactive slicers to filter production insights.
4️⃣ Analyze production output, quality metrics, and cost data.
5️⃣ Identify operational inefficiencies and improve manufacturing performance.
The dashboard automatically converts raw production data into visual insights, enabling managers to focus on decision-making rather than manual reporting.
👨🌾 Who Can Benefit from This Agricultural Equipment Production Dashboard in Power BI
This dashboard is extremely useful for organizations involved in agricultural machinery manufacturing.
👨🏭 Manufacturing Managers – Monitor production efficiency and plant performance.
📊 Production Supervisors – Track shift productivity and production line output.
💼 Operations Teams – Identify delays, production bottlenecks, and operational issues.
💰 Financial Analysts – Monitor production cost and revenue performance.
🏢 Business Executives – Make data-driven strategic decisions using visual insights.
🚜 Agricultural Equipment Manufacturers – Improve overall manufacturing efficiency.
Click here to read the Detailed blog post
Watch the step-by-step video tutorial:
Watch the step-by-step video tutorial: