
The Advertising KPI Dashboard in Excel is an essential tool for businesses looking to track, measure, and optimize the performance of their advertising campaigns. Whether you are managing digital ads, print ads, or TV commercials, this dashboard provides you with a comprehensive overview of key advertising performance indicators (KPIs) to ensure that your marketing efforts are driving results.
With real-time tracking, dynamic charts, and customizable features, this Excel dashboard allows marketing teams, advertisers, and business owners to make data-driven decisions to optimize ad spend, increase ROI, and improve campaign performance. Perfect for tracking everything from impressions and clicks to conversions and cost-per-click (CPC), this tool helps you take full control of your advertising strategy.
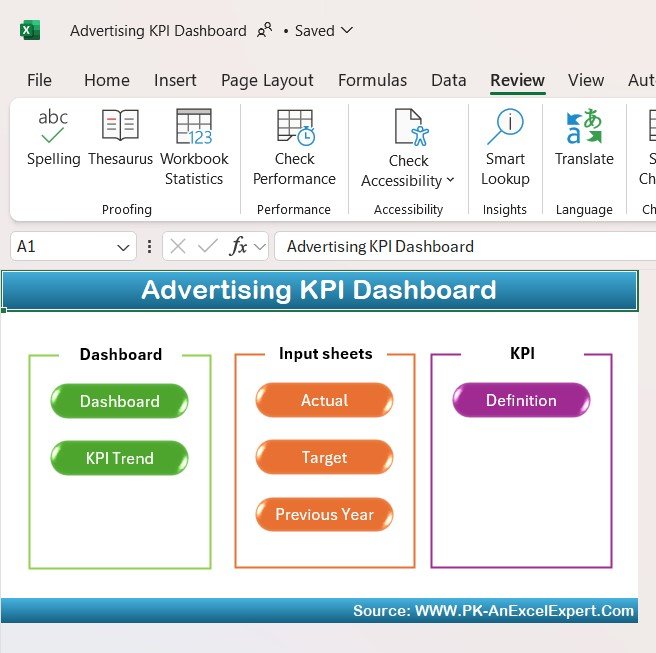
Key Features of the Advertising KPI Dashboard in Excel:
📊 Comprehensive KPI Tracking
Track essential advertising KPIs such as impressions, clicks, conversions, click-through rates (CTR), cost-per-click (CPC), and return on ad spend (ROAS) to measure the effectiveness of your campaigns.
📈 Real-Time Performance Monitoring
Monitor the performance of your ad campaigns in real time, ensuring you can react quickly and optimize your strategies to achieve your goals.
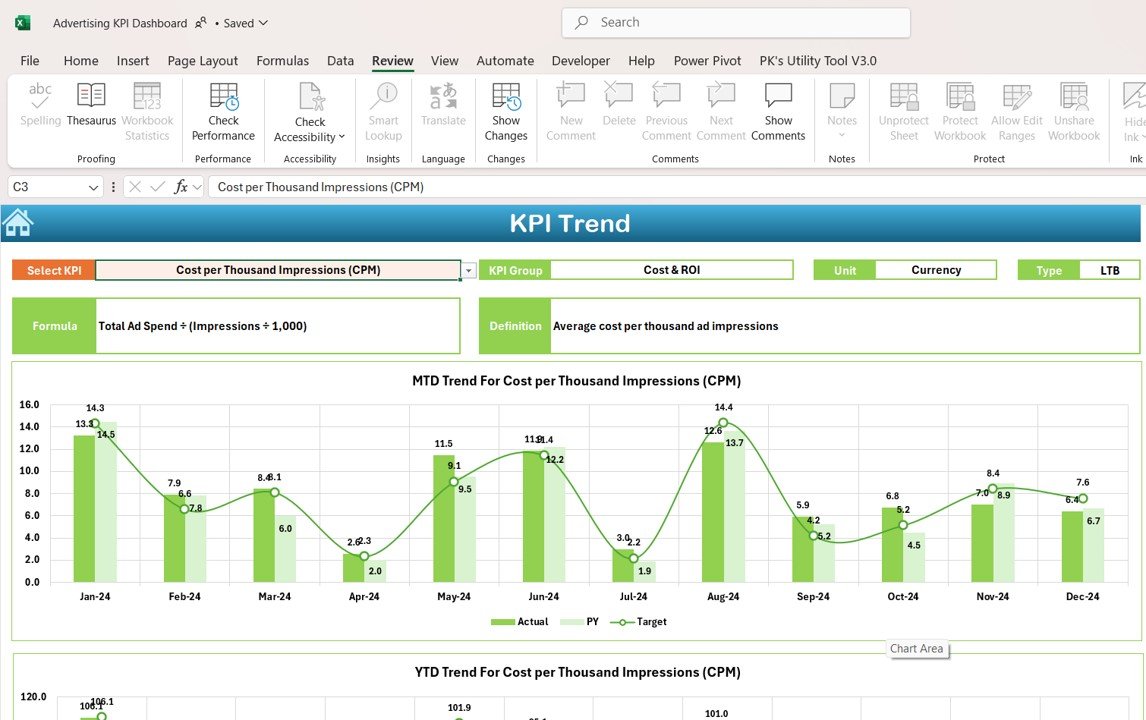
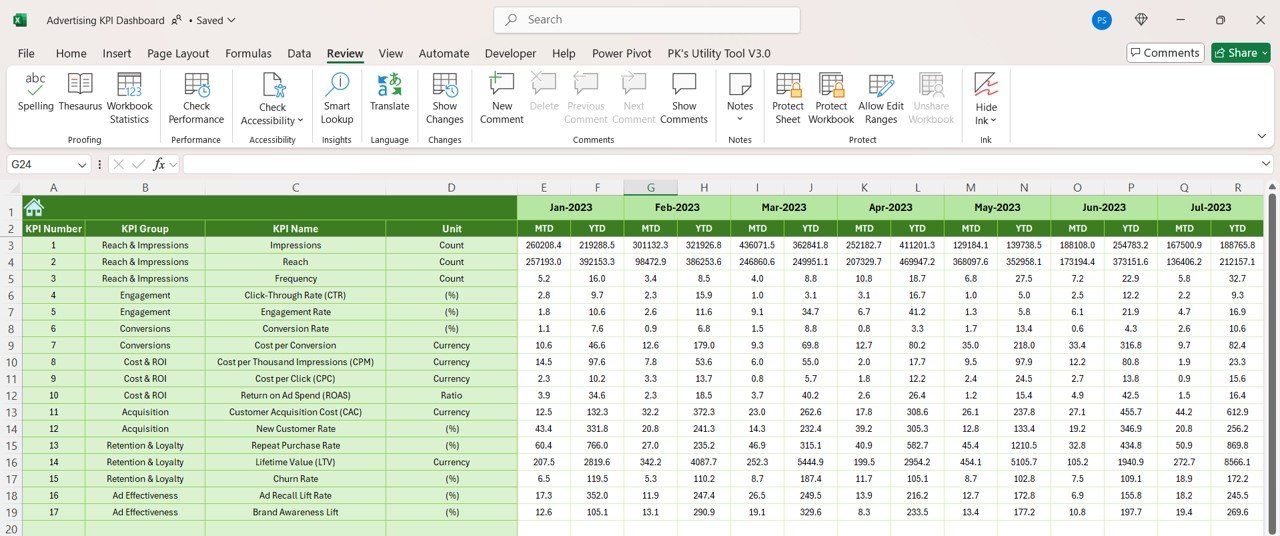
📅 Month-to-Date (MTD) and Year-to-Date (YTD) Analysis
Track your advertising performance over different periods and compare current data with past results, allowing you to identify trends, seasonal changes, and areas for improvement.
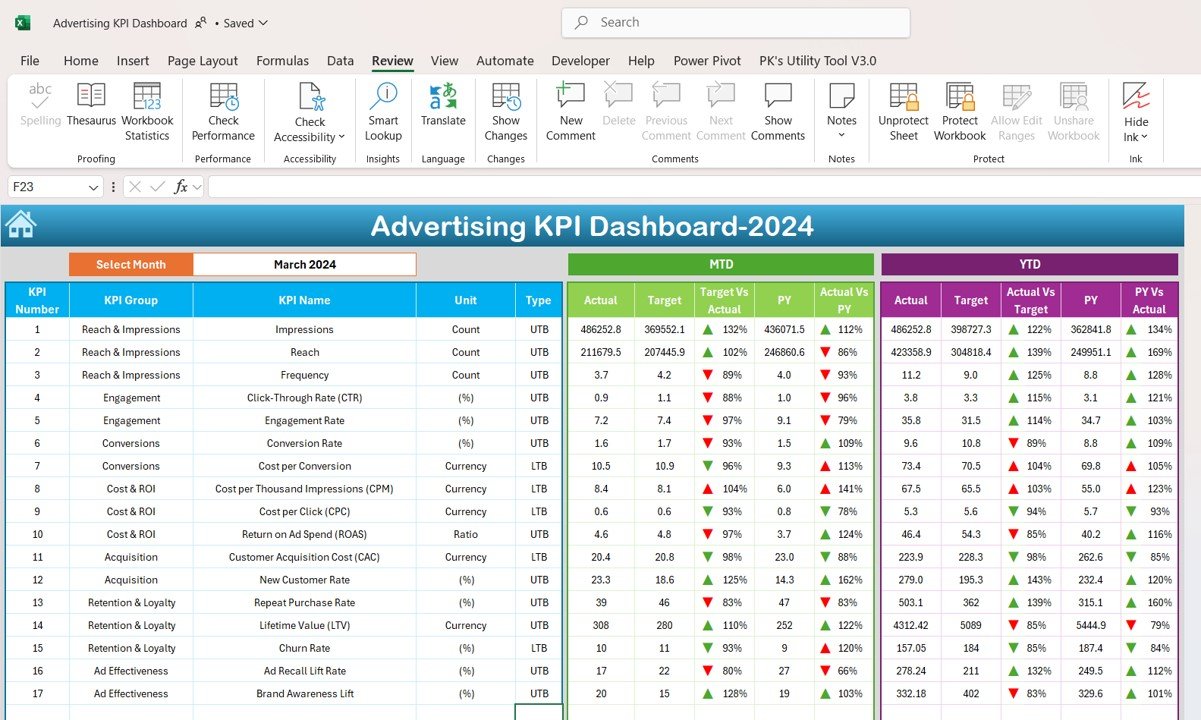
🎯 Goal Setting and Performance Comparison
Set specific advertising targets for each KPI and compare actual performance against these goals, ensuring your advertising campaigns are on track and aligned with your overall business objectives.
🛠 Customizable Inputs
Easily input data such as ad spend, impressions, clicks, and conversions into the provided fields, while customizing the dashboard to suit your specific advertising strategy and goals.
🔔 Conditional Formatting Alerts
Get real-time alerts with color-coded indicators to highlight underperforming areas of your campaigns, such as high CPC, low CTR, or unprofitable ads.
💼 Advertising Insights
Gain insights into ad performance, budget allocation, and audience targeting, helping you make informed decisions to optimize your advertising efforts.
🚀 Why You’ll Love the Advertising KPI Dashboard in Excel:
✅ Optimize Advertising Spend – Track ad spend efficiency and ROI across different platforms to ensure your budget is being used effectively.
✅ Improve Campaign Performance – Measure impressions, clicks, and conversions to optimize your advertising strategies and improve engagement.
✅ Maximize Return on Ad Spend (ROAS) – Track how much revenue you’re generating from each advertising dollar spent, allowing you to optimize for higher returns.
✅ Increase Conversion Rates – Identify trends and patterns that help you increase conversions and meet sales or lead generation targets.
✅ User-Friendly Interface – The dashboard is designed for ease of use, allowing marketing teams to input data and track performance without needing technical expertise.
✅ Fully Customizable – Tailor the dashboard to suit your business’s advertising needs, whether you are running Google Ads, Facebook Ads, or traditional media campaigns.
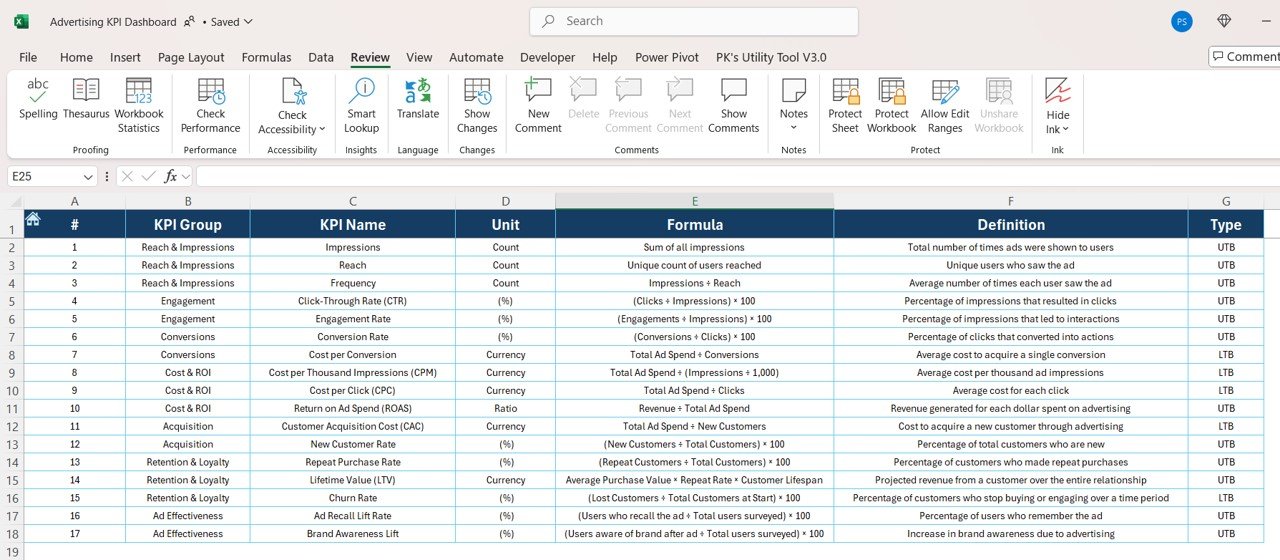
What’s Inside the Advertising KPI Dashboard in Excel:
- Impressions KPI: Track the number of times your ads are shown to your target audience, helping to measure brand awareness and reach.
- Clicks KPI: Measure the number of clicks your ads receive, showing the level of audience engagement and interest.
- Conversions KPI: Track the number of conversions generated by your ads, helping to measure how well your ads are driving business goals such as sales or leads.
- Click-Through Rate (CTR) KPI: Monitor the click-through rate to gauge the effectiveness of your ads in driving user action.
- Cost-Per-Click (CPC) KPI: Measure the cost of each click on your ad to ensure that you’re getting good value from your advertising spend.
- Return on Ad Spend (ROAS) KPI: Track the revenue generated by your ads compared to the cost, helping to ensure profitability and the success of your campaigns.
- Ad Performance by Platform: Compare performance metrics across different advertising platforms such as Google Ads, Facebook Ads, and Instagram.
How to Use the Advertising KPI Dashboard in Excel:
1️⃣ Download the Template – Instantly access your Excel file upon purchase.
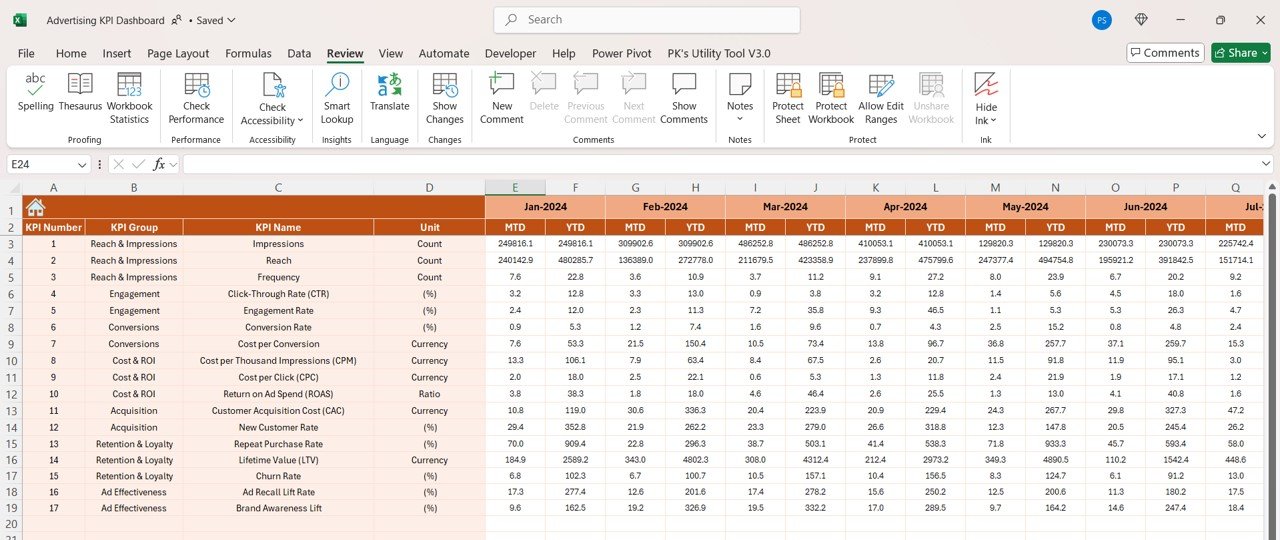
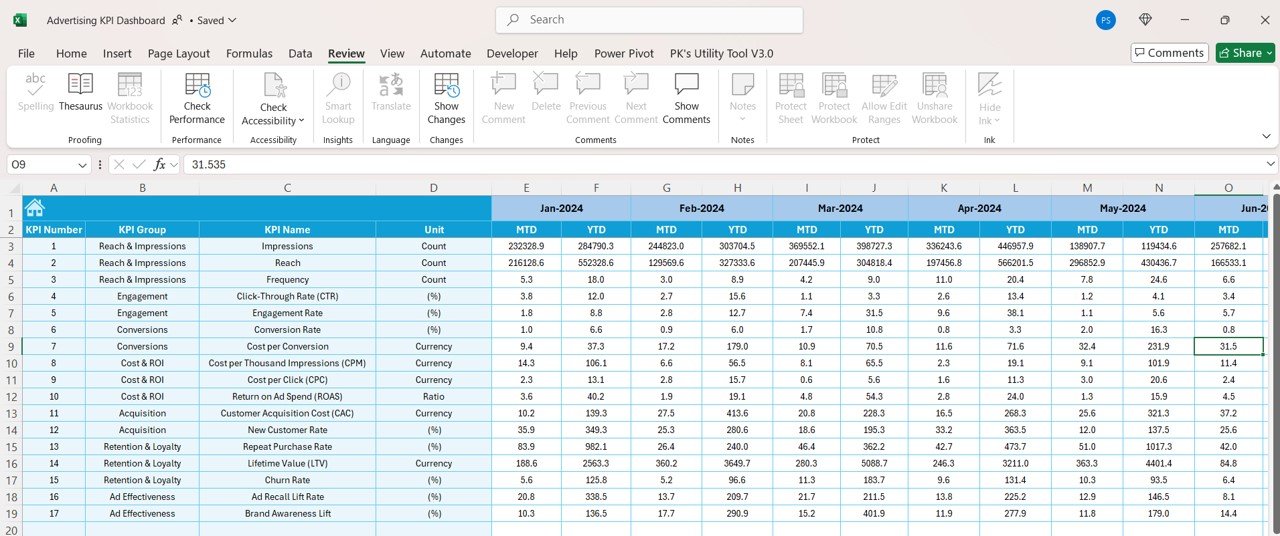
2️⃣ Input Your Advertising Data – Enter your ad spend, impressions, clicks, conversions, and other data into the provided fields.
3️⃣ Set Advertising Goals – Define your advertising targets for each KPI to guide your campaign optimization efforts.
4️⃣ Monitor Performance – Track real-time performance across all KPIs and make necessary adjustments to your advertising strategies.
5️⃣ Generate Reports – Use the dashboard to generate comprehensive advertising reports for internal reviews, management meetings, or client presentations.
Who Can Benefit from the Advertising KPI Dashboard in Excel:
- Digital Marketers
- Advertising Agencies
- Marketing Managers
- Business Owners
- Social Media Managers
- Paid Ads Managers
- Marketing Analysts
- Entrepreneurs
The Advertising KPI Dashboard in Excel is the ideal solution for businesses and marketing professionals looking to optimize their advertising efforts, track key metrics, and improve ROI.
Click here to read the Detailed blog post
https://www.pk-anexcelexpert.com/advertising-kpi-dashboard-in-excel/
Visit our YouTube channel to learn step-by-step video tutorials
Youtube.com/@PKAnExcelExpert


Reviews
There are no reviews yet.