Adventure tourism is expanding rapidly across the globe 🌄. Travelers now actively seek trekking expeditions, rafting adventures, wildlife safaris, mountain biking trails, scuba diving experiences, and high-adrenaline activities. However, as demand rises, competition intensifies. Therefore, tour operators must monitor bookings, revenue, safety performance, occupancy levels, and customer satisfaction in real time.
If performance tracking remains manual, opportunities slip away.
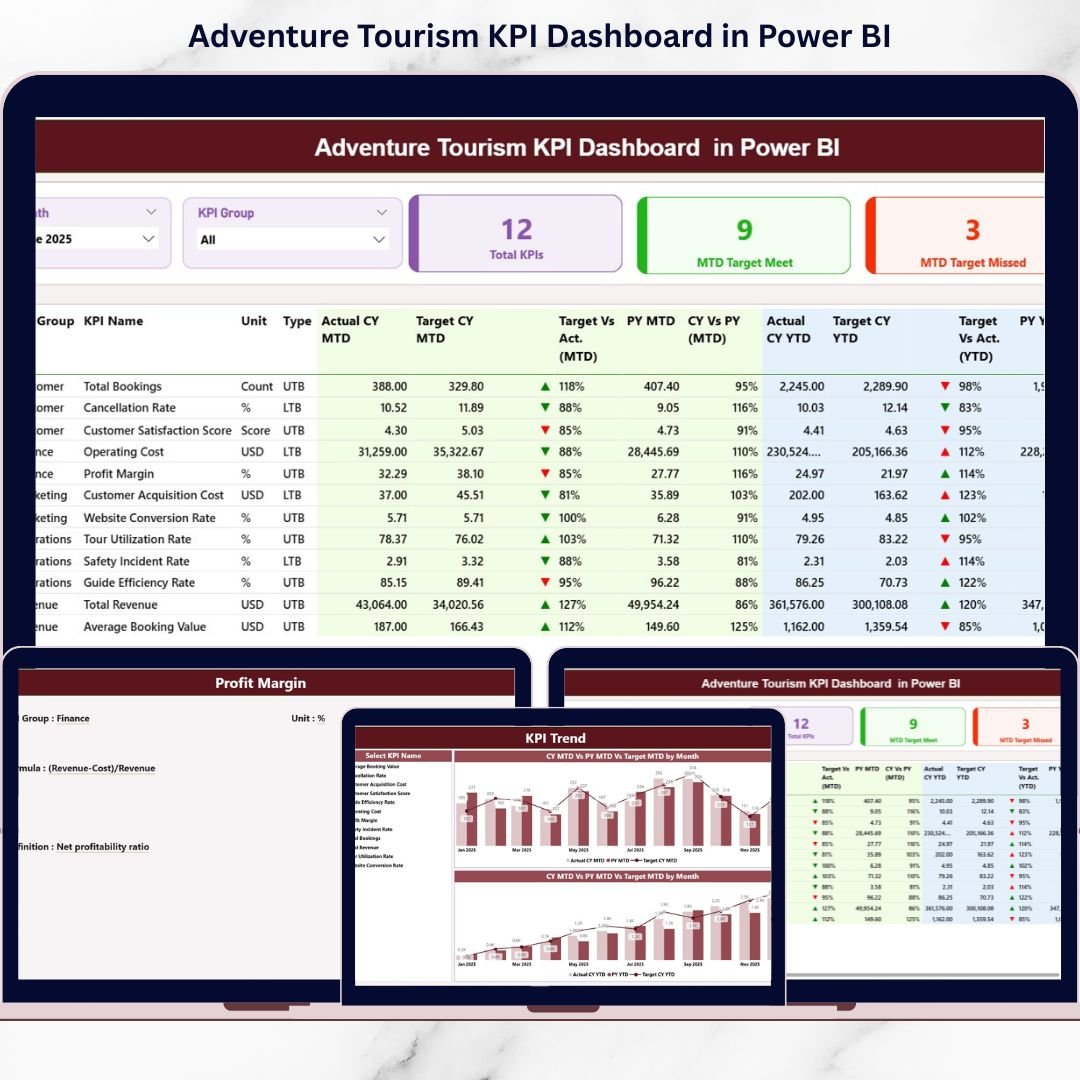
That is exactly where the Adventure Tourism KPI Dashboard in Power BI becomes a powerful and professional solution.
The Adventure Tourism KPI Dashboard in Power BI is a ready-to-use, interactive analytics system designed specifically for adventure tourism businesses. Instead of juggling multiple spreadsheets, you can centralize performance monitoring, track Month-to-Date (MTD) and Year-to-Date (YTD) metrics, compare Actual vs Target, and evaluate Previous Year growth — all in one dynamic dashboard 📊.
Because this dashboard connects seamlessly to Excel data, you maintain flexibility in data entry while enjoying the powerful visualization and drill-through features of Power BI. As a result, managers gain instant visibility and make faster, data-driven decisions.
✅ Key Feature of Adventure Tourism KPI Dashboard in Power BI
This dashboard transforms raw operational data into executive-ready insights 🚀.
Key features include:
📊 Interactive Summary Page – View all KPIs in one structured layout.
🎯 MTD & YTD Performance Tracking – Monitor short-term and long-term performance side by side.
🔺🔻 Target Status Indicators – Instantly identify target met and missed KPIs.
📈 Dynamic Trend Charts – Analyze performance patterns visually.
📂 Drill-Through KPI Definitions – Understand formulas and logic clearly.
🔍 KPI Group Filtering – Filter KPIs by financial, operational, safety, or marketing categories.
⚡ Excel-Connected Data Model – Update Excel; Power BI handles the analytics automatically.
Because visuals update instantly after refresh, decision-making becomes proactive instead of reactive.
📦 What’s Inside the Adventure Tourism KPI Dashboard in Power BI
This solution includes 3 professionally designed Power BI pages supported by a structured Excel data source.
1️⃣ Summary Page – Performance Control Center
The Summary Page acts as the main dashboard view 🧭.
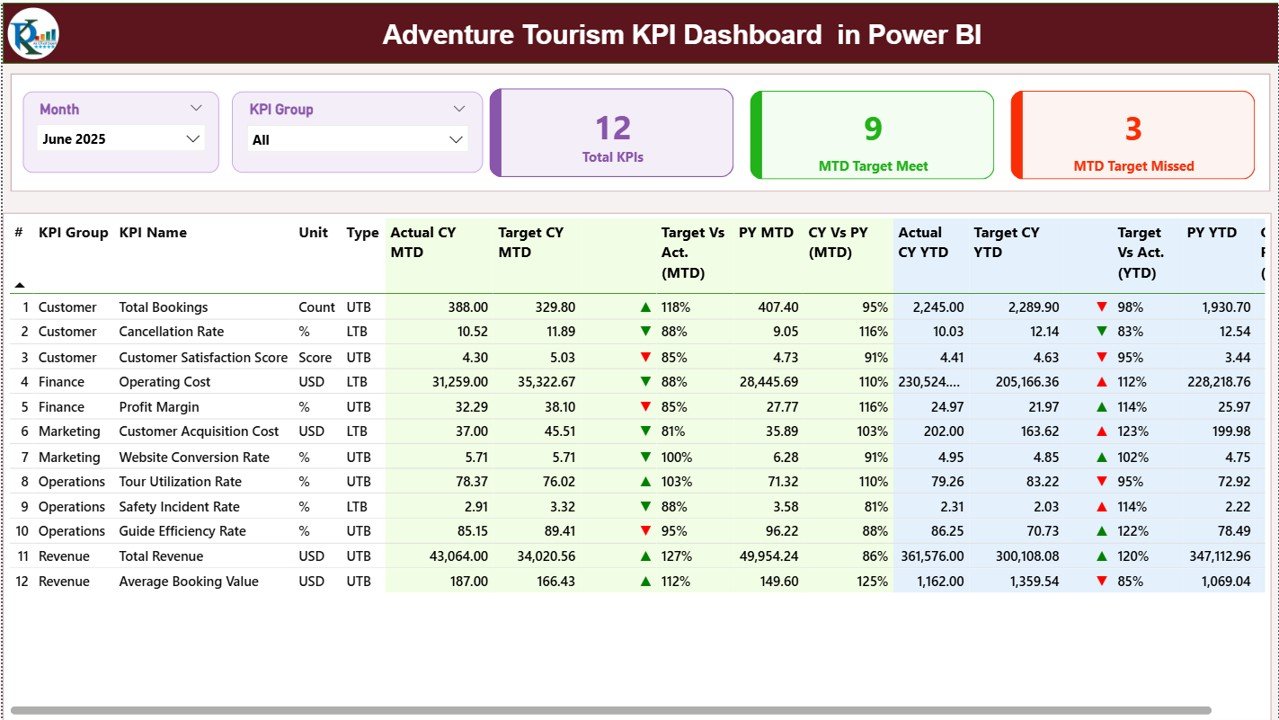
Top Slicers
-
Month slicer
-
KPI Group slicer
Selecting filters updates the entire dashboard instantly.
KPI Cards
-
Total KPIs Count
-
MTD Target Meet Count
-
MTD Target Missed Count
These cards provide a quick performance snapshot.
Detailed KPI Table
Includes:
-
KPI Number
-
KPI Group
-
KPI Name
-
Unit
-
Type (LTB / UTB)
MTD Section
-
Actual CY MTD
-
Target CY MTD
-
MTD Icon (▲ Green / ▼ Red)
-
Target vs Actual (MTD %)
-
PY MTD
-
CY vs PY (MTD %)
YTD Section
-
Actual CY YTD
-
Target CY YTD
-
YTD Icon
-
Target vs Actual (YTD %)
-
PY YTD
-
CY vs PY (YTD %)
This structure provides a complete monthly and yearly performance overview in one screen.
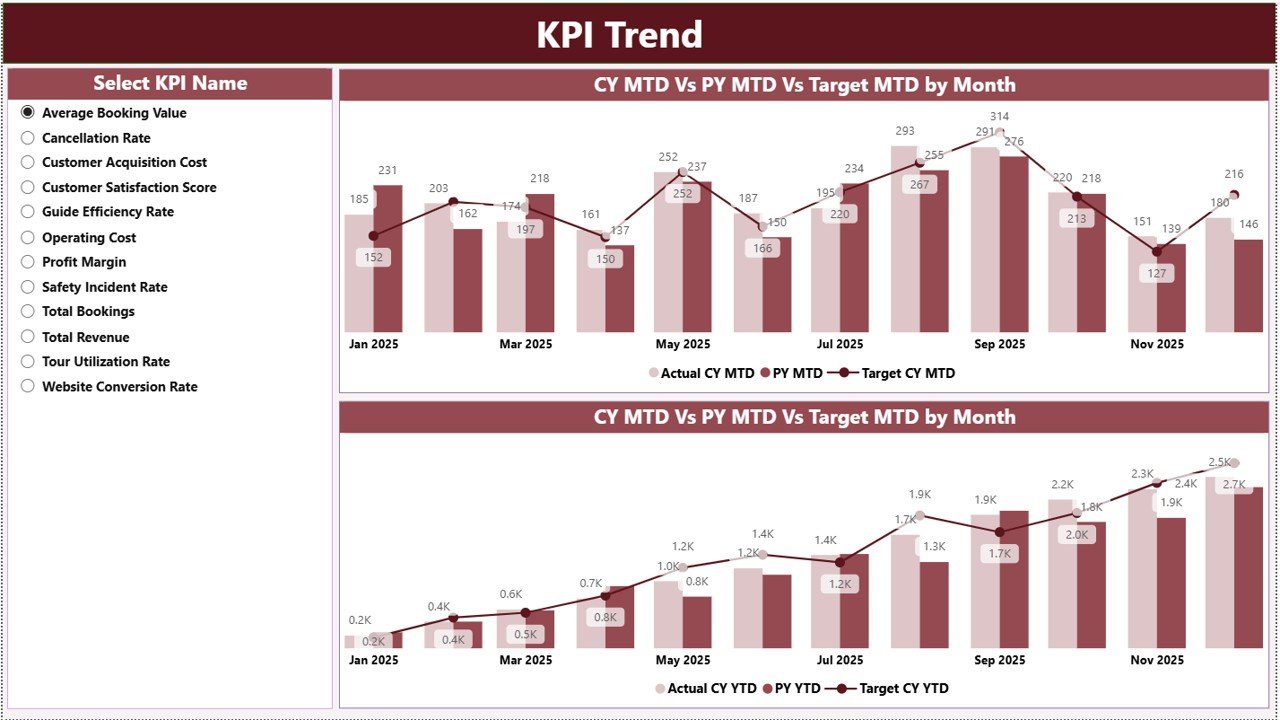
2️⃣ KPI Trend Page – Visual Growth Analysis
The KPI Trend Page focuses on trend and seasonal performance 📈.
KPI Selection
A slicer on the left allows you to select a KPI instantly.
Charts Displayed
-
MTD Trend Chart (Actual vs Target vs Previous Year)
-
YTD Trend Chart (Actual vs Target vs Previous Year)
These visuals help managers:
-
Detect seasonal dips
-
Identify revenue growth patterns
-
Compare target achievement visually
-
Spot operational inefficiencies early
Because trends matter more than single-month results, this page supports strategic planning.
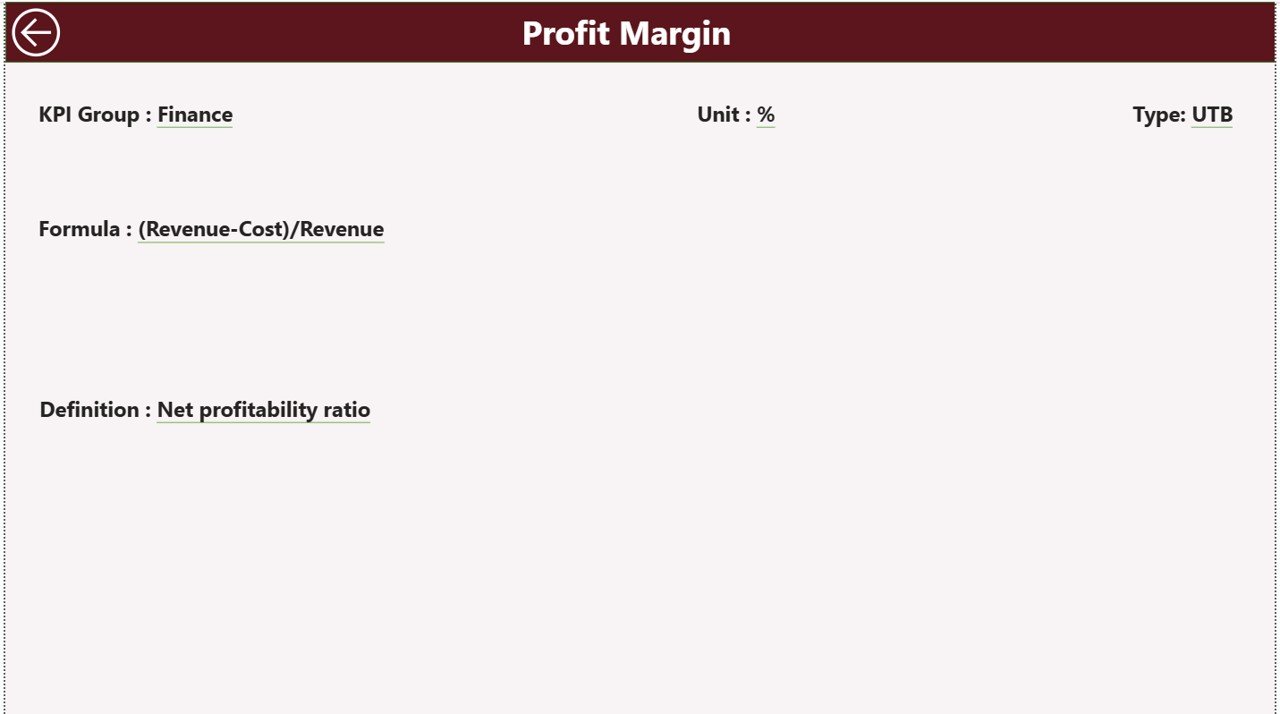
3️⃣ KPI Definition Page – Drill-Through Clarity
The KPI Definition Page remains hidden to keep the dashboard clean.
From the Summary Page, right-click any KPI and select Drill Through.
This page displays:
-
KPI Formula
-
KPI Definition
-
KPI Type (LTB / UTB)
-
Unit of measurement
This ensures clarity, consistency, and audit-readiness.
🛠️ How to Use the Adventure Tourism KPI Dashboard in Power BI
Using the dashboard is straightforward 👍:
-
Enter actual data in the Input Actual Excel sheet.
-
Enter target data in the Input Target sheet.
-
Maintain KPI details in the KPI Definition sheet.
-
Refresh Power BI.
-
Use slicers to analyze performance by month or KPI group.
-
Drill into trends and definitions when required.
Because Power BI automates calculations and visuals, you only focus on analysis.
👥 Who Can Benefit from This Adventure Tourism KPI Dashboard
This dashboard is perfect for:
🏕️ Adventure Tour Operators
🧗 Operations Managers
💰 Finance & Revenue Teams
🛟 Safety Compliance Managers
📊 Business Analysts
📈 Strategy & Growth Teams
It works for both growing startups and large adventure tourism enterprises.
🔗 Click here to read the Detailed blog post
🎥 Visit our YouTube channel to learn step-by-step video tutorials
👉 https://www.youtube.com/@PKAnExcelExpert


