


OSHA compliance Excel tracking becomes much easier when safety leaders stop treating incident reports, near-miss logs, training follow-up, and KPI reviews as separate jobs. For many US employers, the painful part is not knowing what to track; it is keeping the data organized enough to spot repeat hazards before they become recordable injuries, downtime, penalties, or claim costs.
Dedicated safety software can help, but it can also add subscription cost before a small team is ready for a full platform. For example, SafetyCulture pricing lists Premium at $24 per seat per month on annual billing, or $29 per seat per month on monthly billing, while the templates in this roundup are one-time tools from $6.99 to $14.99, all below the common $17.99 template benchmark. This guide compares six NextGenTemplates safety and incident management templates for employers that want a practical incident tracker, safety management dashboard, root cause follow-up process, and KPI view without starting from a blank spreadsheet.
Quick Comparison: 6 OSHA Compliance Excel and Safety Templates
| Template | Format | Best For | Price |
|---|---|---|---|
| Incident Response and Downtime Analysis Dashboard in Google Sheets | Google Sheets | Incident response review, downtime tracking, recovery time analysis, root cause patterns | $6.99 |
| Cybersecurity Incident KPI Dashboard in Google Sheets | Google Sheets | Security incident KPIs, threat trends, response performance, collaborative reporting | $9.99 |
| Road Safety Services KPI Dashboard in Excel | Excel | Fleet, traffic, transportation, road safety programs, public safety KPIs | $14.99 |
| Cyber Incident Response KPI Scorecard In Excel | Excel | SOC metrics, cyber incident response scorecards, leadership-ready security reporting | $14.99 |
| Warehouse Safety KPI Dashboard in Google Sheets | Google Sheets | Warehouse incident tracker, near-miss reporting, PPE, forklift, audit and training KPIs | $9.99 |
| Construction Safety KPI Scorecard in Excel | Excel | Construction site safety, TRIR, LTIFR, safety training, corrective action closure | $14.99 |
 Launch offer
SUMIFS, XLOOKUP, FILTER, LAMBDA and checking AI-written formulas, with real business projects. 11h 47m of video by PK, with practice files, quizzes and a capstone.
Why Safety Incident Tracking Matters for US Employers
Safety templates do not replace legal advice, OSHA recordkeeping judgment, or a full safety program. They do, however, make the day-to-day work of recording, reviewing, and acting on safety data more consistent. That matters because the numbers behind workplace safety are still large, even when the trend is improving.
- 2.5 million nonfatal workplace cases were reported in private industry in 2024. The Bureau of Labor Statistics reported 2.488 million nonfatal workplace injuries and illnesses in private industry, with a total recordable case rate of 2.3 per 100 full-time equivalent workers.
- 5,070 fatal work injuries were recorded in the United States in 2024. The BLS Census of Fatal Occupational Injuries also reported a fatal work injury rate of 3.3 per 100,000 full-time equivalent workers.
- OSHA penalty exposure can be material. OSHA lists maximum penalties after January 15, 2026 of $16,550 per serious, other-than-serious, or posting violation, and $165,514 per willful or repeated violation on its penalties page.
- Covered establishments face electronic reporting deadlines. OSHA’s Injury Tracking Application page notes that 2025 injury and illness data were due March 2, 2026, and establishments that missed the deadline still had to submit.
- Excel-style records can fit recordkeeping workflows when requirements are met. OSHA’s recordkeeping forms page says equivalent forms may be maintained in file formats such as Excel or CSV if they meet the required criteria.
The takeaway is simple: a safety management spreadsheet should not only store rows. It should help a manager see incident frequency, near-miss themes, training gaps, corrective action delays, downtime cost, and repeat root causes fast enough to act.
The 6 Incident Tracker and Safety Management Templates
1. Incident Response and Downtime Analysis Dashboard in Google Sheets
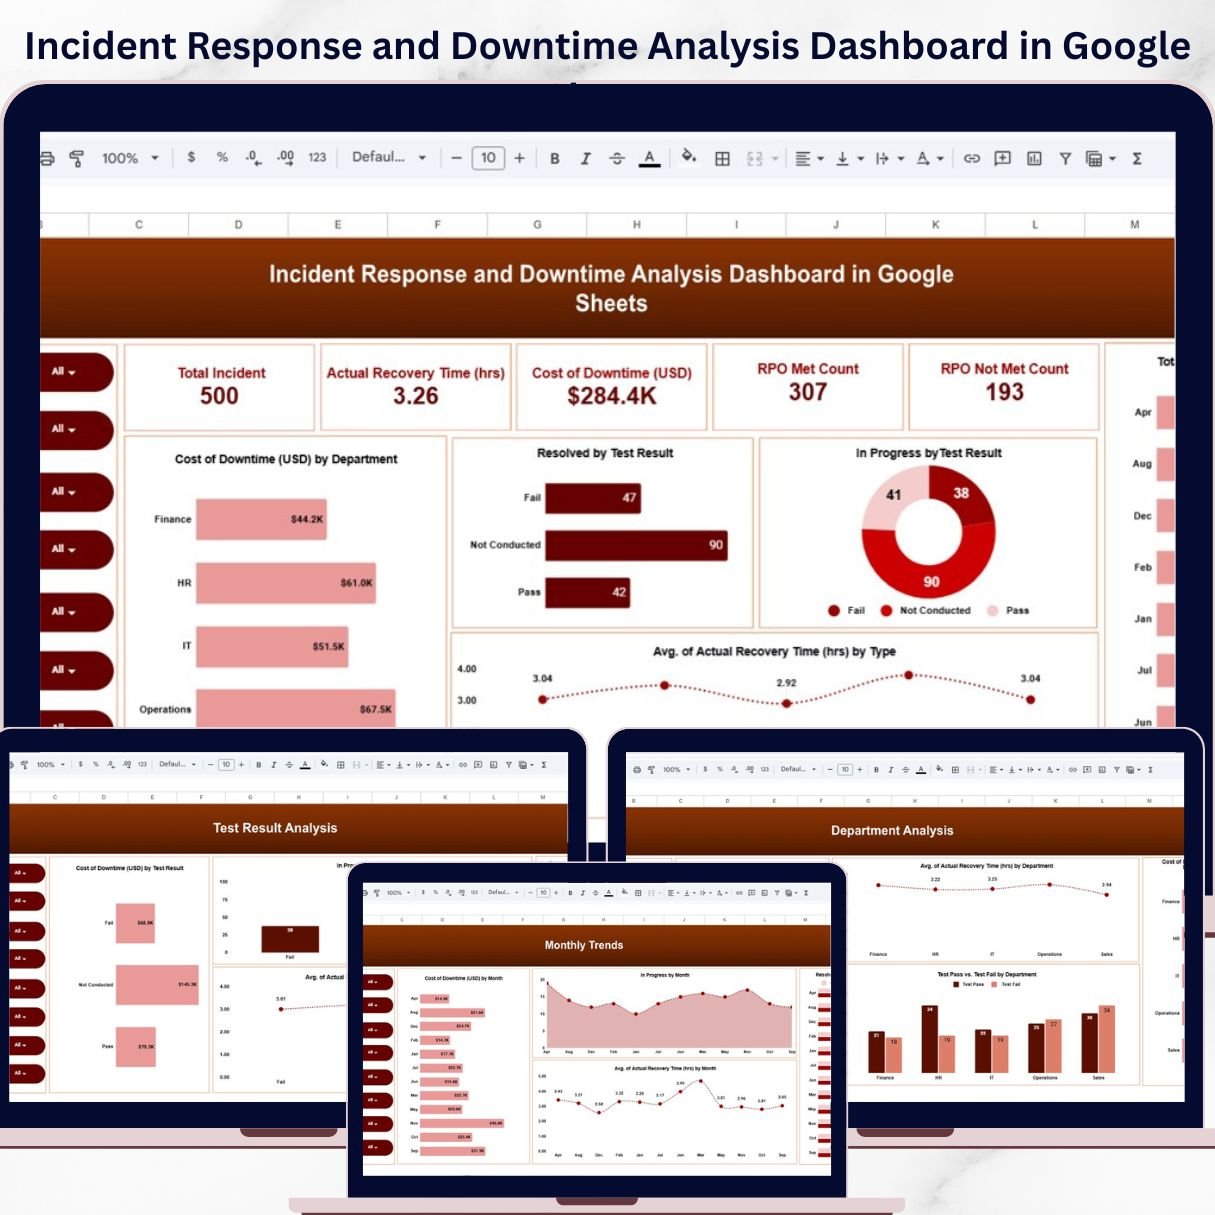
The Incident Response and Downtime Analysis Dashboard in Google Sheets is the best first pick when your main problem is scattered incident notes, slow follow-up, and poor visibility into downtime. Although it is built in Google Sheets rather than Excel, it supports the same management idea: centralize incident data, measure response performance, and use the numbers to improve the process. For safety teams, this can become a practical incident tracker for events that affect operations, equipment, departments, or service continuity.
Screenshot notes: the dashboard view is designed around total incidents, average recovery time, downtime cost, incident type analysis, department analysis, monthly trends, and RPO-style performance indicators. That makes it useful when incident response is not only about documenting what happened, but also about understanding how long recovery took and where the cost came from.
- Track incident report volume by type, department, and month.
- Review downtime cost and recovery time after equipment, system, or operational failures.
- Identify root cause themes before the same failure keeps repeating.
- Share response metrics with operations leaders in a live Google Sheets file.
Price: $6.99. View the Incident Response and Downtime Analysis Dashboard.
2. Cybersecurity Incident KPI Dashboard in Google Sheets
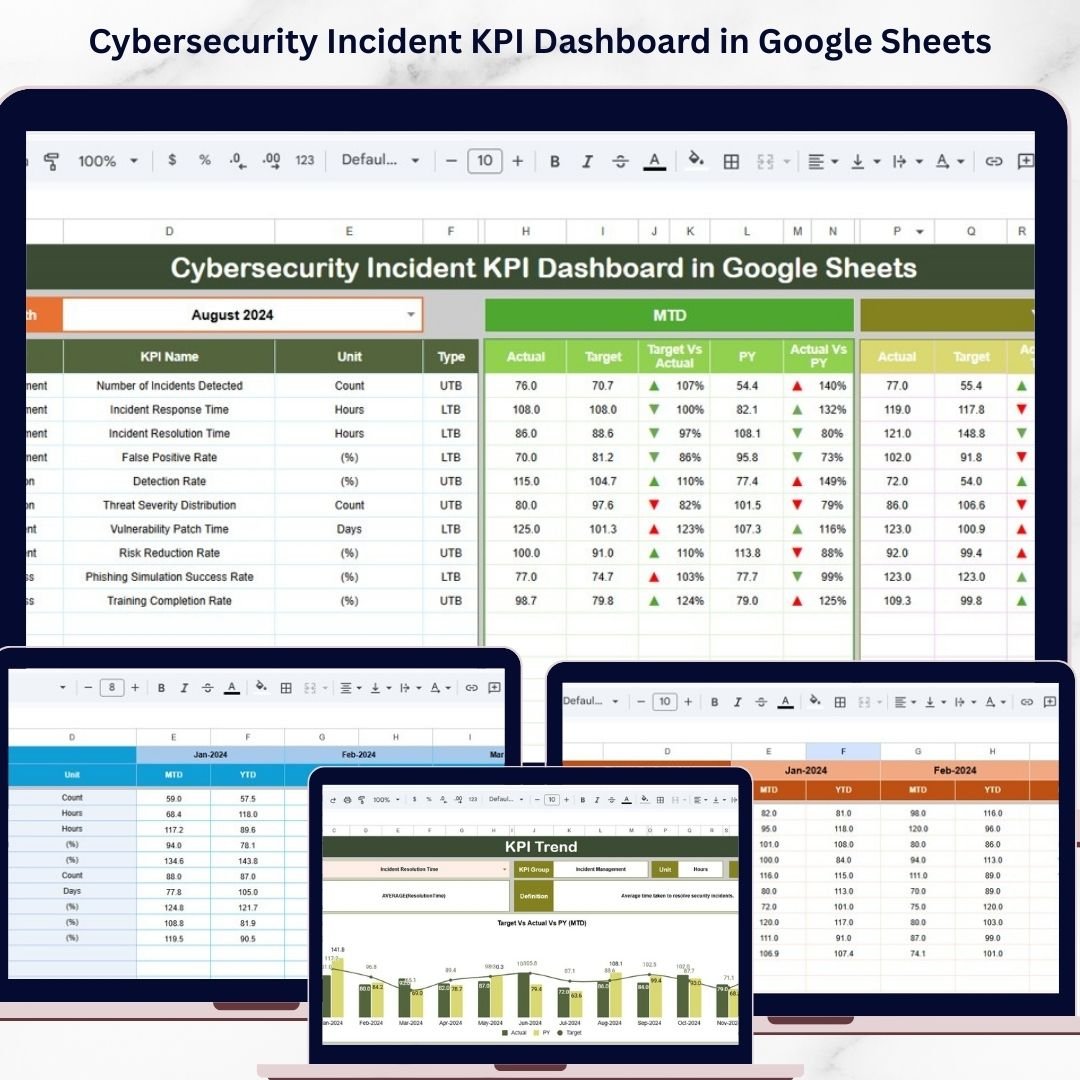
The Cybersecurity Incident KPI Dashboard in Google Sheets is built for teams that need security incident visibility without building a custom reporting model. It fits employers that treat cyber incidents as part of operational risk: phishing, malware, access issues, response delays, unresolved vulnerabilities, and recurring threat patterns. While this is not an OSHA injury log, it is valuable in the broader incident management stack because cyber incidents can create downtime, privacy exposure, lost productivity, and leadership reporting pressure.
Screenshot notes: the dashboard includes cybersecurity KPI monitoring, dynamic monthly analysis, MTD and YTD performance, actual vs target comparison, previous-year comparison, trend indicators, a KPI trend sheet, actual number inputs, target inputs, previous-year data, and KPI definitions. That structure helps a security leader keep response performance measurable instead of relying on after-action meeting notes.
- Monitor cyber incident response KPIs by month.
- Compare actual response performance against targets.
- Track threat trends for leadership, IT, and risk review meetings.
- Use a shared Google Sheets dashboard for security team updates.
Price: $9.99. View the Cybersecurity Incident KPI Dashboard.
3. Road Safety Services KPI Dashboard in Excel
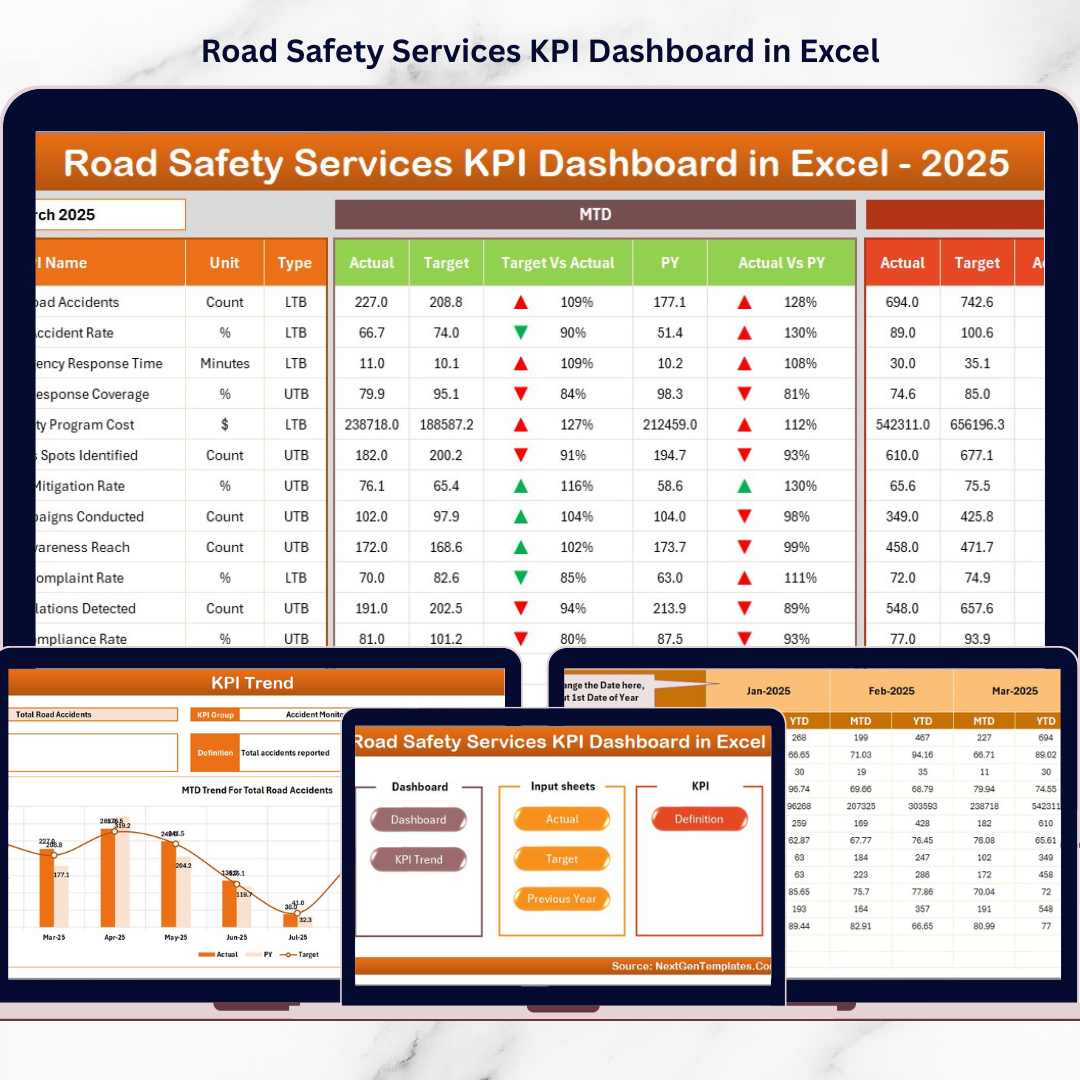
The Road Safety Services KPI Dashboard in Excel is a stronger fit for transportation departments, fleet programs, public works teams, road safety agencies, and contractors responsible for vehicle or traffic safety performance. If your safety management work includes accidents, inspections, violations, emergency response, road incidents, or recurring route risk, this Excel dashboard gives you a structured way to turn field data into KPI review material.
Screenshot notes: the product includes a Home sheet, Dashboard sheet, KPI Trend sheet, Actual Numbers Input sheet, Target sheet, Previous Year Numbers sheet, and KPI Definition sheet. The main dashboard supports MTD and YTD tracking, target vs actual review, previous-year benchmarking, conditional formatting indicators, and month selection. This is useful for employers that need a repeatable monthly scorecard rather than one-off safety reports.
- Track road safety KPIs for fleets, drivers, contractors, or field teams.
- Compare accidents, inspections, and response metrics against targets.
- Use trend charts to spot recurring high-risk routes or time periods.
- Prepare monthly safety management updates for operations leaders.
Price: $14.99. View the Road Safety Services KPI Dashboard in Excel.
Mid-post CTA: Build a starter safety reporting stack. If you want one operational incident tracker plus one workplace safety scorecard, pair the Incident Response and Downtime Analysis Dashboard with either the Warehouse Safety KPI Dashboard or the Construction Safety KPI Scorecard. That gives you both event-level incident review and KPI-level safety management.
4. Cyber Incident Response KPI Scorecard In Excel
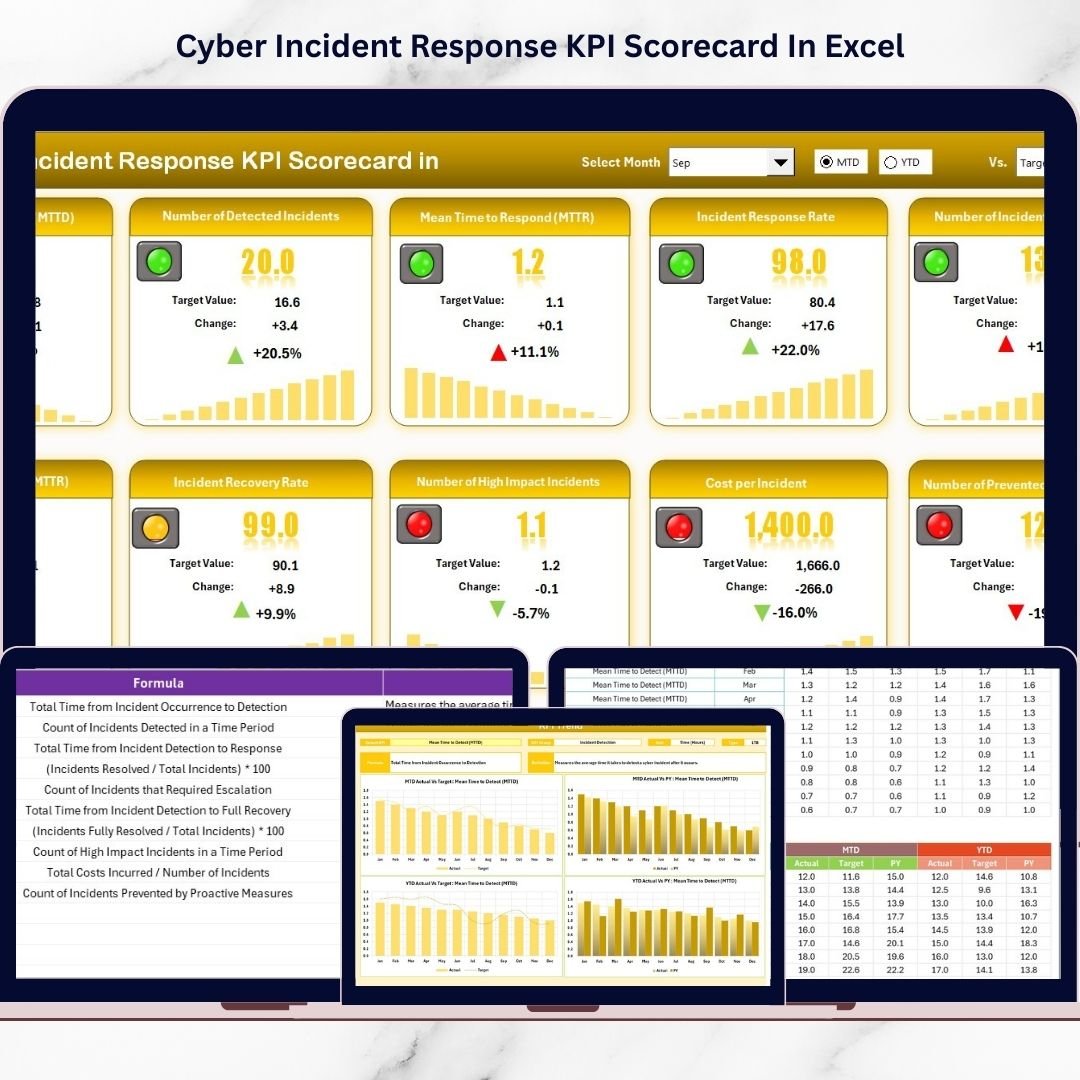
The Cyber Incident Response KPI Scorecard In Excel is the Excel-based alternative for employers that prefer files stored on a local drive, shared folder, SharePoint, or controlled internal workflow. It is designed for SOC teams, IT managers, risk leaders, compliance teams, and executives who need a simple scorecard for security incident response. If Google Sheets is not the right environment for your company, this is the cleaner Excel option.
Screenshot notes: the scorecard includes a centralized KPI view, MTD and YTD analysis, actual vs target comparison, dynamic trend charts, color-coded performance indicators, automated dashboard updates, and KPI definition standardization. That makes it helpful for turning incident response into a measurable process with defined targets, formulas, and units rather than loose status updates.
- Track cyber incident response performance for SOC and IT security teams.
- Measure response, containment, resolution, and improvement KPIs.
- Prepare executive-ready security performance scorecards in Excel.
- Document KPI definitions so teams agree on how each metric is calculated.
Price: $14.99. View the Cyber Incident Response KPI Scorecard.
5. Warehouse Safety KPI Dashboard in Google Sheets
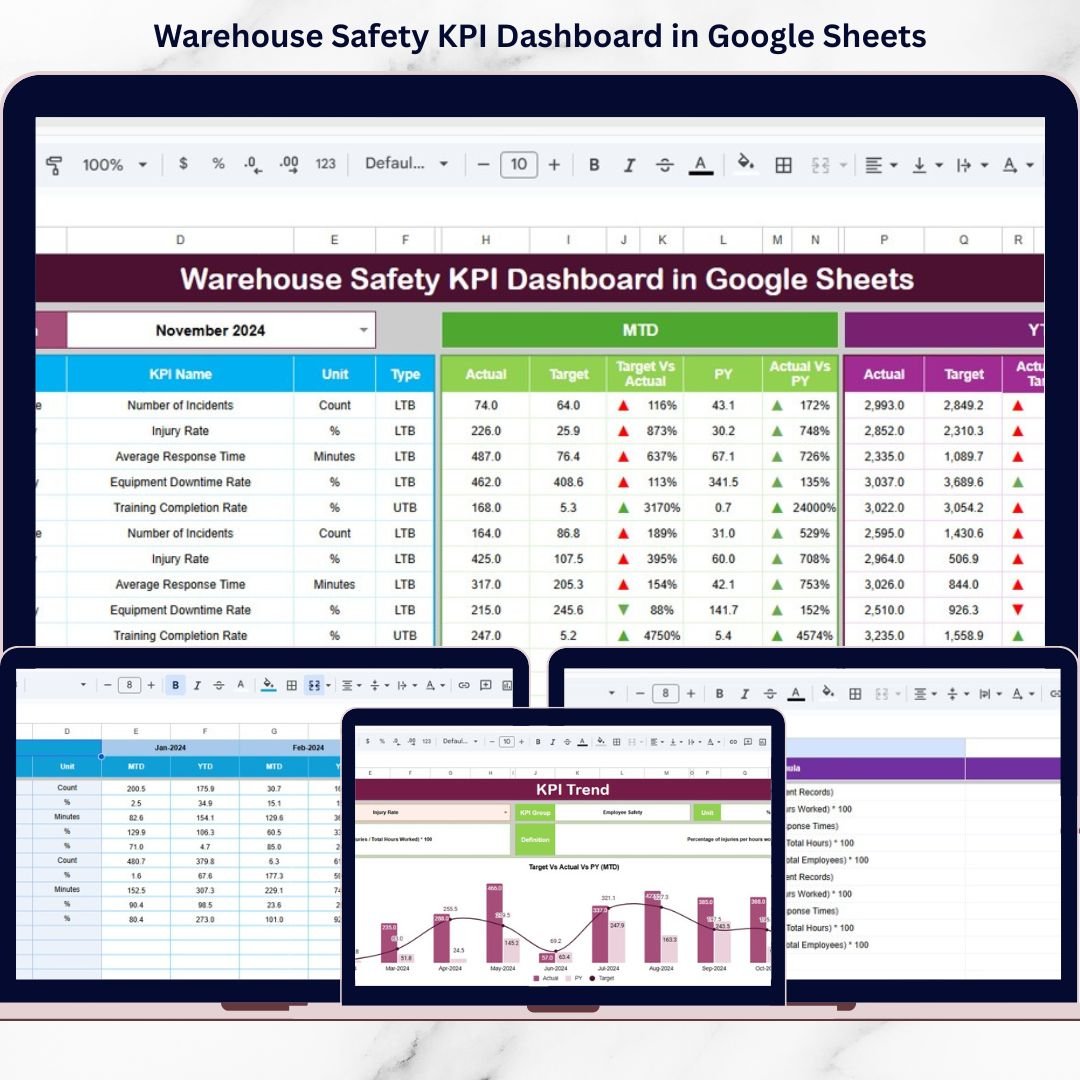
The Warehouse Safety KPI Dashboard in Google Sheets is the most directly relevant option for employers that need a live safety management dashboard for warehouses, distribution centers, logistics operations, or multi-location facilities. Warehouses often need to monitor near misses, forklift incidents, PPE compliance, fire safety checks, equipment inspections, training hours, and incident rates in one place. This template gives teams a practical way to move beyond a simple incident tracker and into monthly safety performance management.
Screenshot notes: the template includes a Dashboard sheet, KPI Trend sheet, Actual Number sheet, Target sheet, Previous Year Number sheet, and KPI Definition sheet. The product description specifically supports KPIs such as Total Recordable Incident Rate, Lost Time Injury Frequency Rate, near-miss reports, safety training hours, equipment inspection compliance, forklift incident rate, fire safety compliance, and PPE compliance.
- Track near-miss logs and safety incidents in a collaborative sheet.
- Monitor PPE, forklift, equipment, inspection, and training KPIs.
- Compare current performance against targets and previous-year results.
- Prepare audit-ready safety management summaries for warehouse leaders.
Price: $9.99. View the Warehouse Safety KPI Dashboard.
6. Construction Safety KPI Scorecard in Excel
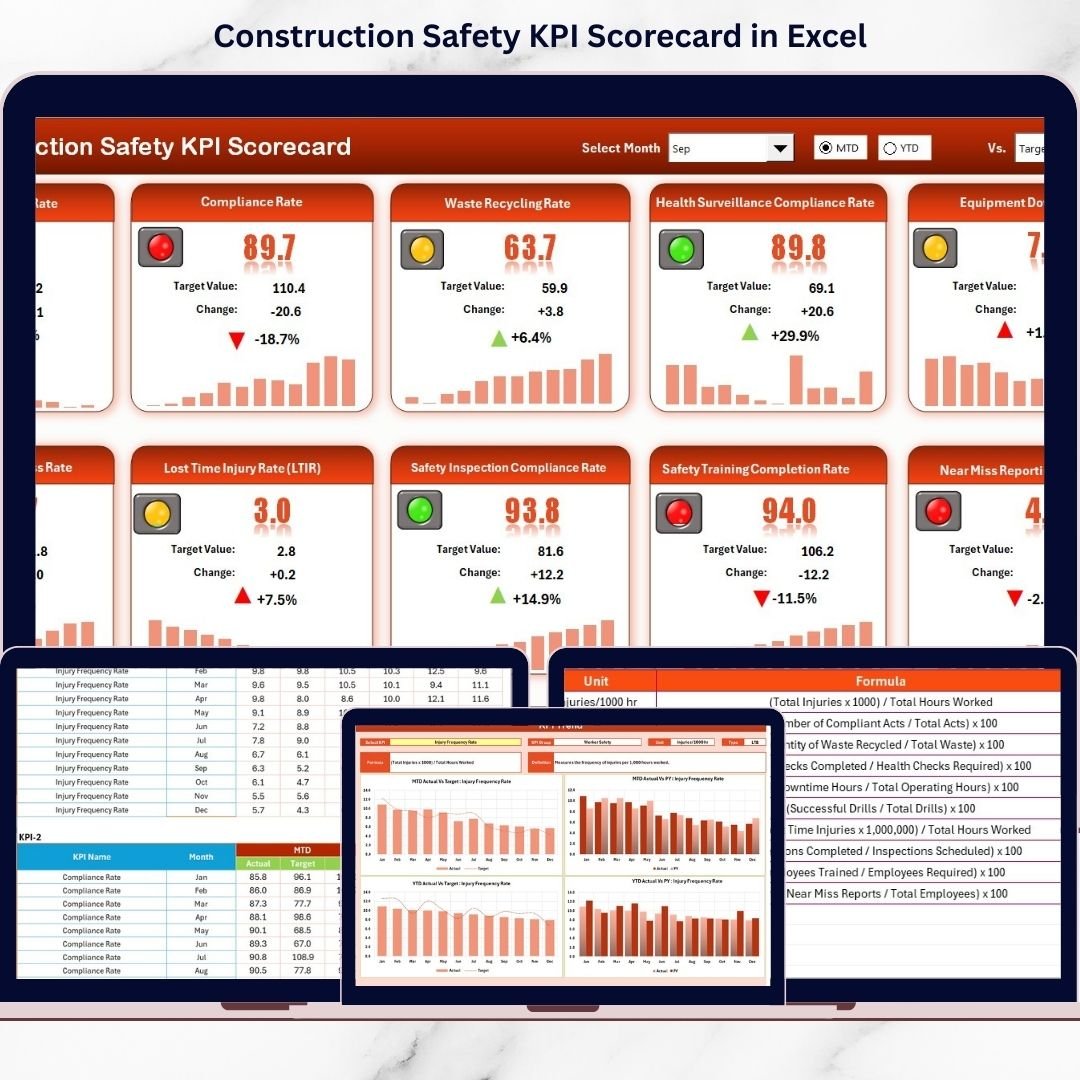
The Construction Safety KPI Scorecard in Excel is built for contractors, site supervisors, safety officers, civil projects, infrastructure firms, and compliance teams that need to monitor site safety in Excel. Construction safety tracking has a different rhythm from office-based incident management. Teams need to watch training completion, PPE compliance, safety audit scores, TRIR, LTIFR, corrective actions, and near misses across active job sites where risks change quickly.
Screenshot notes: the scorecard includes an interactive safety dashboard, month selection, MTD and YTD tracking, actual vs target vs previous-year comparison, visual safety indicators, a KPI Trend sheet, structured data entry, and KPI definition standardization. It is especially useful for safety meetings because the dashboard converts raw site data into a clearer monthly scorecard.
- Track construction incident rates, training hours, and audit performance.
- Monitor TRIR, LTIFR, near-miss reports, PPE compliance, and corrective action closure.
- Compare job-site safety targets against actual monthly results.
- Build repeatable safety scorecards for owners, project managers, and field leaders.
Price: $14.99. View the Construction Safety KPI Scorecard in Excel.
How to Choose the Right OSHA Compliance Excel Template
The right safety management template depends on the work environment, reporting owner, and the level of detail you need. Use this decision framework before buying:
- Choose Google Sheets when multiple people update the file. The Warehouse Safety KPI Dashboard, Cybersecurity Incident KPI Dashboard, and Incident Response and Downtime Analysis Dashboard are better when managers, analysts, and supervisors need shared access.
- Choose Excel when you need controlled local files. The Construction Safety KPI Scorecard, Road Safety Services KPI Dashboard, and Cyber Incident Response KPI Scorecard fit teams that prefer Excel workbooks, local storage, or formal monthly files.
- Choose by environment first. Warehouses need forklift, PPE, inspection, near-miss, and training metrics. Construction sites need TRIR, LTIFR, audits, corrective actions, and site safety scorecards. Road safety teams need driver, vehicle, traffic, route, and response KPIs.
- Choose by incident type second. Physical safety incidents call for warehouse, construction, or road safety templates. Cybersecurity incidents call for one of the cyber incident KPI templates. Mixed operational incidents call for the downtime analysis dashboard.
- Choose a KPI dashboard when leadership needs trends. If the manager only needs a basic log, a simple spreadsheet may work. If leadership asks what changed, which target was missed, and where risk is recurring, use a KPI dashboard or scorecard.
- Choose a root-cause-friendly template when incidents repeat. The downtime dashboard is especially useful when incident response, recovery time, department impact, and repeat patterns matter.
A practical safety stack for many employers is one incident-level tracker plus one KPI-level safety dashboard. For example, a warehouse team could use the Incident Response and Downtime Analysis Dashboard for event follow-up and the Warehouse Safety KPI Dashboard for monthly safety management.
OSHA Compliance Excel FAQs
What is an OSHA compliance Excel template?
An OSHA compliance Excel template is a spreadsheet-based tool used to organize safety records, incidents, near misses, training data, corrective actions, and KPI reviews. It does not guarantee compliance by itself, but it helps employers maintain cleaner safety management data.
Can I use Excel instead of OSHA Forms 300, 300A, and 301?
OSHA says equivalent forms may be maintained in formats such as Excel or CSV if they meet the required criteria. Employers should confirm that their records include the necessary OSHA recordkeeping details and follow posting, certification, and submission rules.
Which template is best for a warehouse incident tracker?
The Warehouse Safety KPI Dashboard in Google Sheets is the best fit for warehouse incident tracking because it focuses on near misses, incident rates, training hours, equipment inspections, forklift incidents, PPE, and safety compliance KPIs.
Which template is best for construction safety management?
The Construction Safety KPI Scorecard in Excel is the strongest choice for construction safety management because it includes site-focused KPIs such as TRIR, LTIFR, PPE compliance, safety audit scores, training hours, and corrective action closure.
Do these templates replace safety management software?
No. These templates are lower-cost spreadsheet tools for tracking and reporting. They are useful for small teams, early-stage safety programs, monthly KPI review, and structured reporting, but they do not replace a full EHS platform when you need mobile inspections, automated workflows, or enterprise integrations.
Can I track near misses in these templates?
Yes. The warehouse and construction templates are the best options for near-miss tracking because they include safety KPI structures that can monitor near-miss reports, risk trends, and preventive action. The incident response dashboard can also support broader near-miss or downtime event analysis.
Which template should I choose for root cause analysis?
The Incident Response and Downtime Analysis Dashboard is the best fit when root cause analysis, recovery time, downtime cost, incident type, department impact, and monthly patterns are the main reporting needs.
Are Google Sheets templates acceptable for safety management?
Google Sheets templates can be useful for internal safety management because multiple people can update the same file. For formal OSHA recordkeeping or submissions, employers should verify required fields, retention rules, certification, and any electronic reporting obligations.
What is the best low-cost starting point?
If you are not sure where to start, choose the $6.99 Incident Response and Downtime Analysis Dashboard for general incident response tracking, then add the industry-specific warehouse, construction, road safety, or cyber template that matches your work environment.
Build a Cleaner Safety Management Workflow
Closing CTA: Start with the template that matches your highest-risk workflow, then build from there. If you manage workplace safety, review the Warehouse Safety KPI Dashboard and Construction Safety KPI Scorecard. If your incidents are operational or cyber-related, compare the Incident Response and Downtime Analysis Dashboard, Cybersecurity Incident KPI Dashboard, and Cyber Incident Response KPI Scorecard.
Good safety management is not only about recording incidents after they happen. It is about making patterns visible: which locations repeat the same risk, which training topics are overdue, which corrective actions stay open, which incident types create downtime, and which KPIs are moving in the wrong direction. These six templates give US employers a practical way to make safety data easier to update, review, and discuss.
Built by PK – Microsoft Certified Professional with 15+ years of Excel, Google Sheets, and Power BI experience. Founder of NextGenTemplates, reaching 300K+ subscribers across YouTube channels. Every template is hand-built and tested before release.
For step-by-step dashboard and template tutorials, visit the NextGenTemplates YouTube channel.
Last updated: July 11, 2026.