

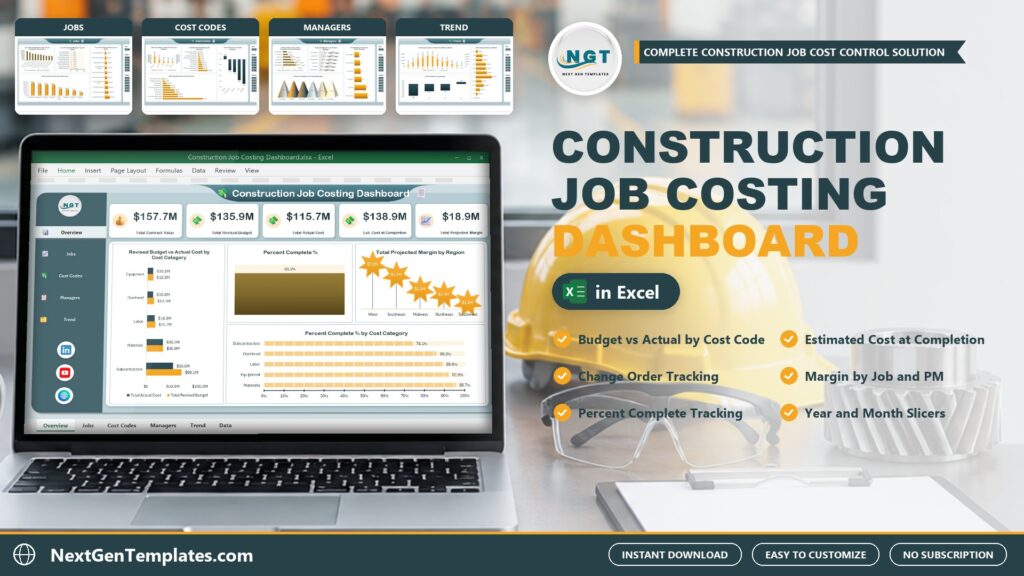
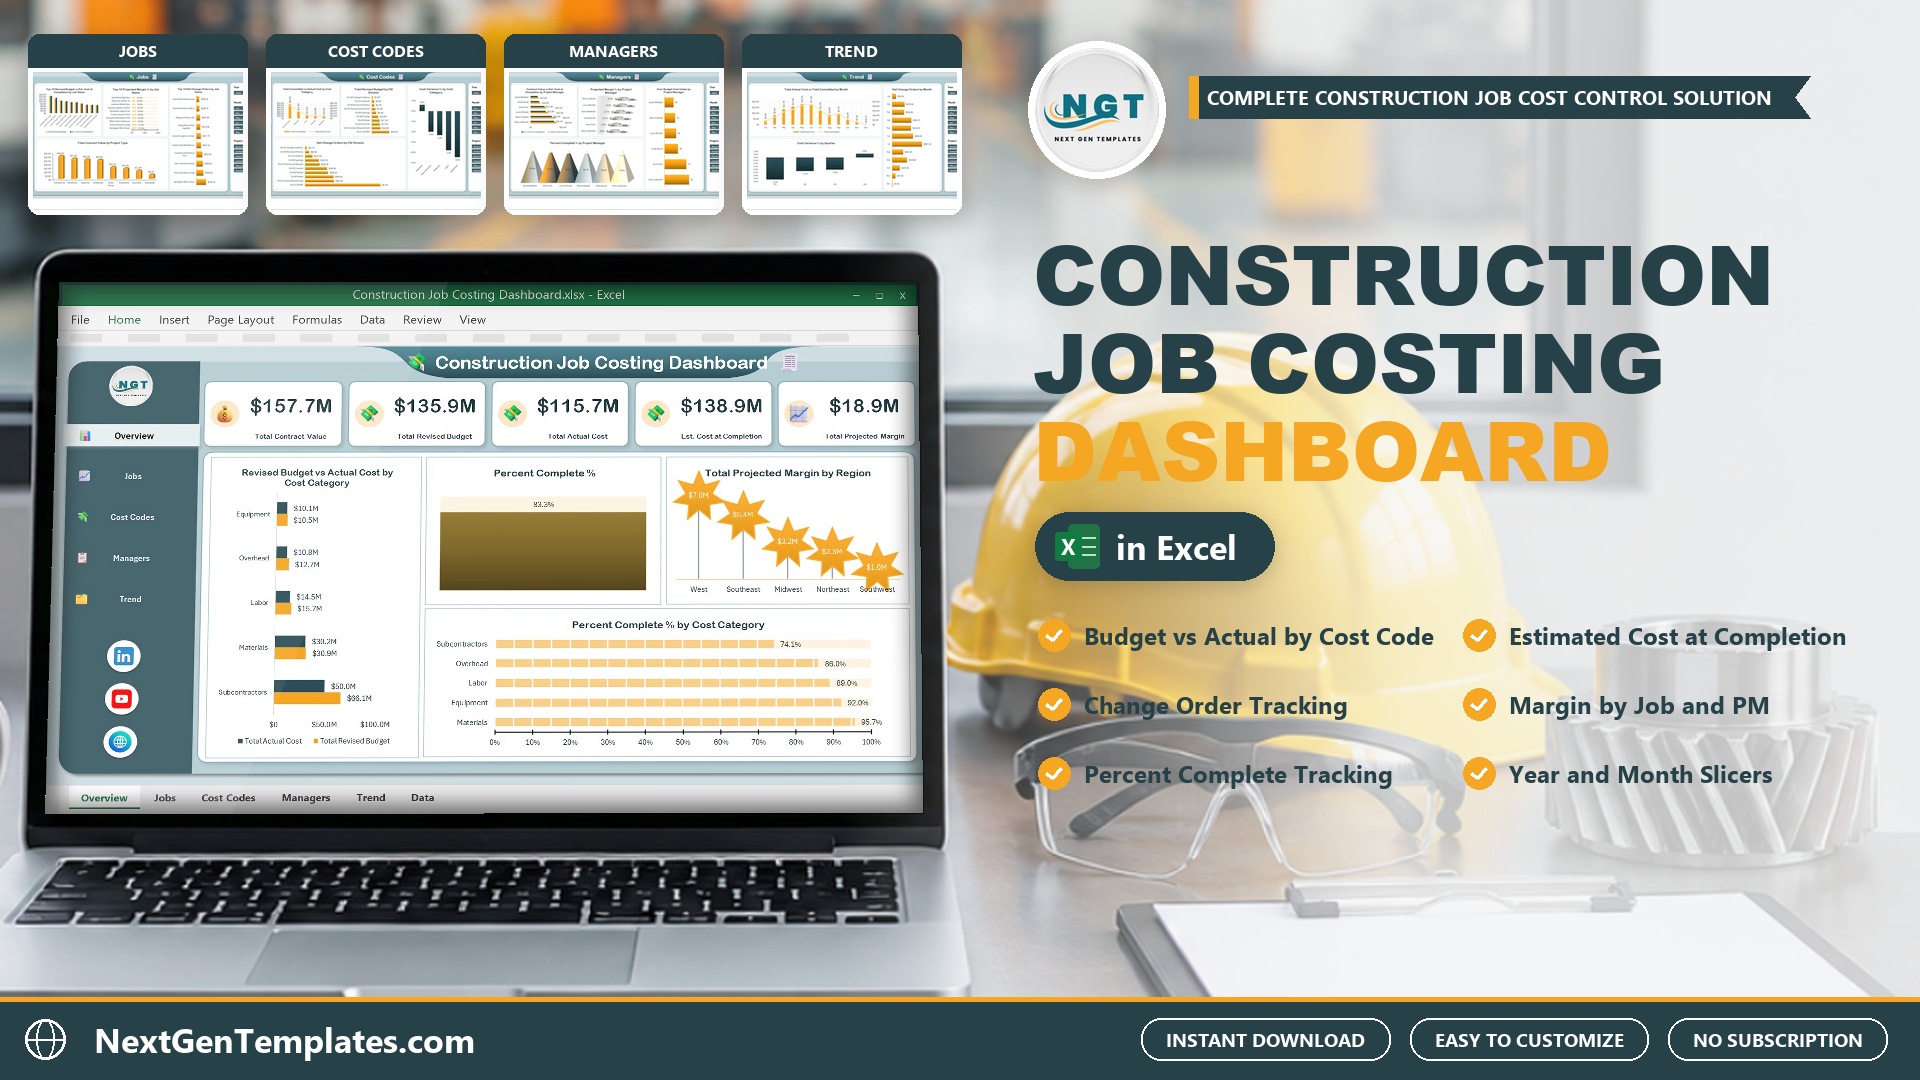
Most contractors find out a job lost money when it is already finished. The Construction Job Costing Dashboard in Excel is built to show it earlier. It puts budget, committed cost, actual cost, estimated cost at completion and projected margin for every job on five clickable Excel pages, with no macros. This post walks through what is inside, who it suits and where it stops.
🌍 Join 10,000+ customers in 180+ countries using NextGenTemplates to replace paid SaaS tools with one-time-purchase Excel, Google Sheets, Power BI and HTML templates.
Watch the Construction Job Costing Dashboard in Excel: Budget vs Actual, Cost to Complete and Margin by Job walkthrough
 Launch offer
Build a linked three-statement model, a DCF valuation, scenarios and budget vs actual, plus a Power BI finance dashboard. 10h 27m of video by PK, with practice and solution files for every lesson.
What the Construction Job Costing Dashboard does
- Budget vs actual by cost category: revised budget against actual cost for labor, materials, equipment, subcontractors and overhead.
- Committed cost: money that is already spoken for, compared with what has actually been spent.
- Estimated cost at completion: what each job will cost when it finishes, set against the revised budget and the contract value.
- Change orders: net change orders by job, CSI division and month.
- Projected margin: margin and margin % by job, region and project manager.
- Percent complete: the cost-to-cost method, actual cost divided by the estimated cost at completion.
Sample data is included: 500 fictional work packages with formula columns for revised budget, cost at completion, cost variance, projected margin, month, year and quarter.
A look at the pages
Overview Page
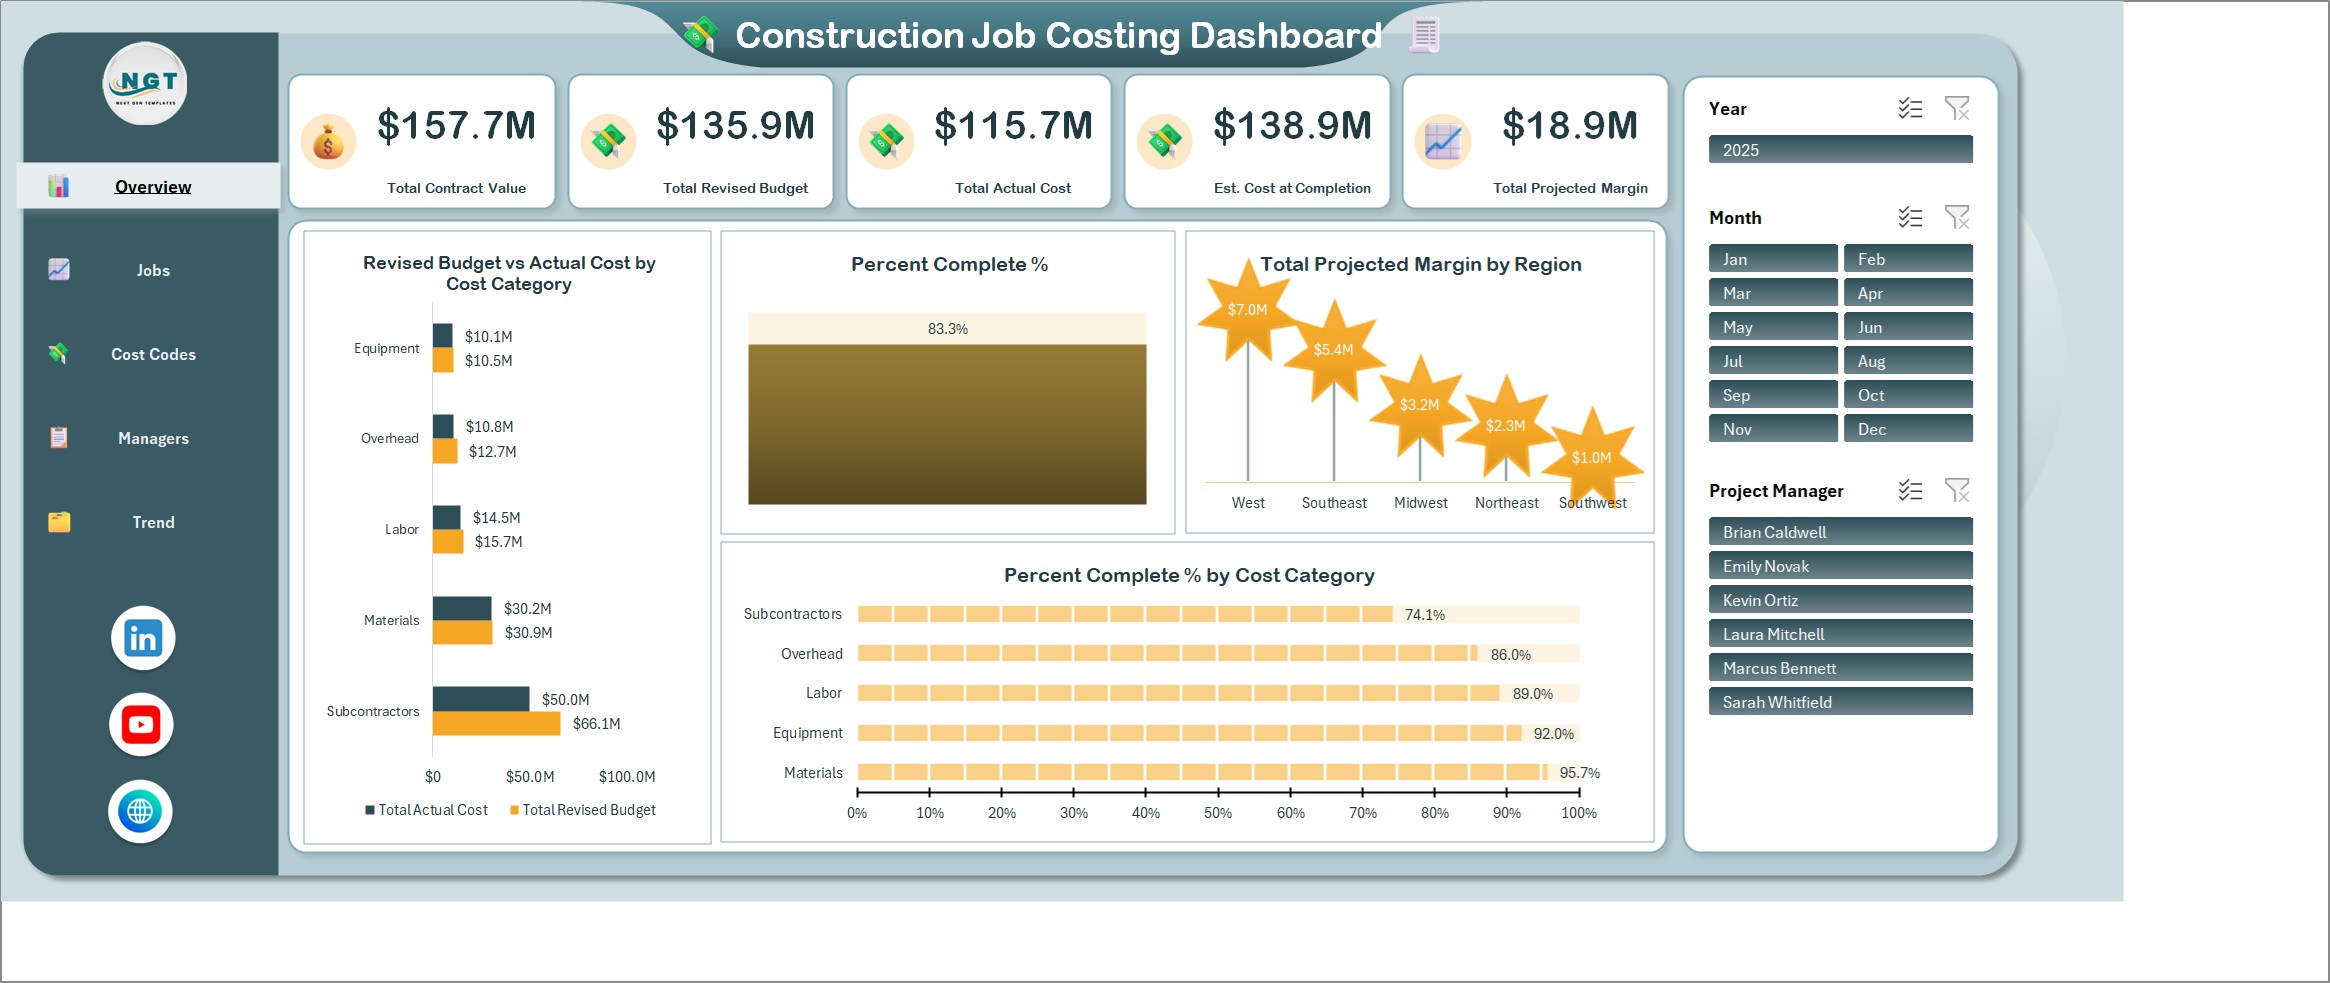
Five KPI cards sit across the top: Total Contract Value, Total Revised Budget, Total Actual Cost, Est. Cost at Completion and Total Projected Margin. Below them are Revised Budget vs Actual Cost by Cost Category, a Percent Complete % gauge, Total Projected Margin by Region and Percent Complete % by Cost Category.
Jobs Page
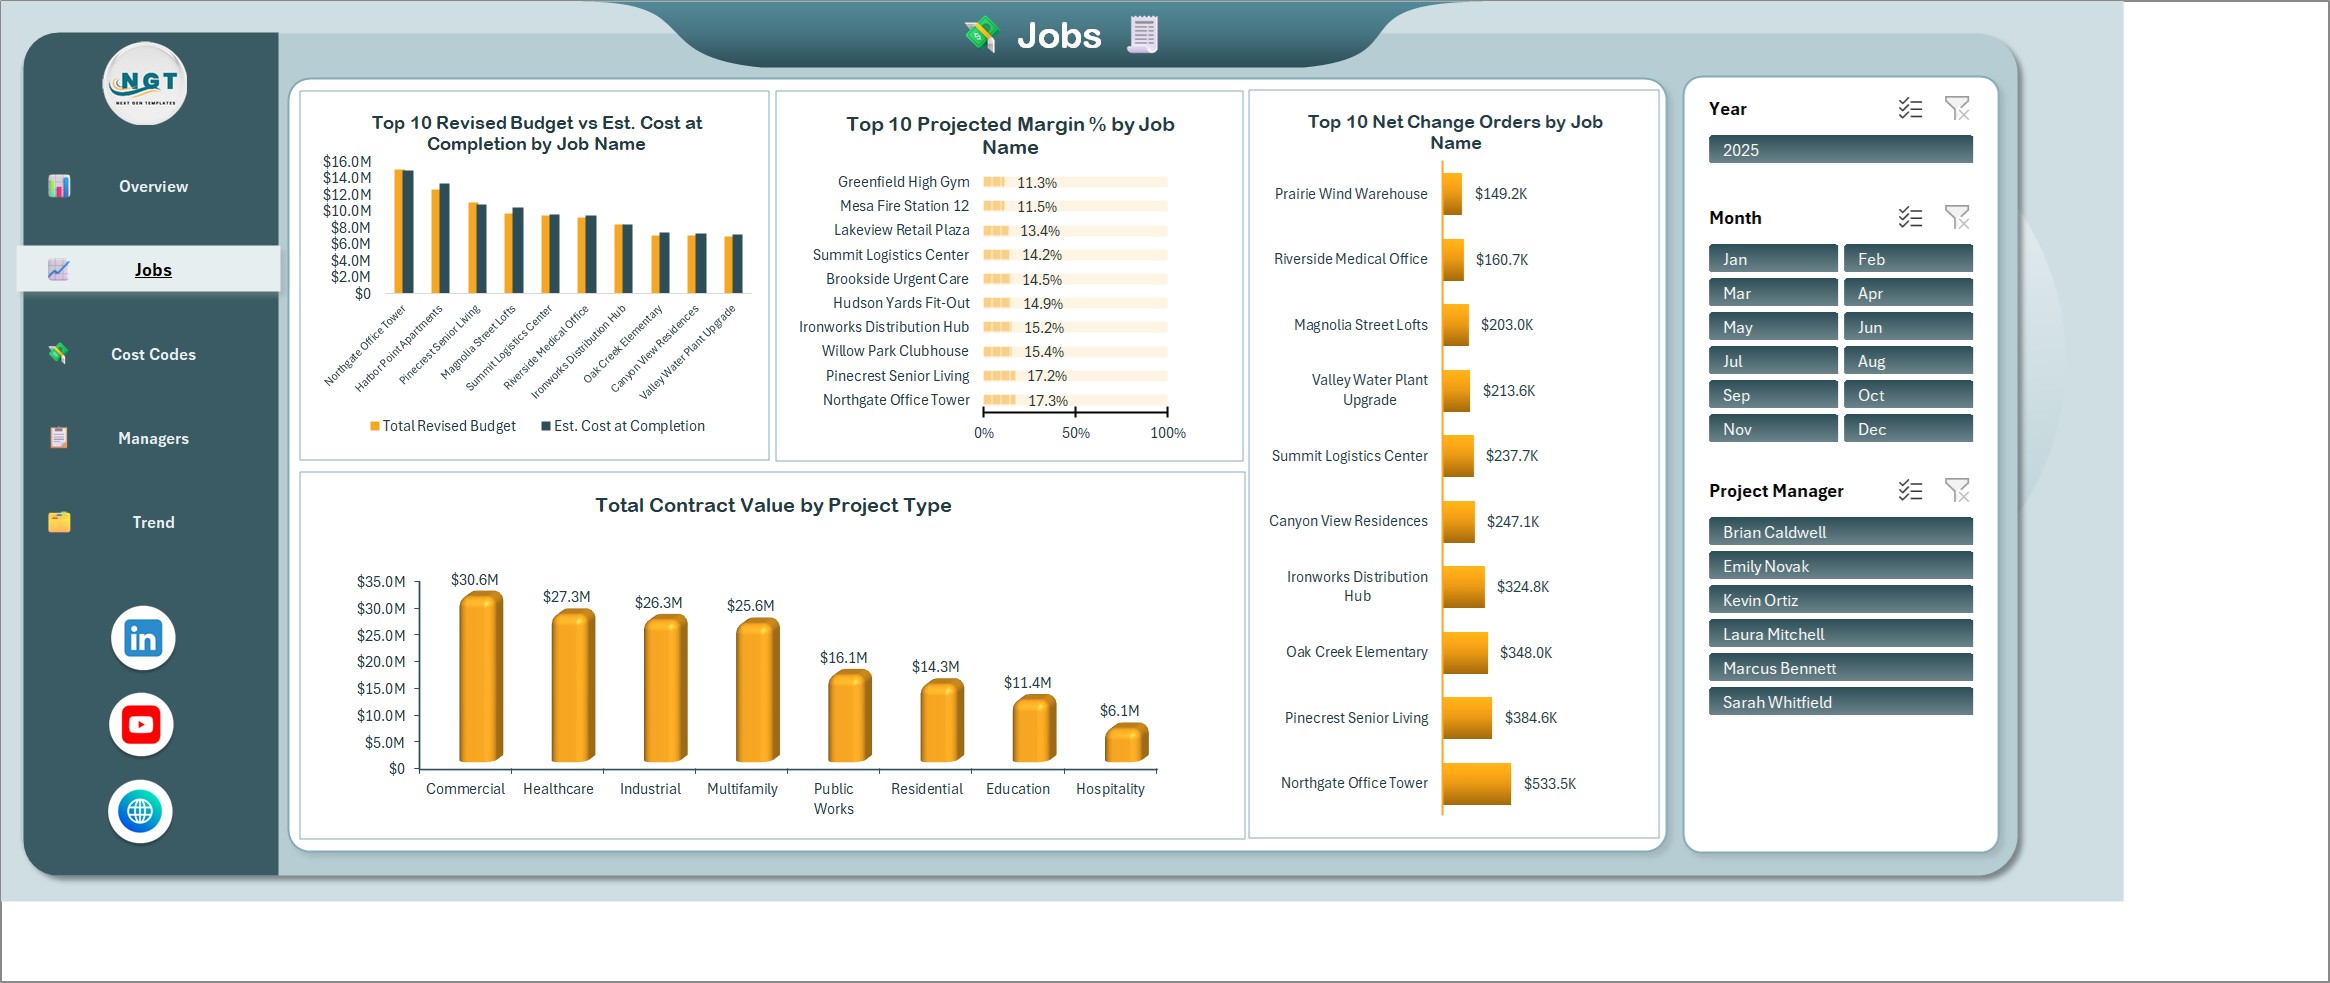
The top 10 jobs by revised budget against estimated cost at completion, the top 10 jobs by projected margin %, net change orders by job and total contract value by project type. This is where you spot the jobs that are drifting.
Cost Codes Page
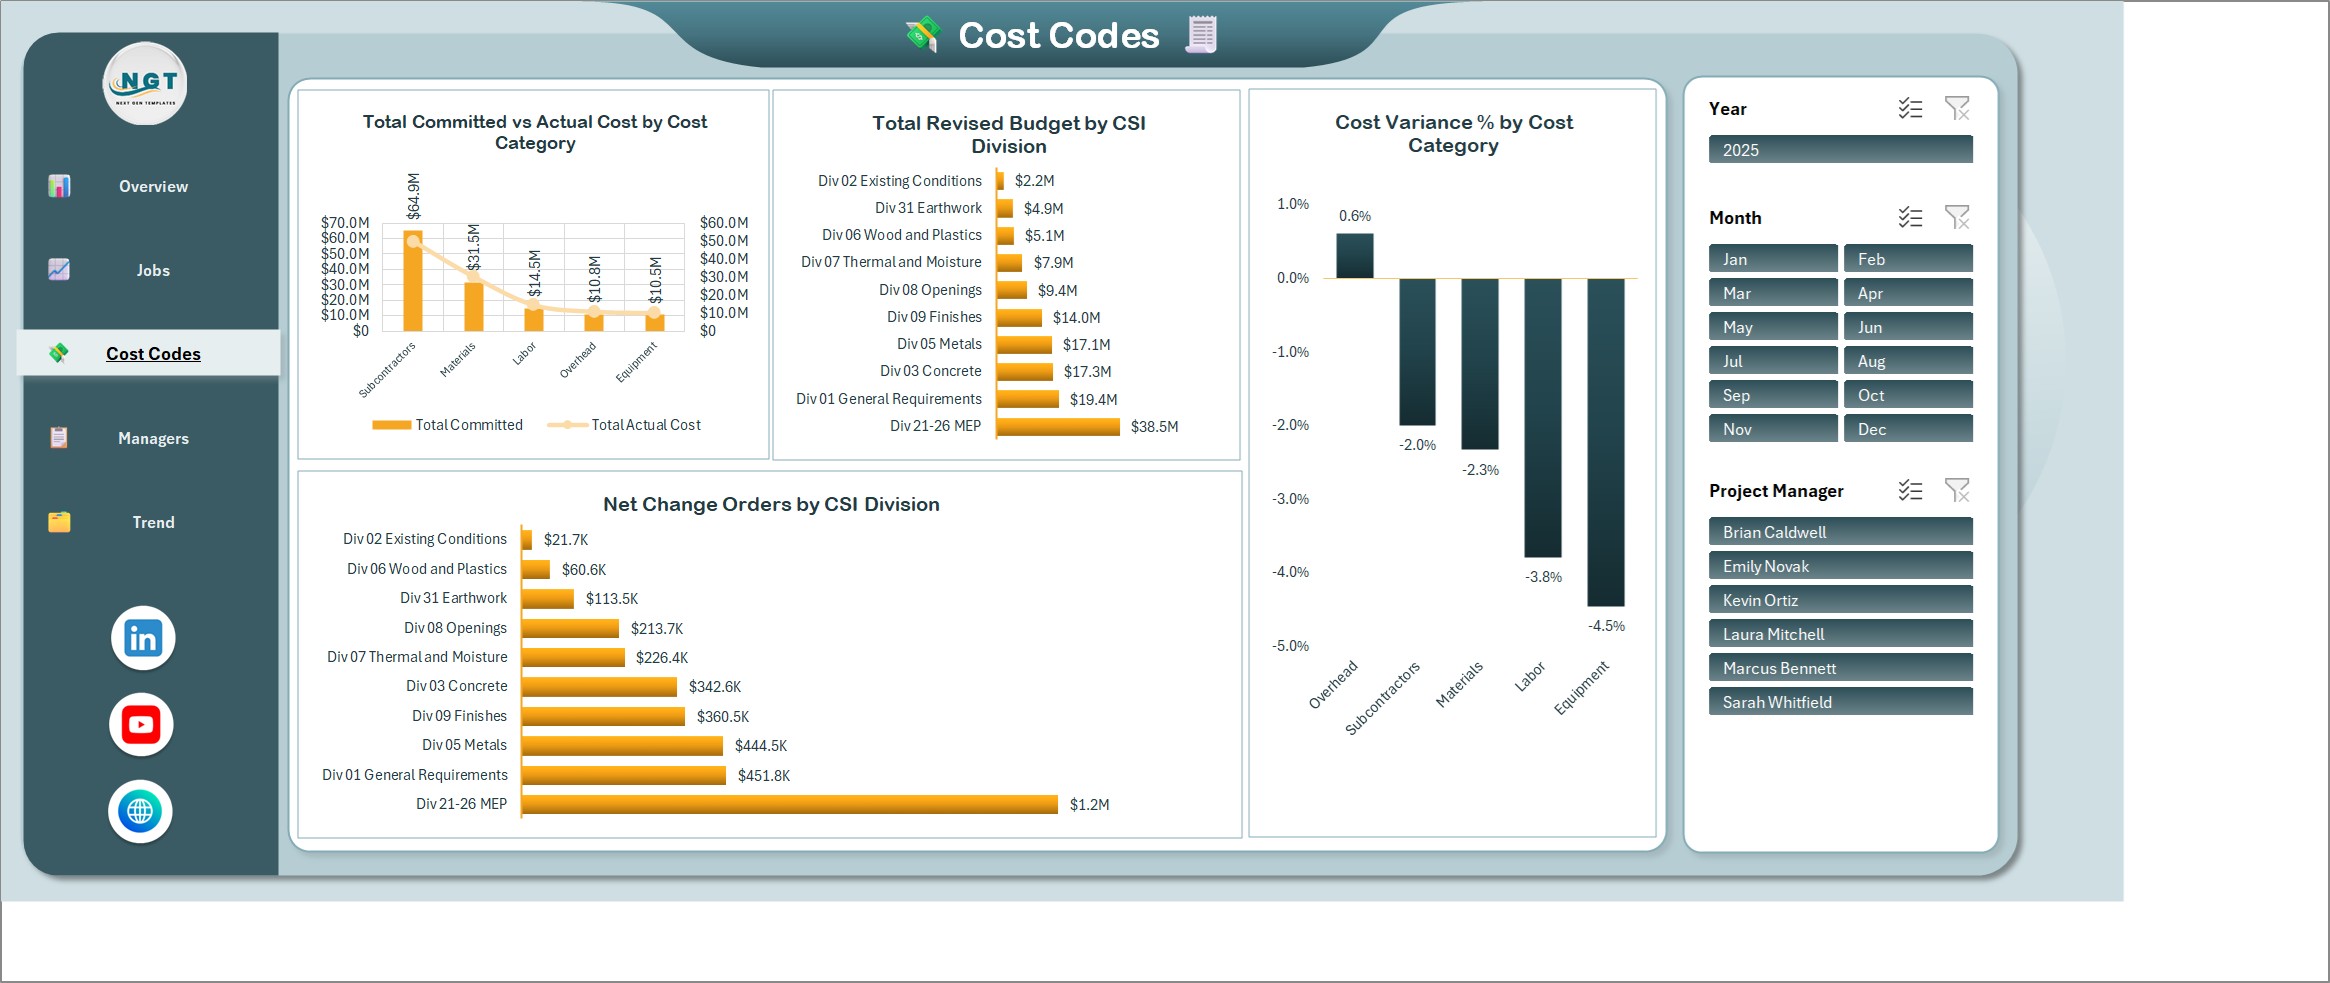
Total committed vs actual cost by cost category, total revised budget by CSI division, net change orders by CSI division and cost variance % by cost category, so you can see which cost codes are over budget and by how much.
Managers Page
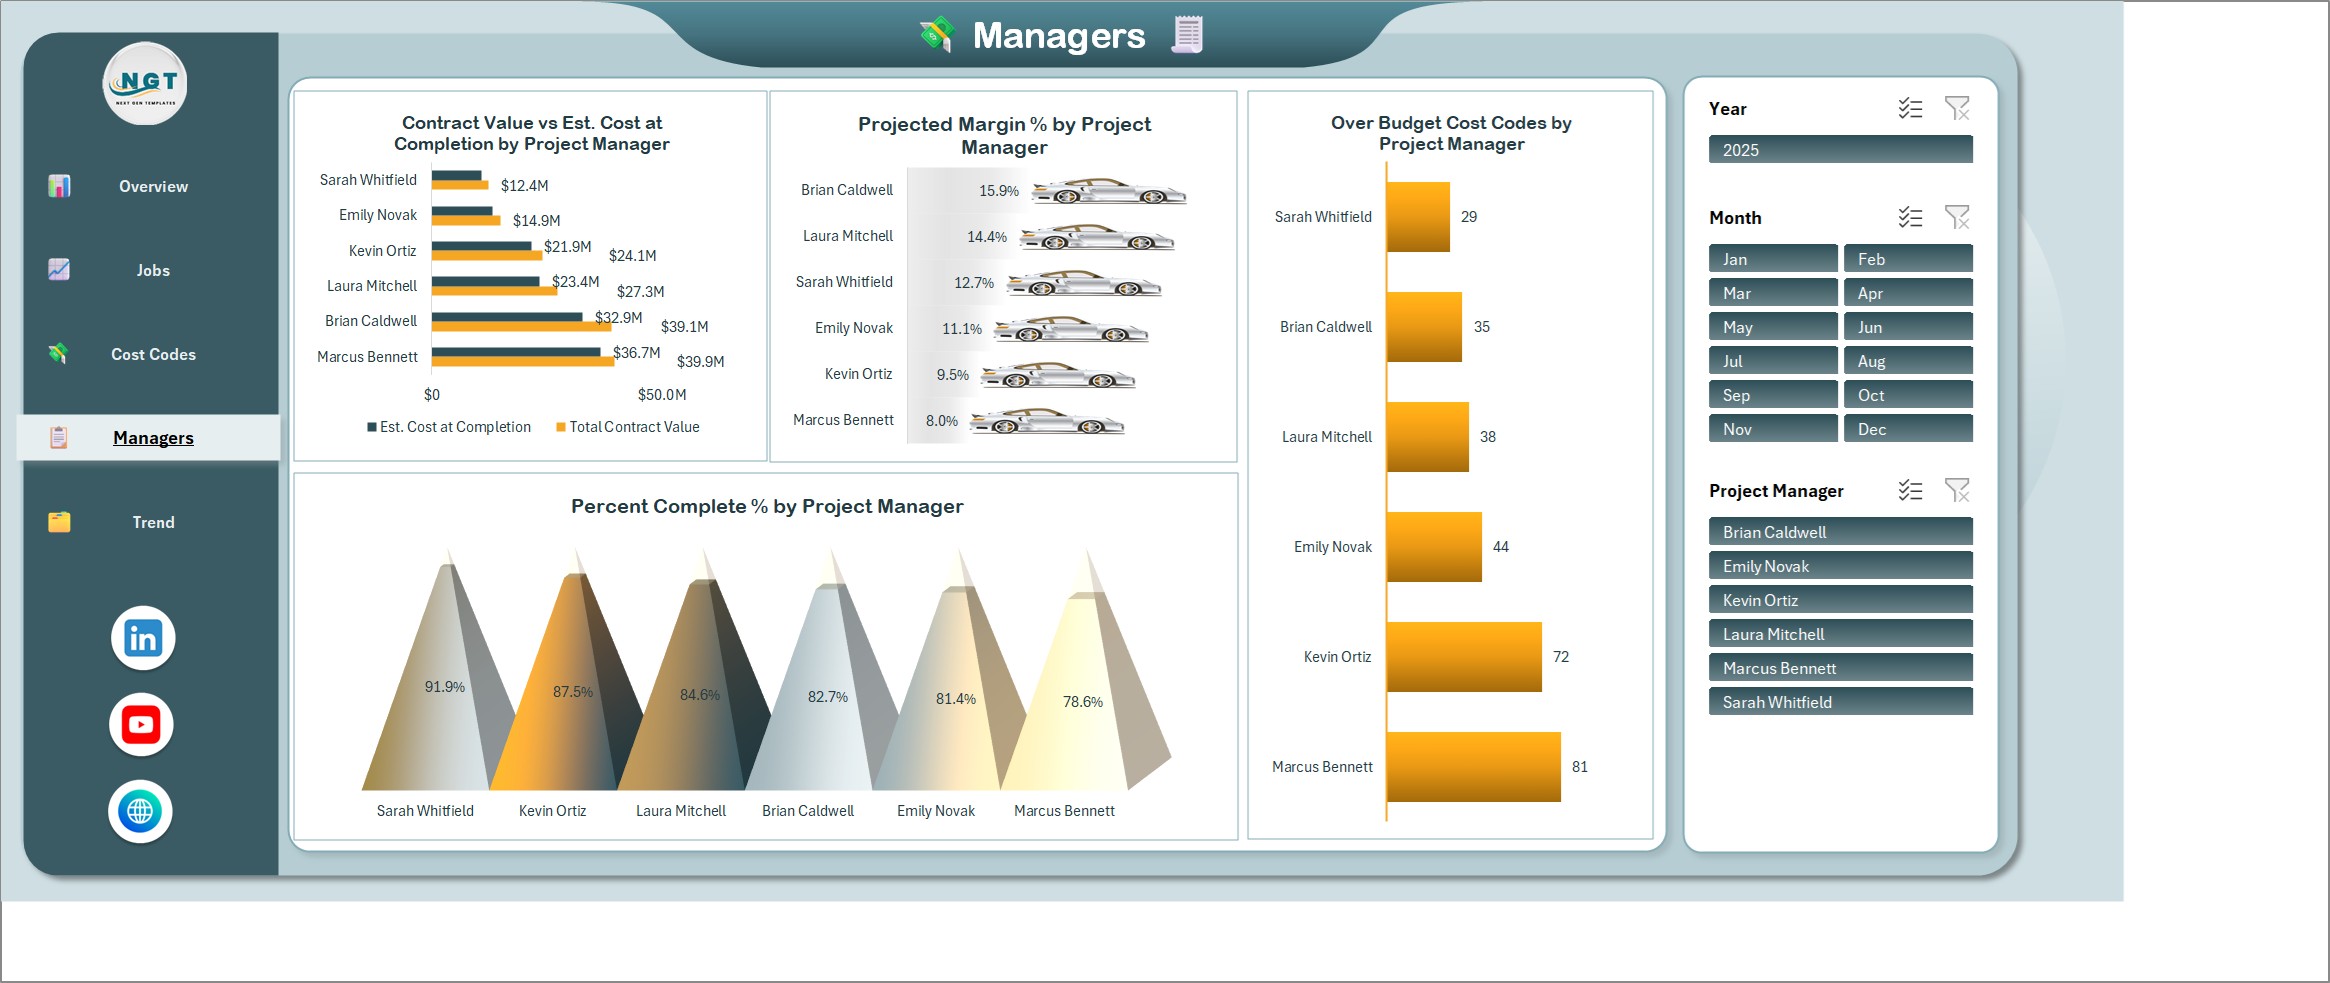
Contract value against estimated cost at completion for each project manager, projected margin % by project manager, over-budget cost codes and percent complete by project manager. Handy for a monthly review with each manager.
Trend Page
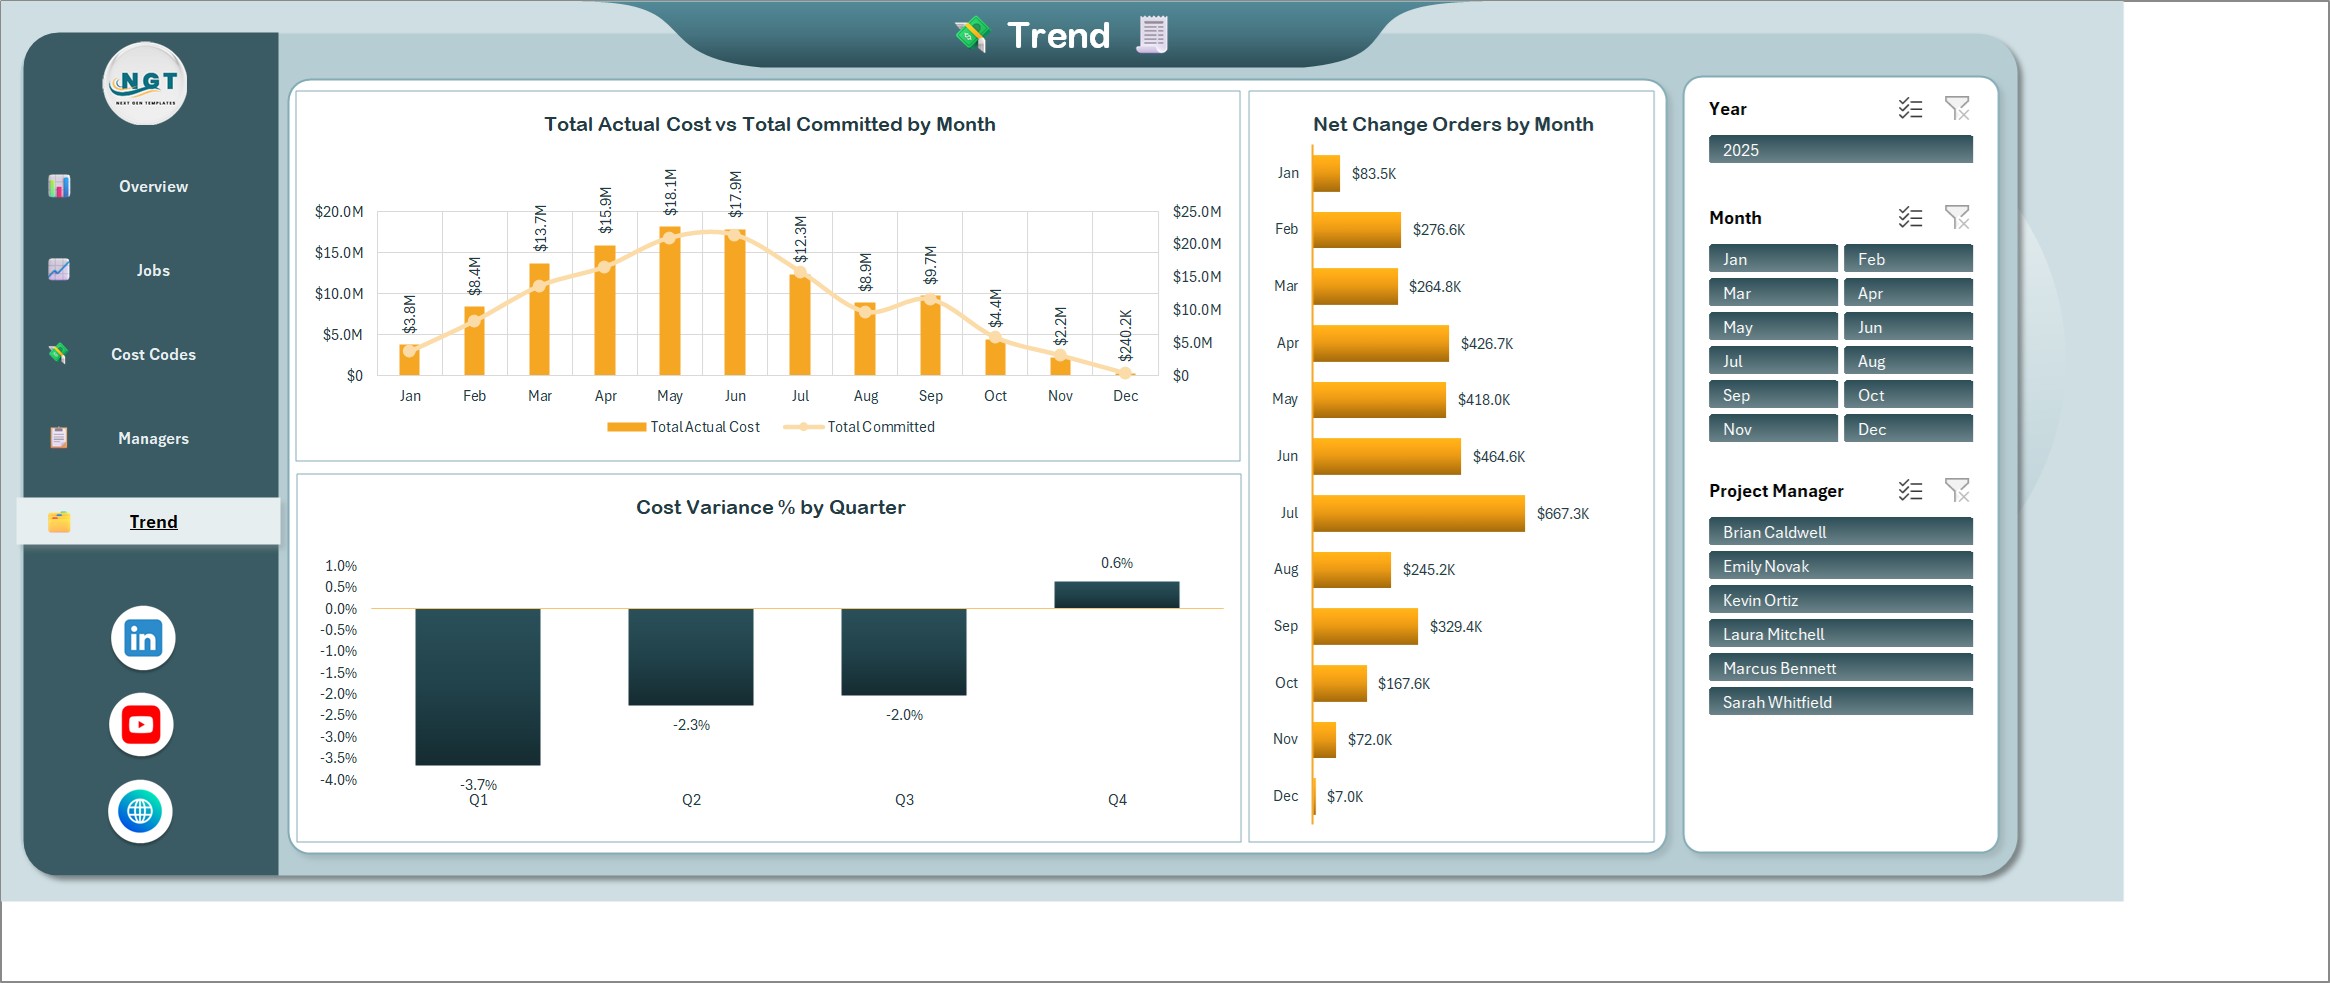
Total actual cost vs total committed cost by month, net change orders by month and cost variance % by quarter, so you can see whether cost control is getting better or worse through the year.
How a month-end review runs
The workbook follows the same routine most contractors already use at month end, so there is nothing new to learn.
Update the data. On the Data tab, add or update the work packages: job, project manager, region, project type, cost category, CSI division, contract value, budget, change orders, committed cost and actual cost. The formula columns work out the revised budget, the cost at completion, the cost variance and the projected margin for you.
Refresh. Click Refresh All and the pivot tables on the Support tab update, which updates every card and chart on the five pages.
Read the Overview. The five KPI cards tell you in a few seconds whether the portfolio is on track: how much is contracted, how much is budgeted, how much has been spent, what the jobs will cost at completion and how much margin is left.
Find the problem jobs. The Jobs page ranks the top 10 jobs by revised budget against estimated cost at completion and by projected margin %. The Cost Codes page shows which cost categories and CSI divisions have the worst cost variance %.
Review with each manager. Pick a project manager on the slicer and the Managers page shows their contract value against cost at completion, their projected margin %, their over-budget cost codes and their percent complete.
Setting it up with your own data
The fictional data is there so every chart has something in it on day one. To use your own numbers, replace the sample rows on the Data tab and click Refresh All. New jobs, project managers, cost categories and CSI divisions appear in the pages and the slicers after the refresh. Because the file has no macros and no protection that blocks editing, you can restyle the charts or add your own pivot tables on the Support tab.
It is an add-data-and-refresh workbook rather than a live connector, so it suits teams that already export job cost reports from their accounting system and want a better way to read them. It needs desktop Excel for Windows (Excel 2016 or later, or Microsoft 365), because the slicers and pivot tables do not work fully in Excel for the web. Microsoft explains how slicers filter data if you are new to them.
Construction Job Costing Dashboard vs. a spreadsheet vs. construction software
| Feature | This Excel dashboard | Plain job cost spreadsheet | Construction software |
|---|---|---|---|
| Cost | $17.99 one-time ✅ | Free, but you build it | Monthly subscription |
| Budget vs actual and committed cost | Yes ✅ | Manual formulas | Yes ✅ |
| Estimated cost at completion and projected margin | Yes ✅ | Build it yourself | Yes ✅ |
| Net change orders by job and month | Yes ✅ | Manual | Yes ✅ |
| Live link to accounting or payroll | No | No | Yes ✅ |
Who it is for, and who it is not for
It suits general and specialty contractors, project managers, estimators and controllers who want to read job costs against budget each month. It does not suit teams that need a live accounting connection, Mac or Excel-for-web users, or anyone who needs retainage, certified payroll or progress billing, which this dashboard does not include.
Related templates
If you want something to sit beside the dashboard, these are the closest matches in the store:
- Interior Fit-Out Project Management System Web App: a browser-based system for running fit-out projects.
- Profitability Analysis Pack in Excel: margins across the whole business.
- Free Automatic Gantt Chart in Excel: plan the schedule next to your costs.
Frequently asked questions
What does the Construction Job Costing Dashboard in Excel show?
For every job and cost code it shows what you budgeted, what you have committed, what you have actually spent, what the job will cost at completion and how much margin you will keep. Five pages (Overview, Jobs, Cost Codes, Managers and Trend) show the same data from different angles.
Does it need macros or add-ins?
No. It uses formulas, pivot tables, charts and slicers only, so there is nothing to enable beyond opening the file.
Does it connect to my accounting or ERP software?
No. It is an add-data-and-refresh workbook. Paste or type your work packages on the Data tab, click Refresh All, and every card and chart updates. There is no live link to your accounting software.
How is percent complete worked out?
It uses the cost-to-cost method: actual cost divided by the estimated cost at completion. The Percent Complete % card and chart react to the Year, Month and Project Manager slicers.
Which Excel version do I need?
Desktop Excel for Windows, Excel 2016 or later, or Microsoft 365. The slicers and pivot tables do not work fully in Excel for the web.
Is the sample data real?
No. The 500 work packages on the Data tab are fictional. Replace them with your own and refresh.
Can I add my own jobs, project managers and cost categories?
Yes. Add rows on the Data tab with your own job names, project managers, cost categories and CSI divisions, click Refresh All, and the pages and slicers pick them up.
Can I change the colours or add a chart?
Yes. It is a normal Excel workbook with no macros and no protection that blocks editing, so you can restyle the charts or add your own pivot tables on the Support tab.
Get the Construction Job Costing Dashboard
One-time payment, no subscription, instant download, illustrated PDF manual included. See the Construction Job Costing Dashboard in Excel. More dashboards are in the MS Excel category.