

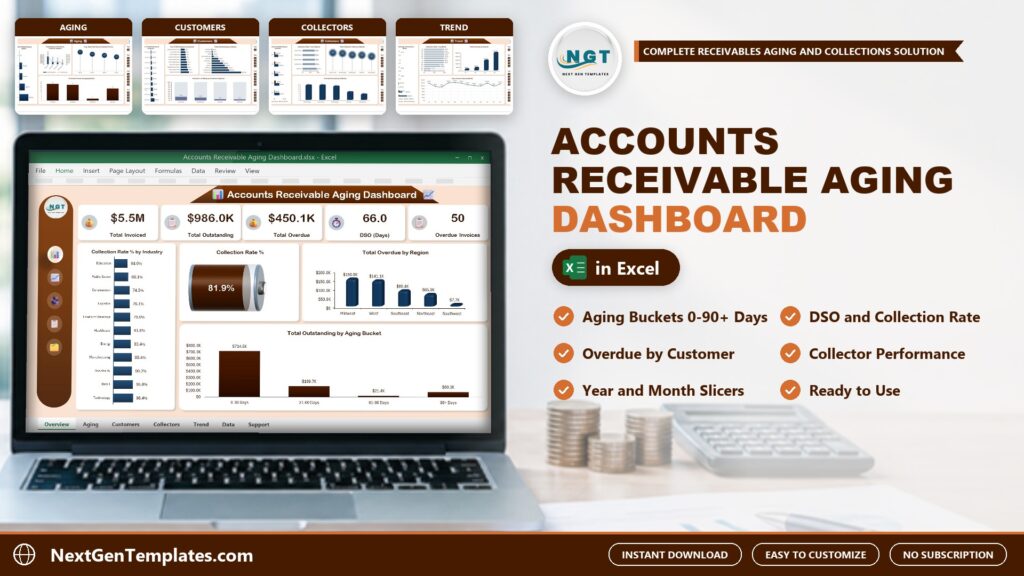
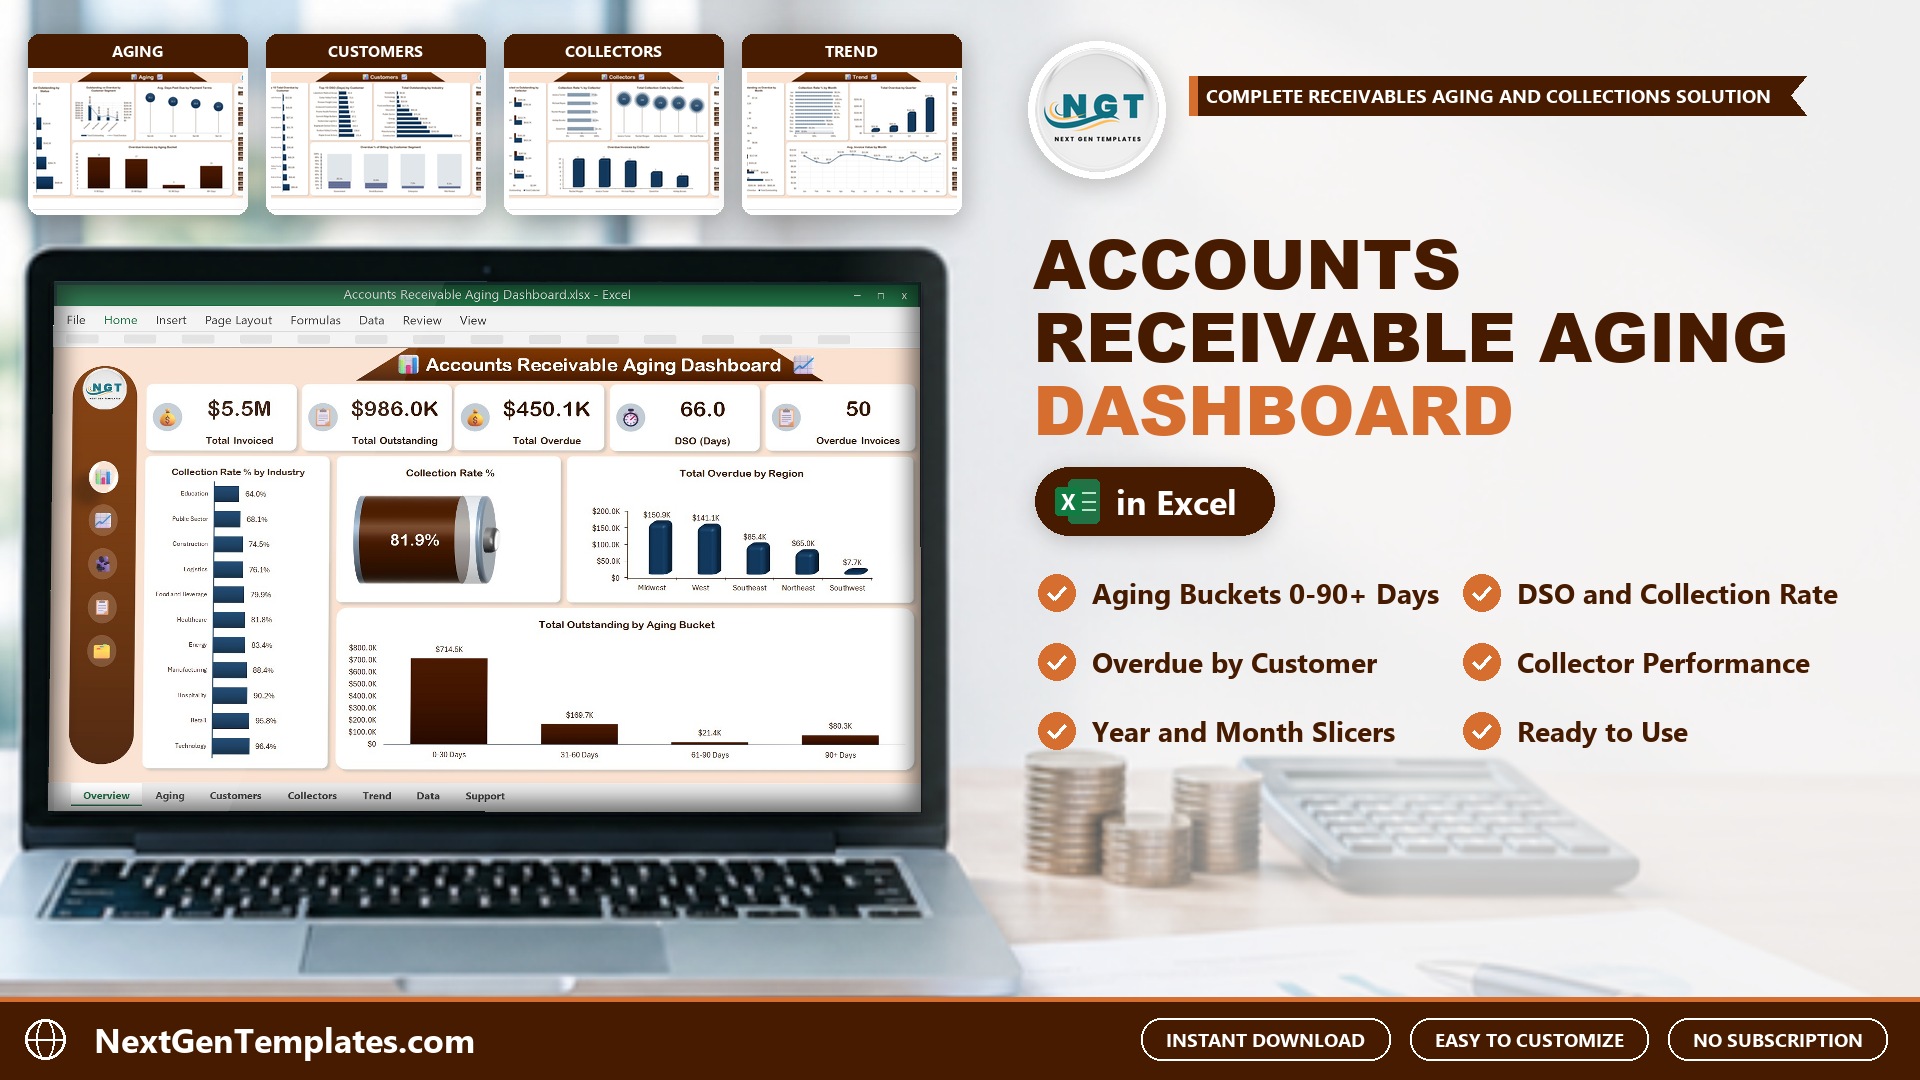
Late payments hide inside long invoice lists. The Accounts Receivable Aging Dashboard in Excel groups every open invoice into aging buckets and shows who owes what, which customers are slow and how each collector is doing.
Watch the Accounts Receivable Aging Dashboard in Excel: Aging Buckets, DSO and Collections walkthrough
 Launch offer
From your first Pivot Table to the Data Model, DAX, Power Query and a one-page KPI dashboard. 11h 51m of video by PK, with practice files, quizzes and a capstone.
What Is an Accounts Receivable Aging Dashboard?
An accounts receivable aging dashboard shows the money customers owe you, split by how long it has been outstanding. This one is an Excel workbook with five pages. You keep your invoices on a Data tab, click Refresh All, and the pivot tables behind the charts update the Overview, Aging, Customers, Collectors and Trend pages.
Inside the Dashboard
Overview Page
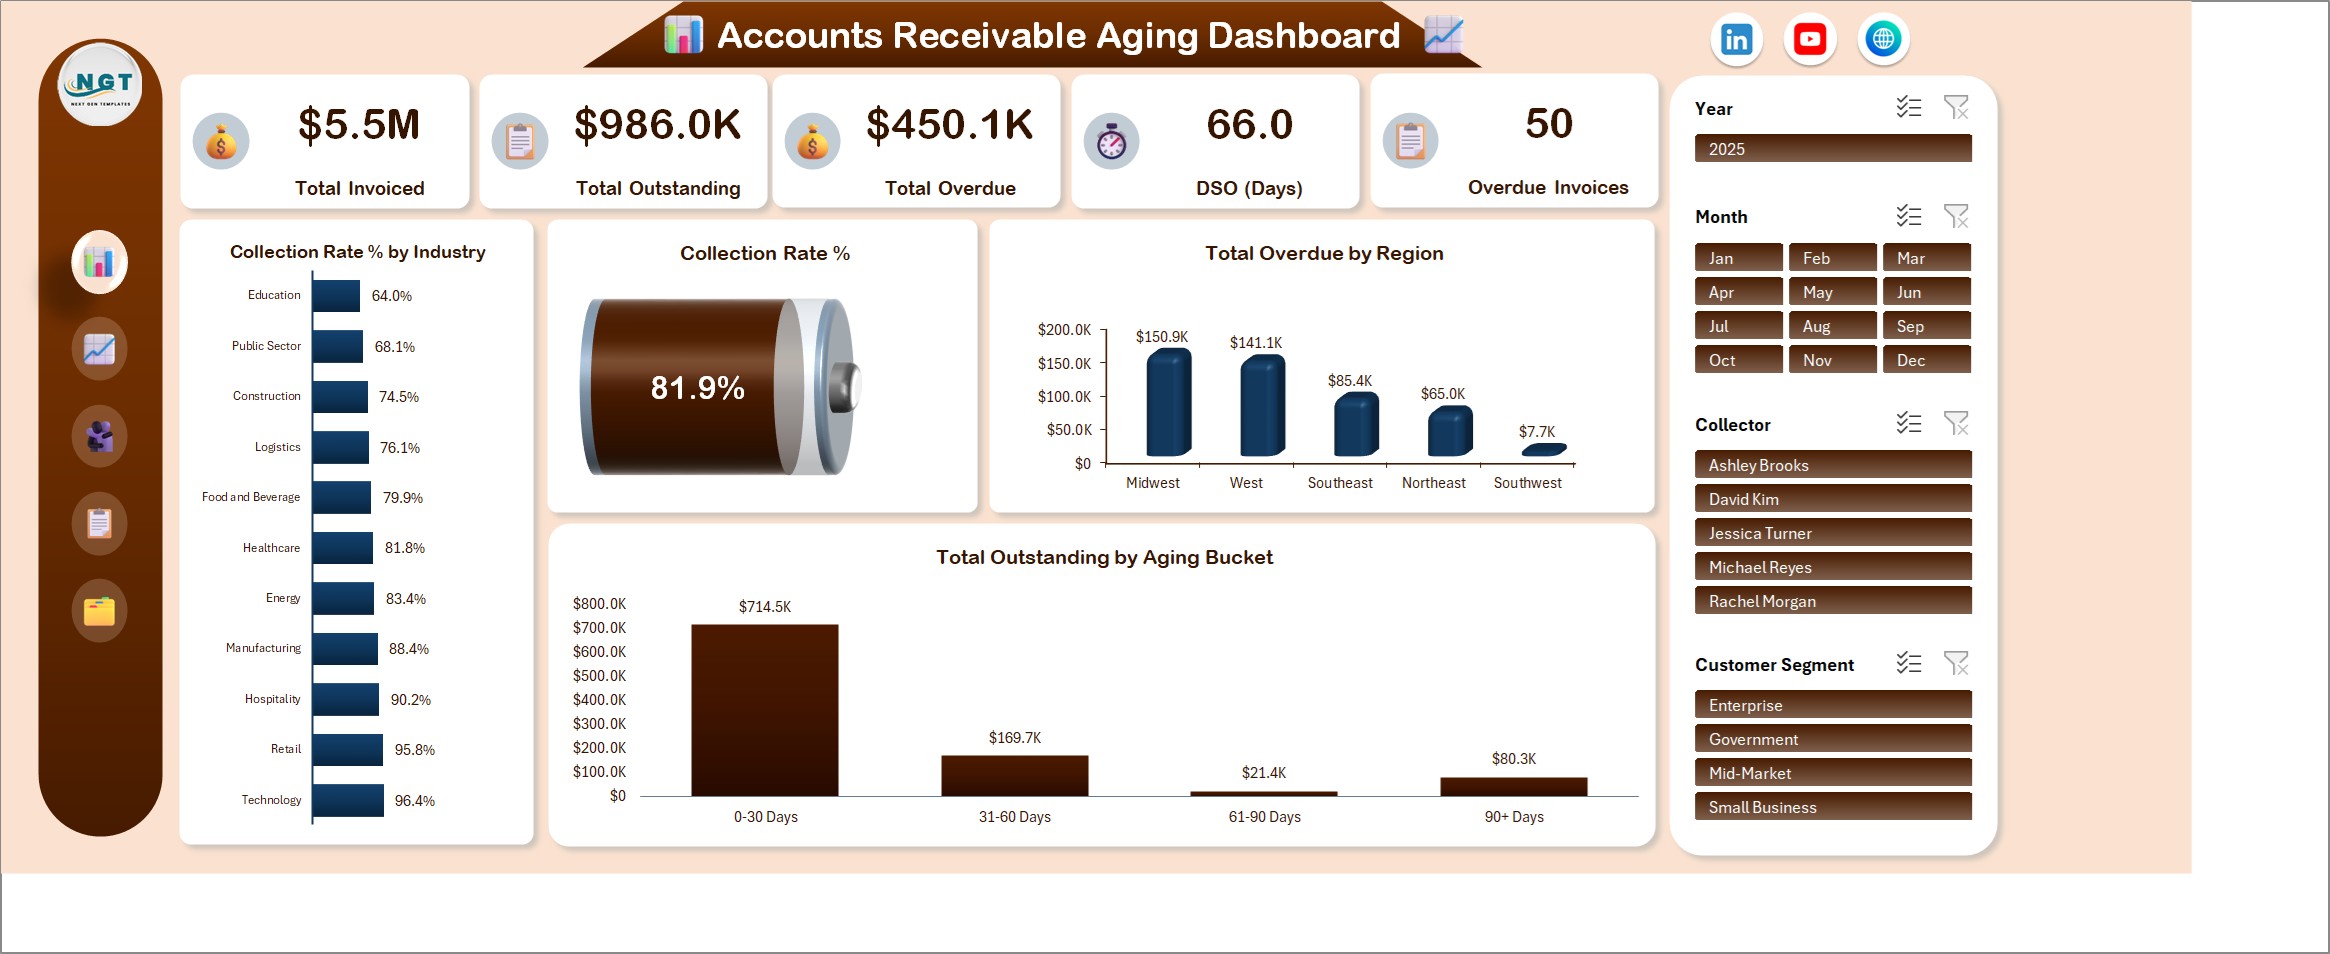
Five KPI cards sit across the top: Total Invoiced, Total Outstanding, Total Overdue, DSO (Days) and Overdue Invoices. Below them you get Collection Rate % by Industry, a Collection Rate % battery chart, Total Overdue by Region and Total Outstanding by Aging Bucket.
Aging Page
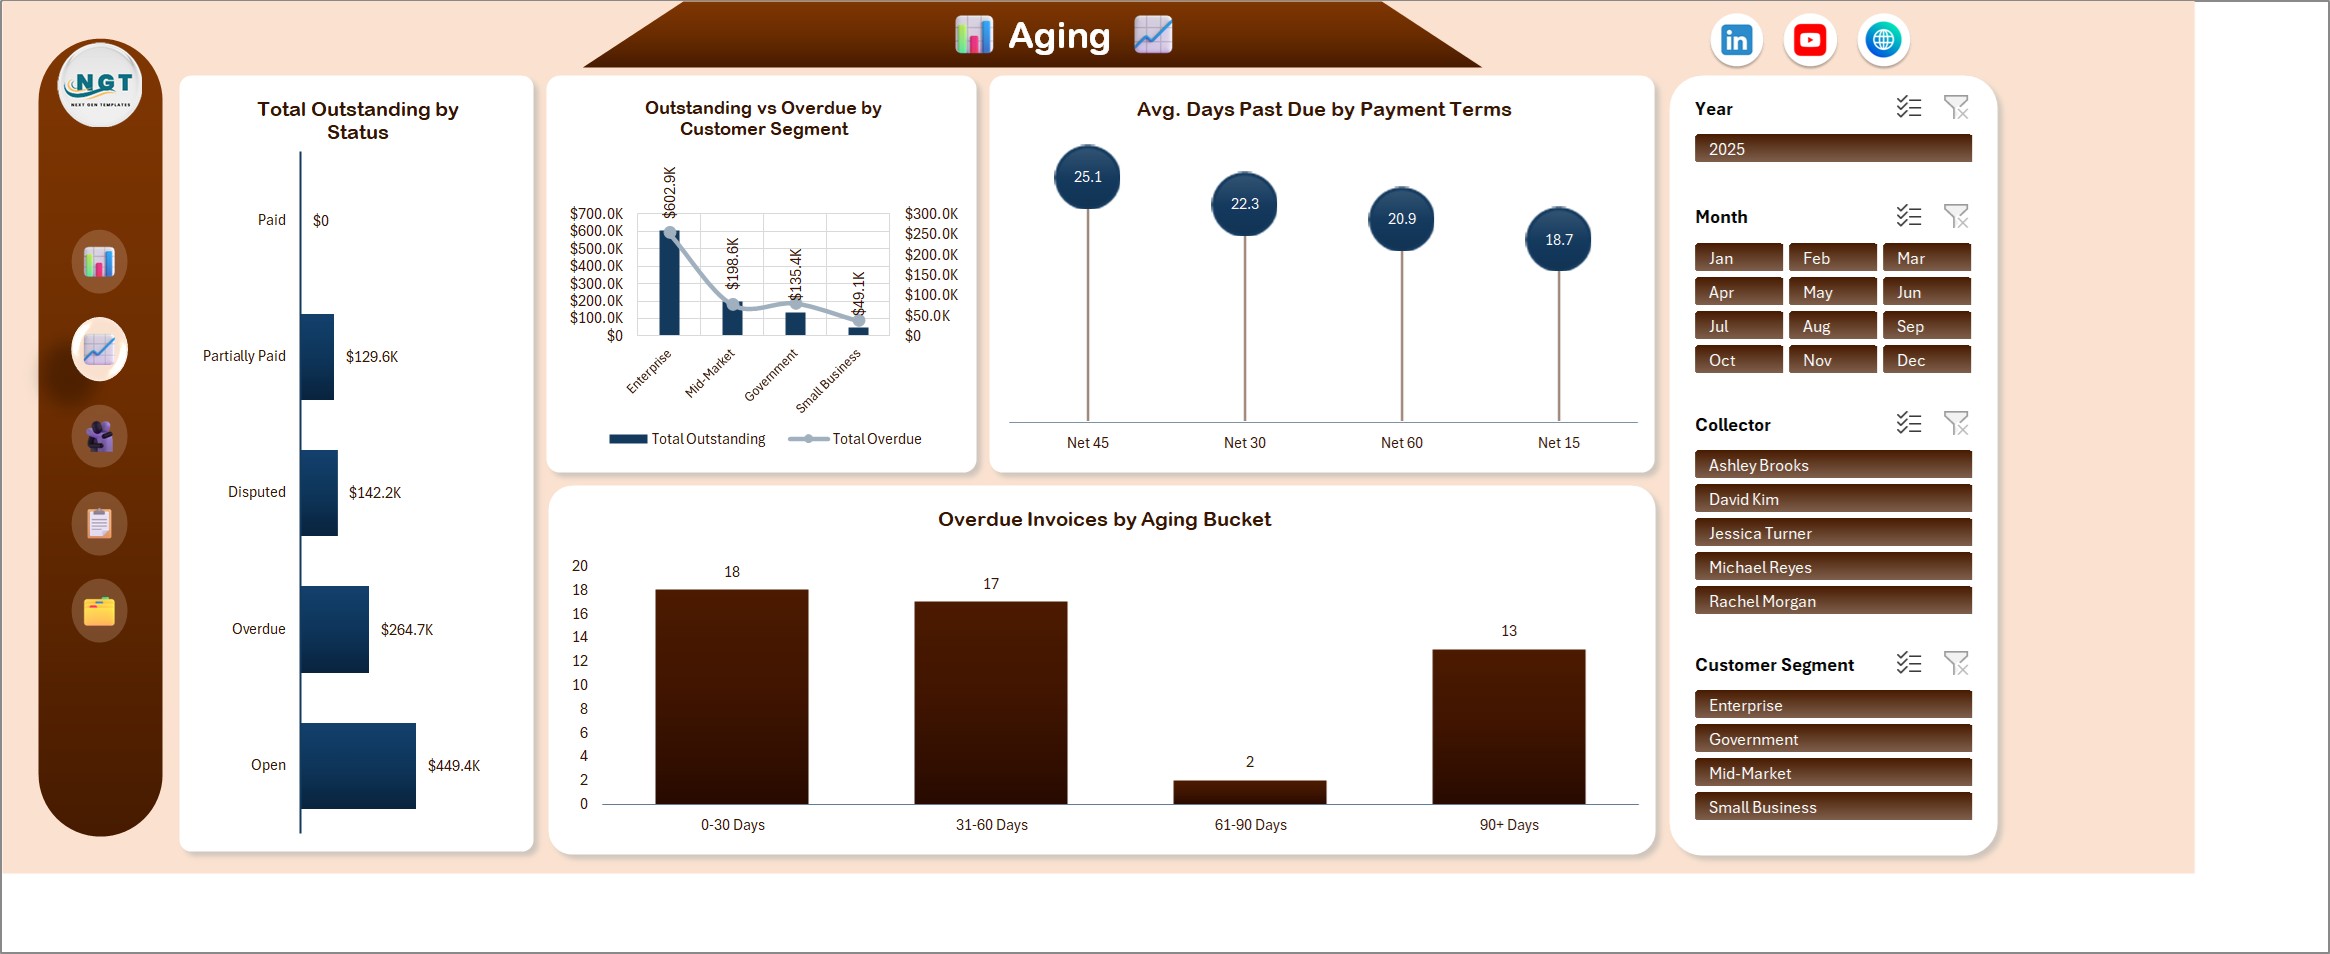
Outstanding by status, outstanding versus overdue by customer segment, average days past due by payment terms, and overdue invoices by aging bucket.
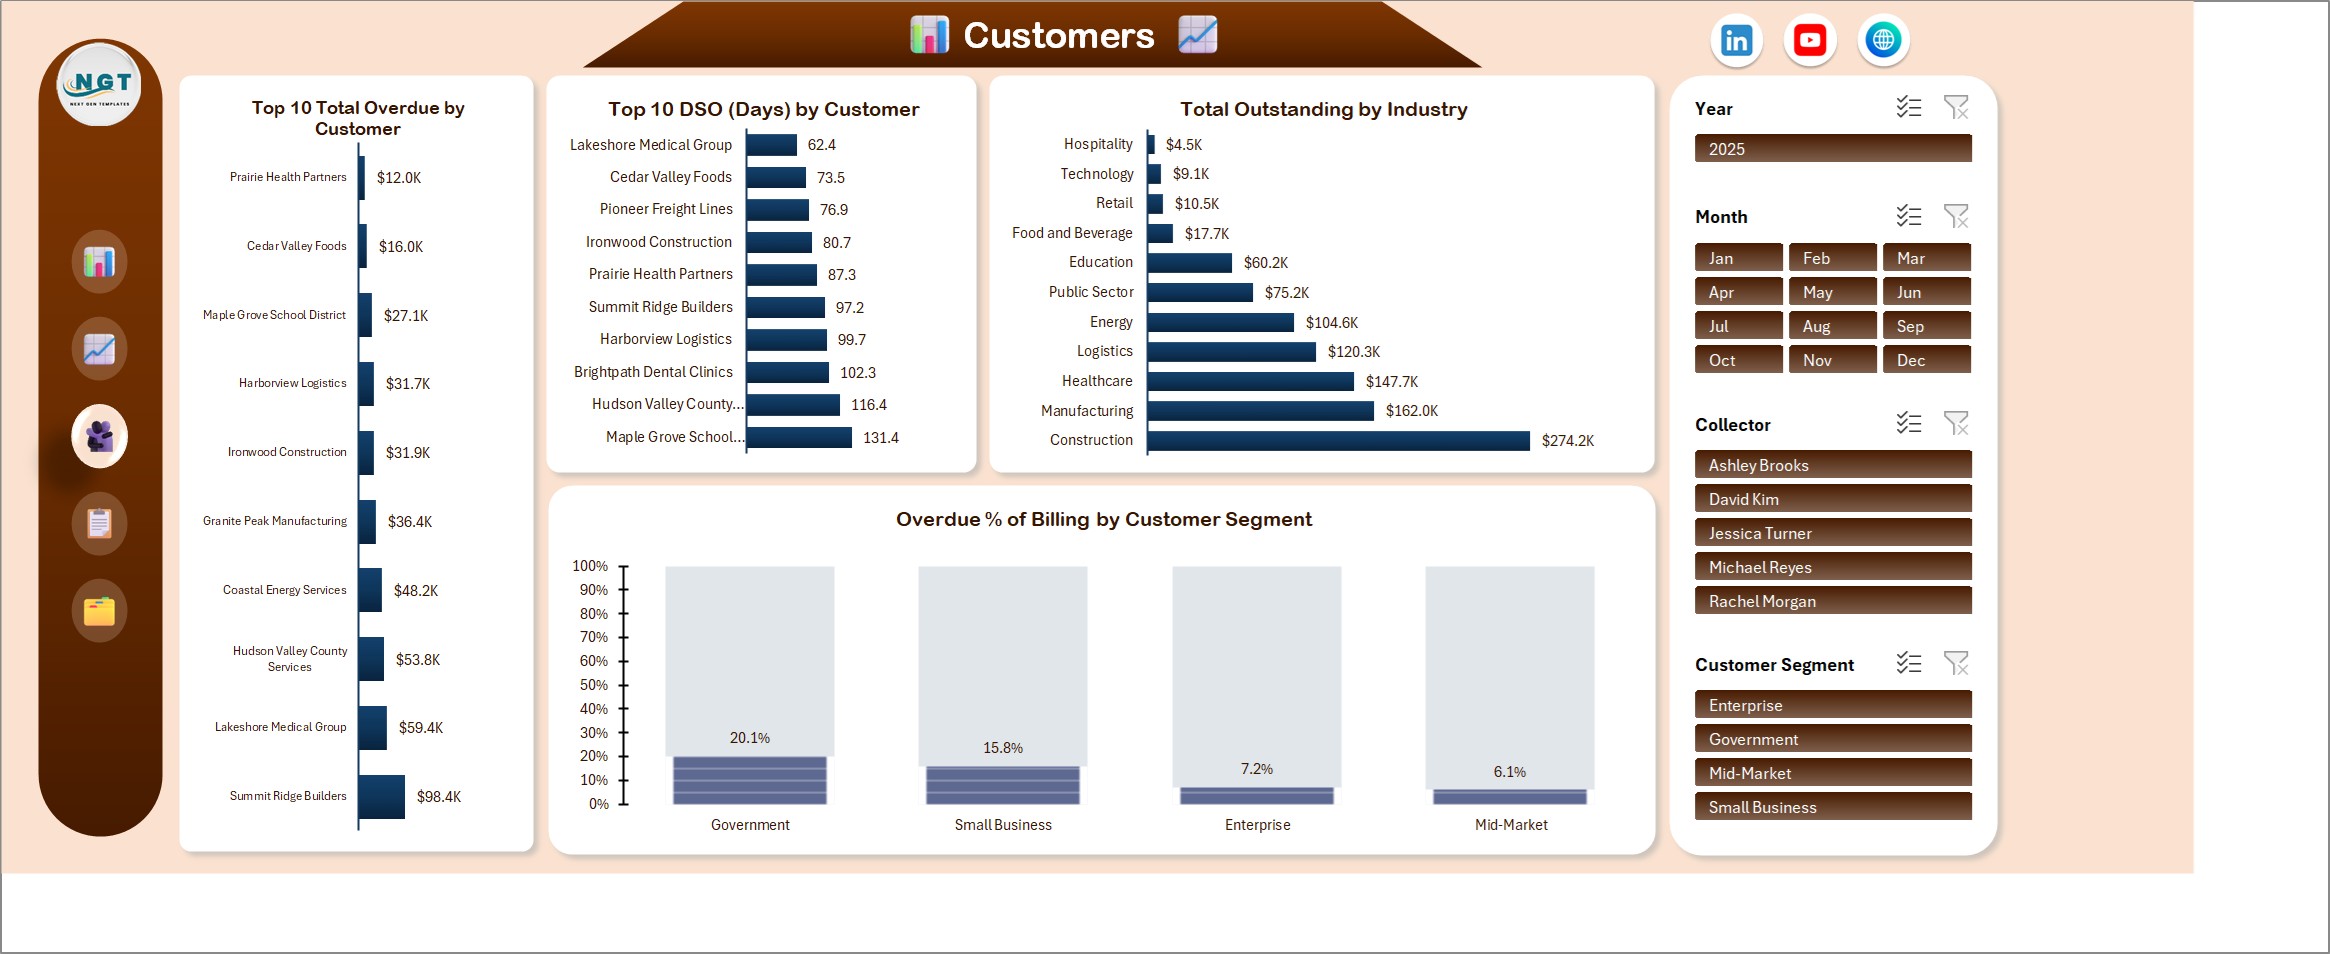
Customers Page
The top 10 customers by total overdue and by DSO, outstanding by industry, and overdue as a percentage of billing by customer segment.
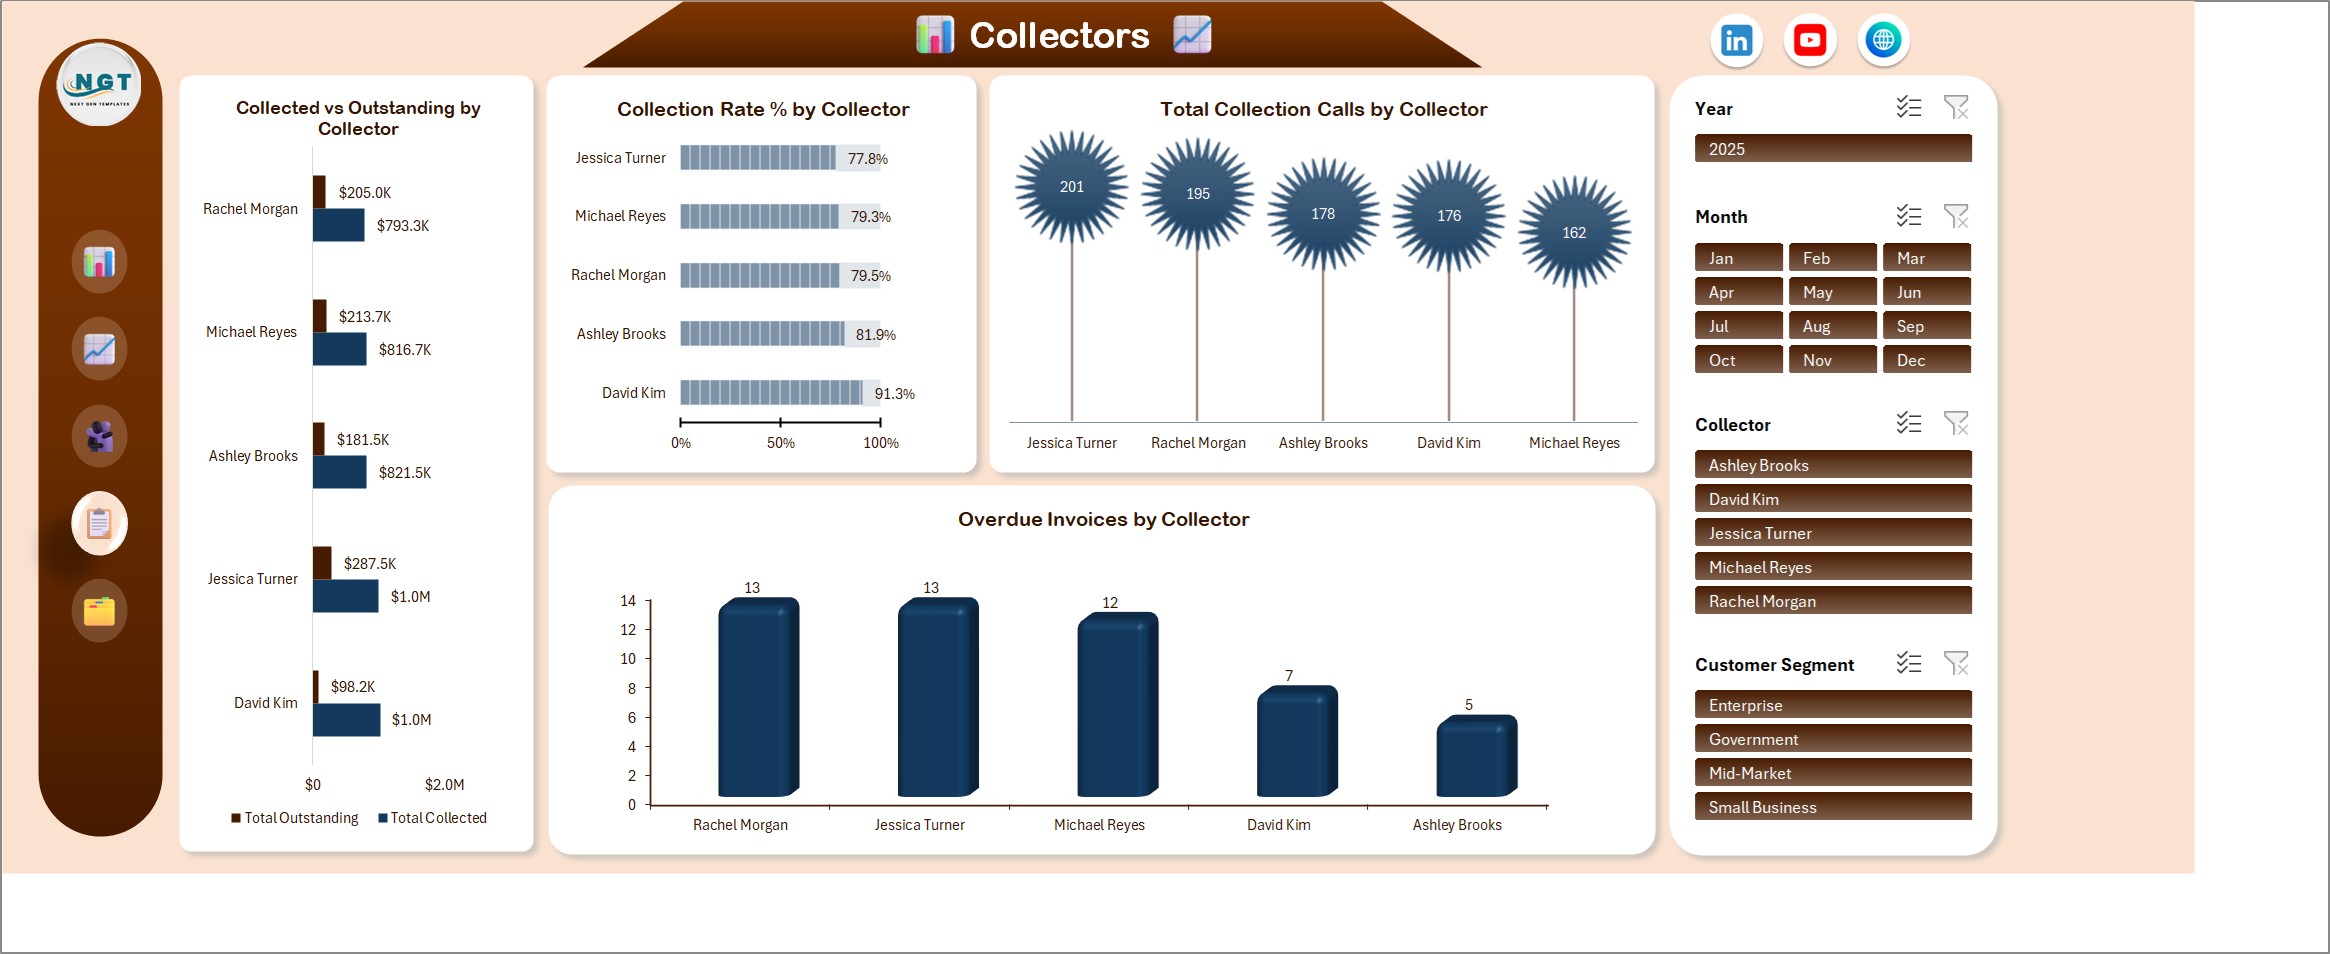
Collectors Page
Collected versus outstanding, collection rate, collection calls and overdue invoices for each collector.
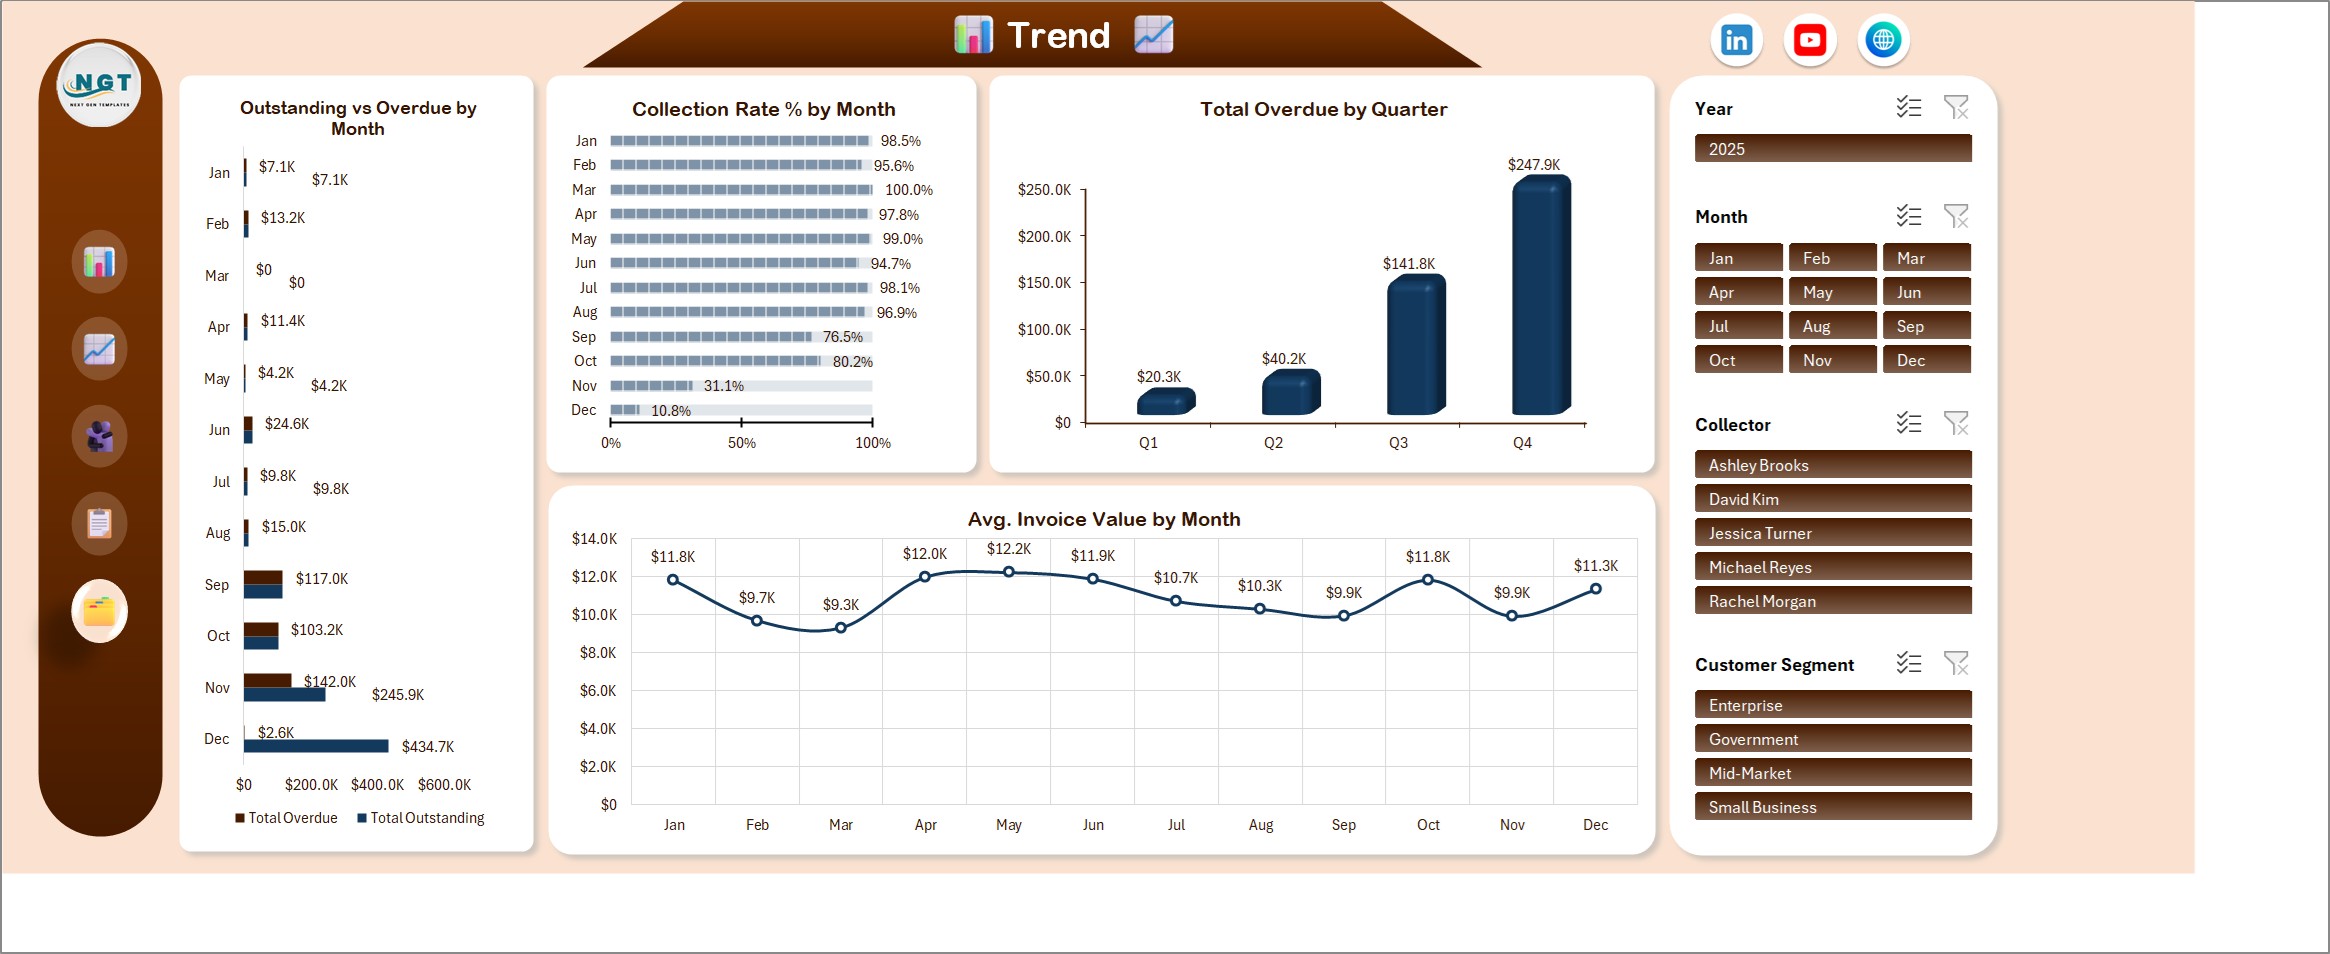
Trend Page
Outstanding versus overdue by month, collection rate by month, overdue by quarter and average invoice value by month.
How It Works
The Data tab holds one row per invoice (see Microsoft Excel support if you are new to pivot tables and slicers). Formula columns work out the outstanding balance, the aging bucket, the overdue amount and the month, year and quarter. A Support tab holds the pivot tables that feed the charts. Four slicers (Year, Month, Collector and Customer Segment) filter all five pages at once, so you can look at one collector or one customer segment in a click.
Pros and Limits
- One screen for outstanding, overdue, DSO and collection rate
- No macros, no add-ins, no subscription
- Works for any invoice list you can paste into the Data tab
- It is not a live connector to accounting software, so you refresh it yourself
- Built for desktop Excel on Windows, Excel 2016 or later, or Microsoft 365
Frequently Asked Questions
Does it connect to my accounting software?
No. It is an add-data-and-refresh workbook. Paste or type your invoices on the Data tab, click Refresh All on the Data tab, and every card, chart and slicer updates. There is no live link to QuickBooks, Xero or any other system.
Does it need macros or add-ins?
No. It uses formulas, pivot tables, charts and slicers only, so there is nothing to enable beyond opening the file.
Which Excel version do I need?
Desktop Excel for Windows, Excel 2016 or later, or Microsoft 365. The slicers and pivot tables do not work fully in Excel for the web.
How is DSO calculated?
The DSO card shows days sales outstanding for the invoices in view. It reacts to the Year, Month, Collector and Customer Segment slicers, so you can see DSO for one collector or one segment.
What are the aging buckets?
Outstanding balances are grouped into 0-30, 31-60, 61-90 and 90+ days, using the due date and the status of each invoice.
Is the sample data real?
No. The 500 invoices on the Data tab are fictional. Replace them with your own and refresh.
Can I keep real customer data in it?
Yes, but remember that an Excel file is only as private as where you store it. Keep your copy somewhere access-controlled and share it with named people only.
Get the Accounts Receivable Aging Dashboard in Excel
Get the dashboard here: Accounts Receivable Aging Dashboard in Excel. For a related finance view, try the Credit Recovery Agencies KPI Dashboard in Excel.