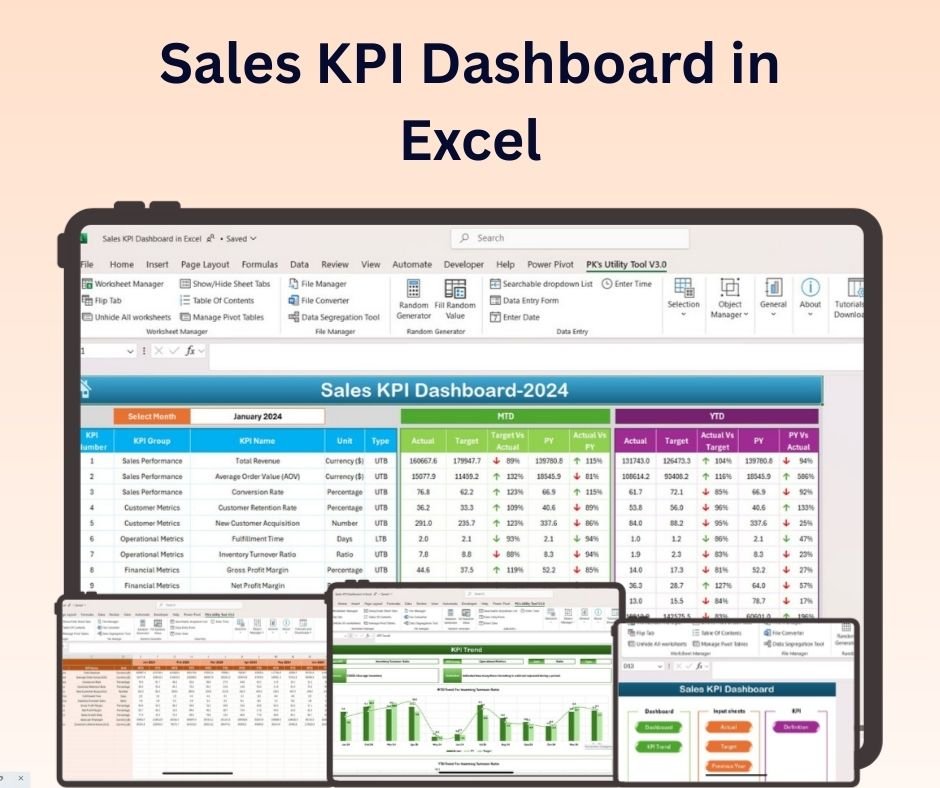
The Sales KPI Dashboard in Excel is an essential tool for sales managers and business owners who need to track and monitor the performance of their sales team and business objectives. This dynamic and interactive dashboard allows you to visualize key sales metrics in real-time, helping you make data-driven decisions, optimize your sales strategies, and track the progress of your sales targets.
With the Sales KPI Dashboard, you can easily monitor essential KPIs such as total sales, sales growth, conversion rates, average deal size, and sales team performance. The tool offers customizable features, allowing you to tailor the dashboard to fit your specific business needs. Whether you’re analyzing the performance of your team, identifying trends in sales, or tracking individual salesperson performance, this Excel dashboard offers a clear and comprehensive view of your sales data.
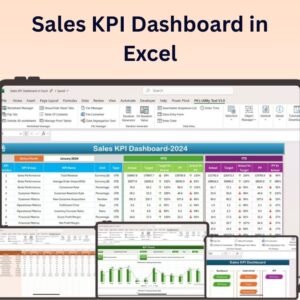
Key Features of the Sales KPI Dashboard in Excel:
📊 Comprehensive Sales KPI Tracking
Track essential sales KPIs, including total sales, conversion rates, average deal size, and sales growth to gain a 360-degree view of your sales performance.
📈 Real-Time Data Updates
Automatically update the dashboard as you enter new sales data, ensuring that you always have the most current information for analysis and decision-making.
🎨 Customizable Layout
Easily adjust the dashboard’s layout and key metrics to match your specific sales goals and business objectives. Tailor the design to fit your company’s branding.
📅 Monthly and Quarterly Tracking
Monitor sales data on a monthly and quarterly basis, helping you identify trends, set new goals, and adjust sales strategies based on performance.
🛠️ User-Friendly Interface
Designed to be intuitive and easy to use, this dashboard enables sales teams to track performance without needing advanced Excel skills.
Why You’ll Love the Sales KPI Dashboard in Excel:
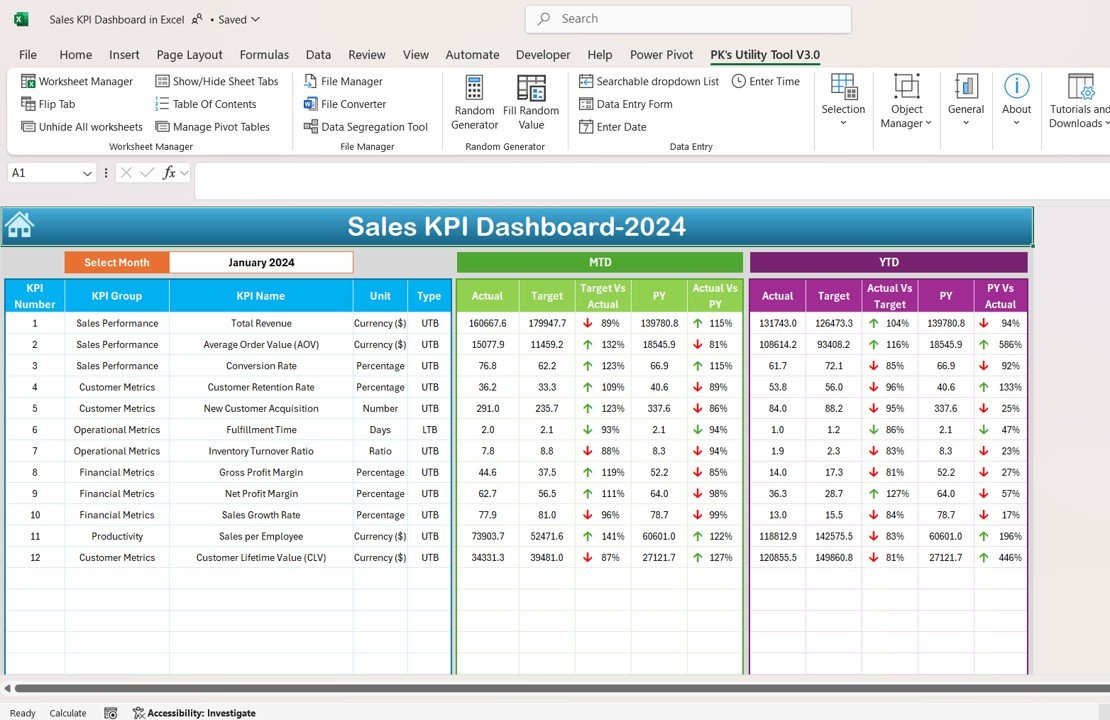
✅ Centralized Sales Insights – All your sales performance data is centralized in one easy-to-use dashboard, making it simple to track and analyze key metrics. ✅ Real-Time Monitoring – Get instant updates as you input new data, allowing you to make timely adjustments to your sales strategies and activities. ✅ Customizable for Your Business – Tailor the dashboard to fit your company’s specific sales objectives, team structure, and metrics. ✅ Easy Data Interpretation – Visualize your data through easy-to-understand charts and graphs, which simplify analysis and help identify trends. ✅ Actionable Insights – Use the data from the dashboard to set new sales targets, optimize team performance, and make data-driven decisions that drive growth.
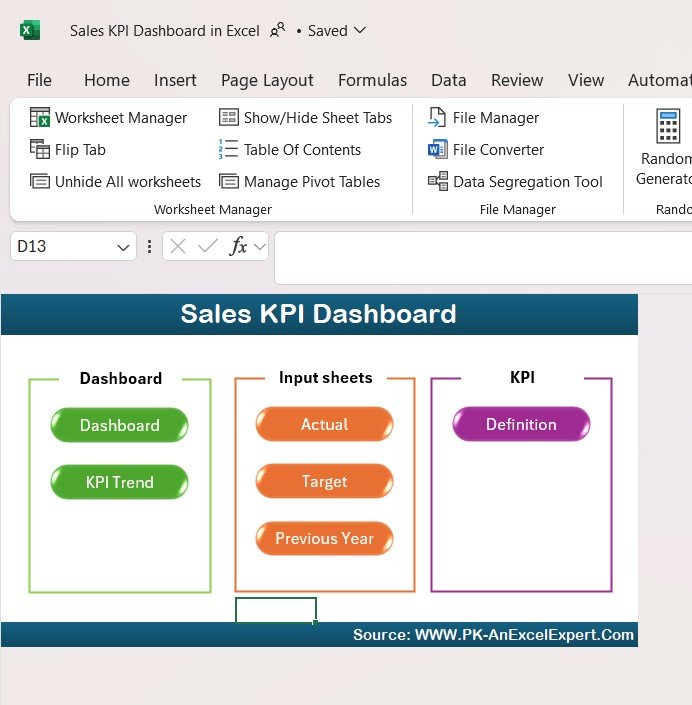
What’s Inside the Sales KPI Dashboard in Excel:
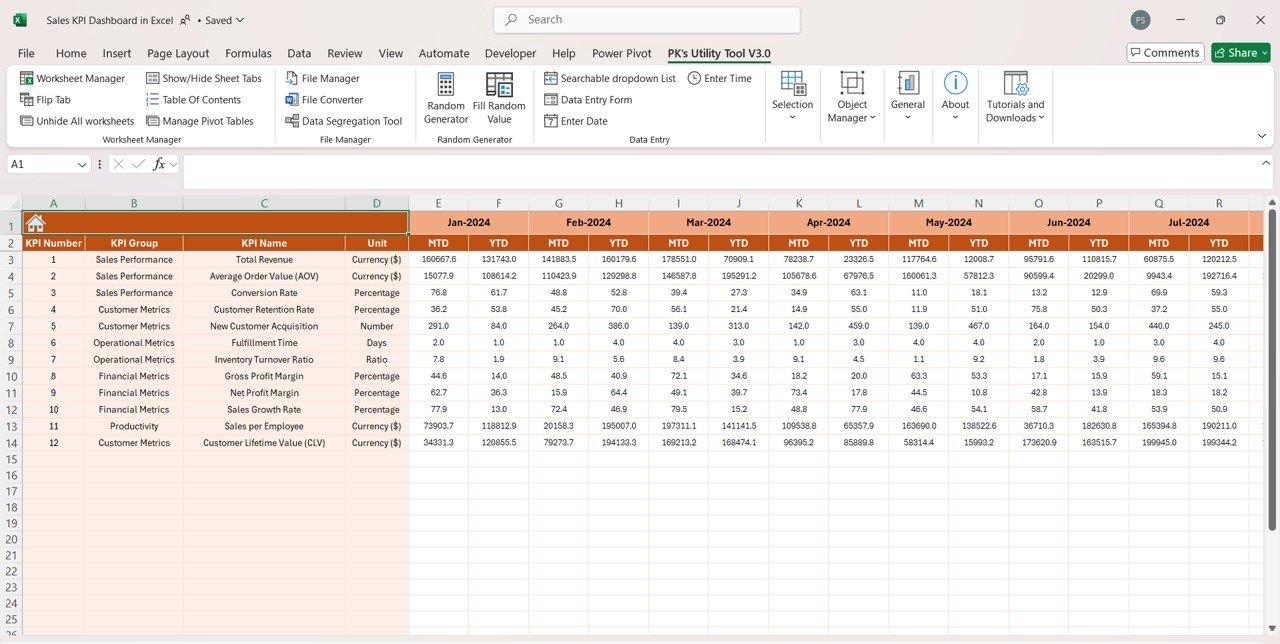
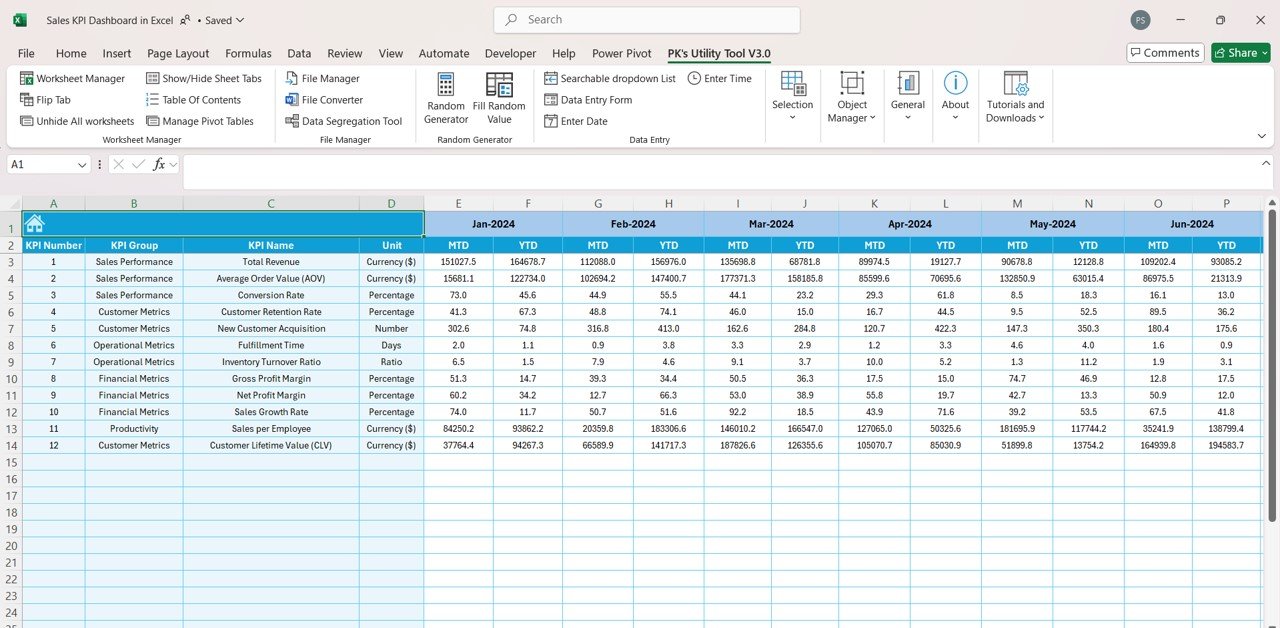
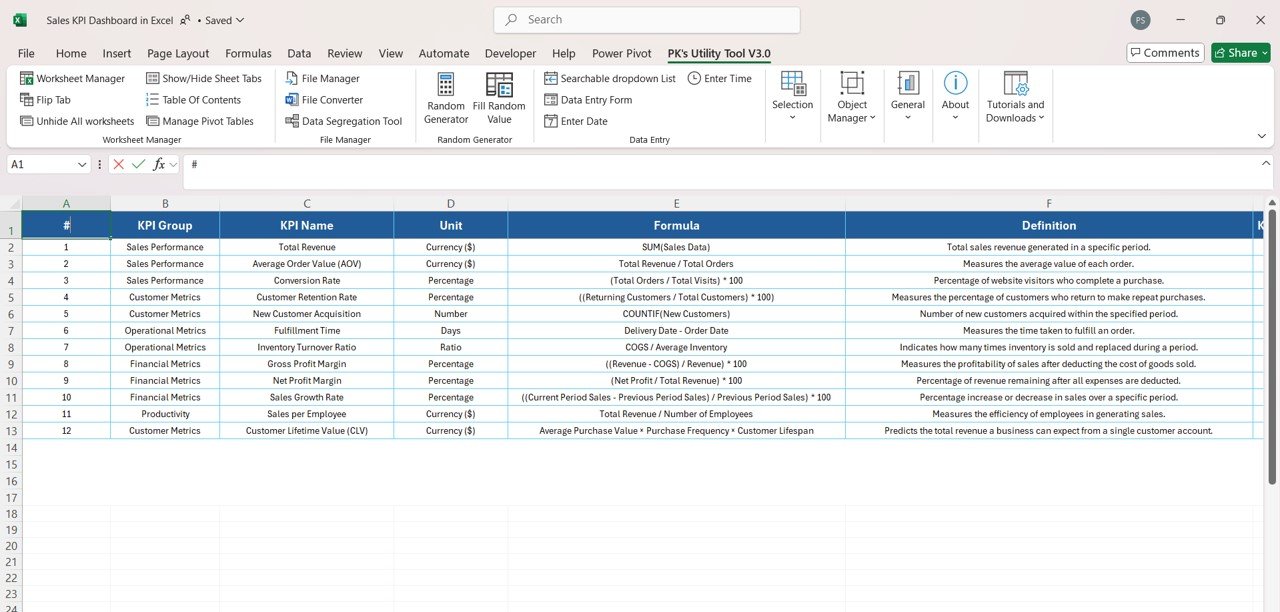
- Key Sales Metrics – Monitor essential metrics like sales volume, growth rate, conversion rate, and average deal size.
- Customizable KPIs – Add or modify the KPIs to reflect the specific metrics that are most important for your business.
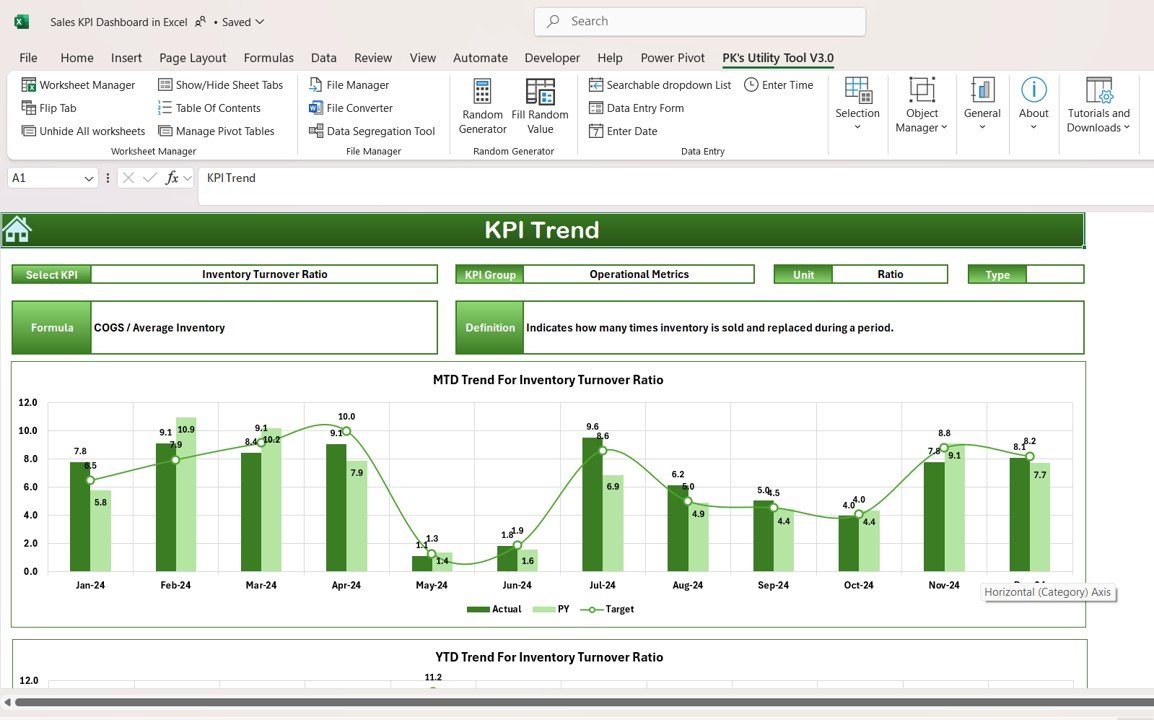
- Interactive Charts – Visualize your sales performance with easy-to-read bar charts, line graphs, and pie charts that display key data.
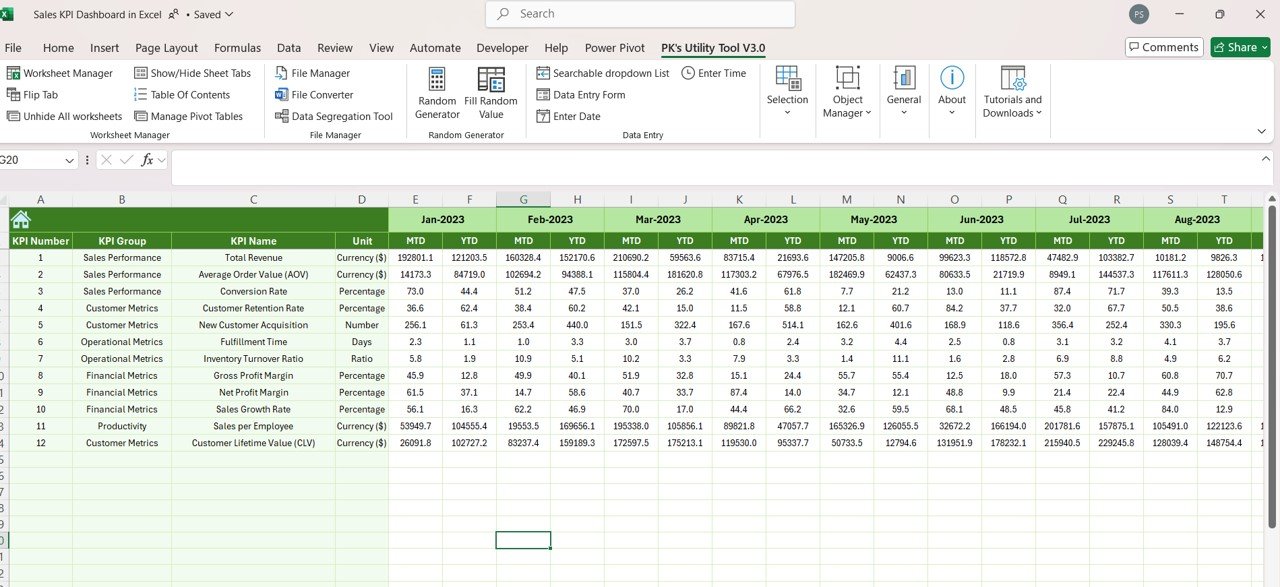
- Monthly and Quarterly Views – Track your sales performance on a monthly and quarterly basis to identify trends and adjust strategies.
- User-Friendly Layout – A simple, clean interface that is easy to navigate and requires no advanced Excel knowledge.
How to Use the Sales KPI Dashboard in Excel:
1️⃣ Download the Template – Get access to the dashboard immediately after purchase. 2️⃣ Input Your Sales Data – Enter your sales figures, such as total sales, deal size, and conversion rates. 3️⃣ Customize the Dashboard – Adjust the dashboard layout, KPIs, and design to match your sales objectives and business needs. 4️⃣ Monitor and Track – Use the dashboard to track sales progress, monitor trends, and assess the performance of your sales team. 5️⃣ Make Informed Decisions – Use the insights provided by the dashboard to refine your sales strategies, set goals, and improve team performance.
Who Can Benefit from the Sales KPI Dashboard in Excel:
- Sales Managers
- Business Owners
- Sales Teams
- Marketing Teams
- Analysts
- Anyone looking to track and optimize their sales performance using data-driven insights
The Sales KPI Dashboard in Excel is a powerful and customizable tool for sales teams and managers who want to monitor performance, optimize strategies, and make data-driven decisions. With its real-time updates, user-friendly interface, and customizable features, this dashboard makes it easier than ever to stay on top of your sales goals and business performance.
Click here to read the Detailed blog post
https://www.pk-anexcelexpert.com/sales-kpi-dashboard-in-excel/


Reviews
There are no reviews yet.