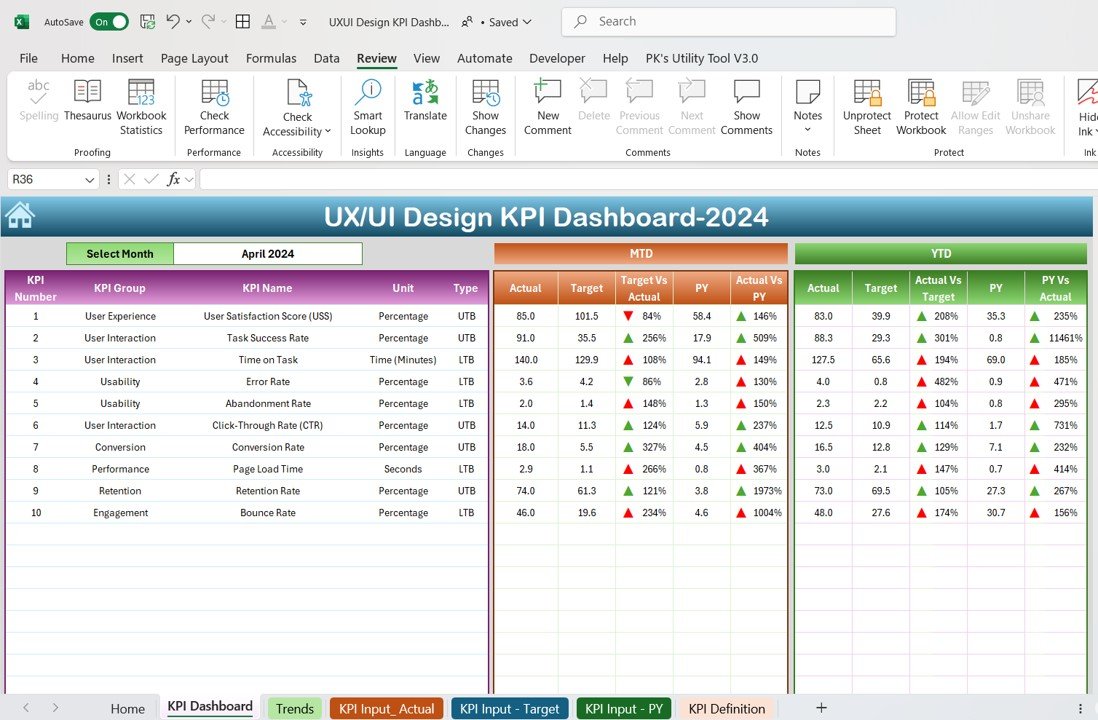

The UX/UI Design KPI Dashboard in Excel is an essential tool for UX/UI designers, product managers, and design teams who want to track the performance and effectiveness of their design processes. This Excel-based dashboard allows you to monitor key performance indicators (KPIs) related to user experience, interface design, and the overall success of your design projects.
With this customizable template, you can track design iteration progress, monitor user feedback, measure design impact on user engagement, and ensure that your projects meet the necessary goals. The dashboard provides a comprehensive overview of your design performance, helping you make data-driven decisions to optimize your design processes, improve user experience, and achieve better design outcomes.
Key Features of the UX/UI Design KPI Dashboard in Excel
🎨 Track Design Progress & Iterations
Monitor the progress of each design iteration, including user testing results, design revisions, and feedback incorporation. Ensure that your design process is iterative and continuously improving based on real user insights.
📊 Measure User Engagement & Feedback
Analyze key user feedback metrics, such as usability scores, NPS (Net Promoter Score), and customer satisfaction ratings. Track how changes to the design impact user engagement and overall satisfaction with the product.
💡 Evaluate Design Quality & Effectiveness
Track design quality metrics like load times, mobile responsiveness, visual aesthetics, and user task completion rates. Measure how well your designs meet user needs and business goals.
📅 Monitor Project Timelines & Deadlines
Stay on track with design deadlines, iterations, and project milestones. Monitor task completion and ensure your design projects are meeting deadlines and staying within scope.
📈 Measure Design Impact on Business KPIs
Connect your design KPIs with broader business metrics, such as conversion rates, customer retention, and sales impact. Understand how design decisions influence overall business success.
🖥️ Customizable & Interactive Dashboard
The dashboard is fully interactive, allowing you to filter data by design project, user segment, or timeframe. Customize the layout to fit your specific design project needs and monitor the most relevant KPIs for your team.
Why You’ll Love the UX/UI Design KPI Dashboard in Excel
✅ Track Design Performance & Progress
Monitor key design metrics such as usability, customer satisfaction, and user engagement to assess the effectiveness of your design iterations.
✅ Optimize User Experience
Use feedback and performance data to improve your design processes and create more intuitive, user-friendly interfaces.
✅ Stay On Schedule with Timelines & Deadlines
Ensure that design projects are completed on time by tracking progress against deadlines and milestones.
✅ Align Design with Business Objectives
Understand how design decisions impact business KPIs such as conversion rates, retention, and user satisfaction, helping you prioritize high-impact design improvements.
✅ Fully Customizable & Scalable
Adapt the dashboard to track the KPIs most important to your design team. Whether you’re working on a single project or multiple design initiatives, this template scales to meet your needs.
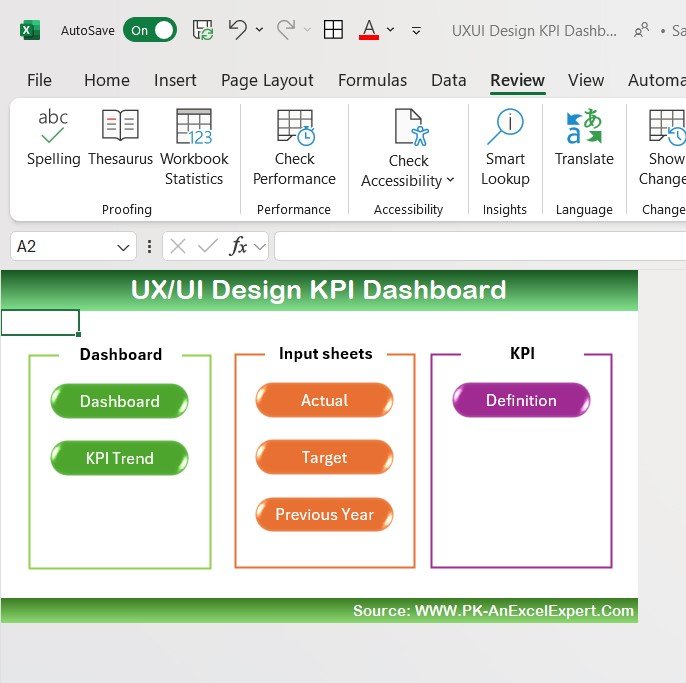
What’s Inside the UX/UI Design KPI Dashboard Template in Excel?
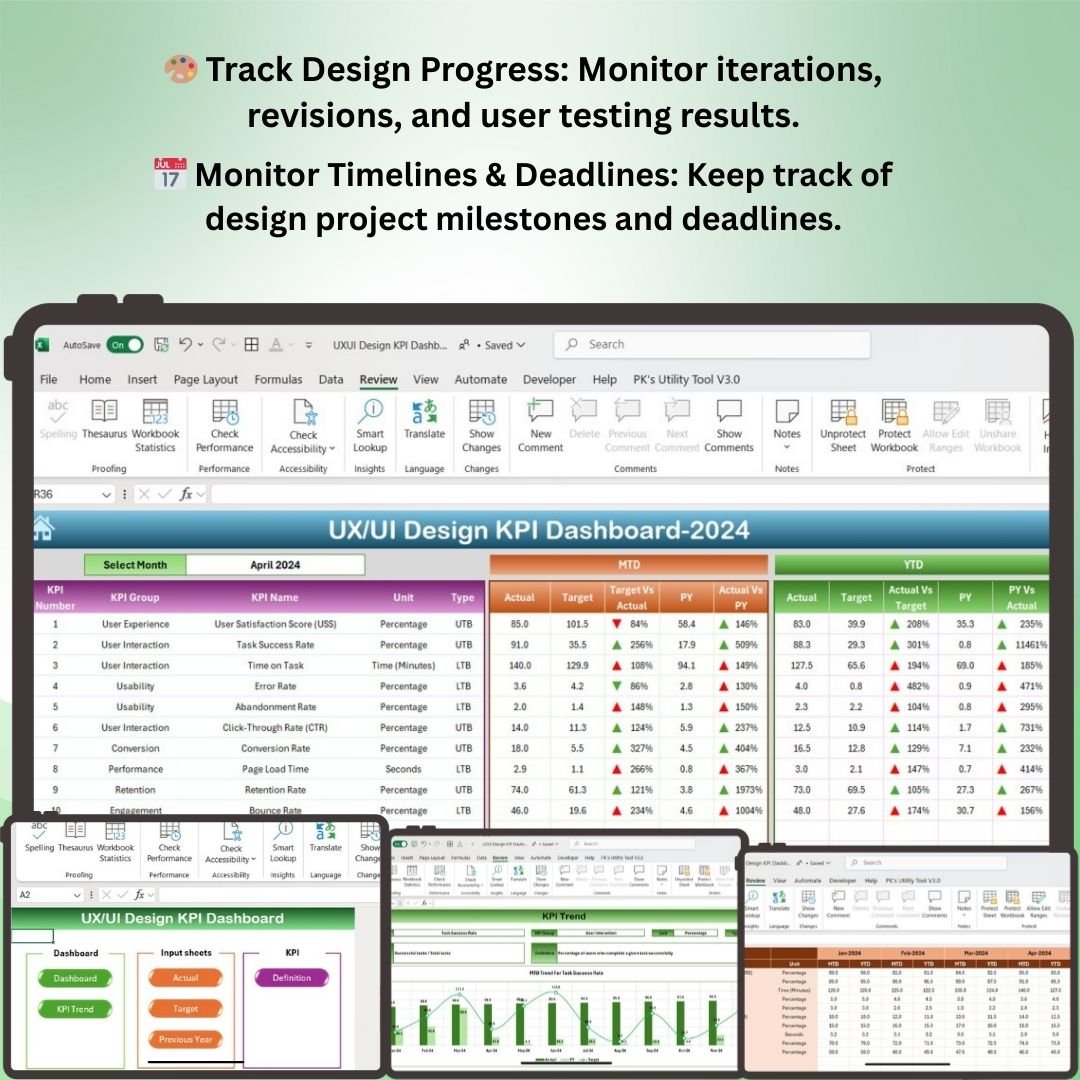
- Design Progress Tracking: Track iterations, revisions, and user testing results for each design project.
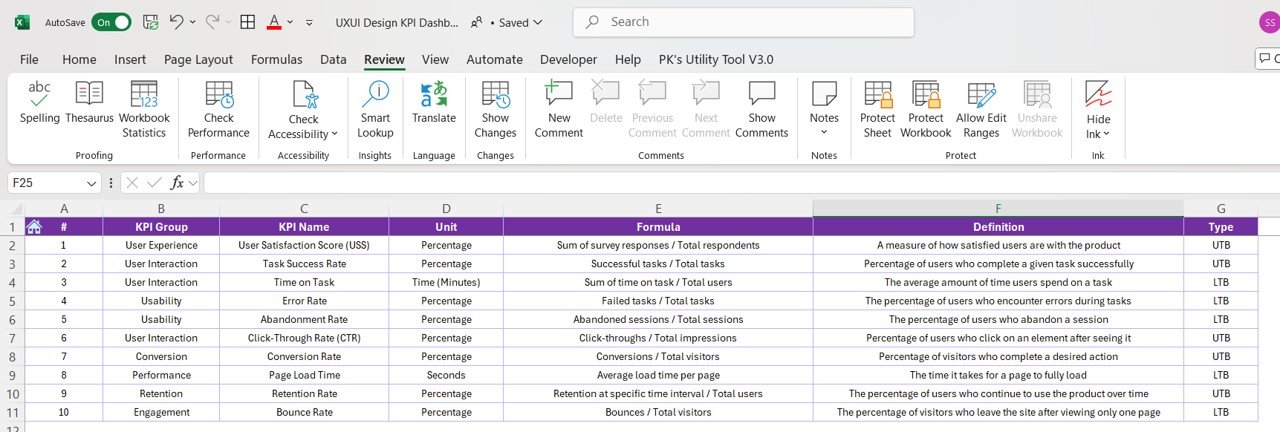
- User Engagement & Feedback Metrics: Monitor key feedback metrics, such as usability scores and customer satisfaction ratings.
- Design Quality & Effectiveness Metrics: Evaluate design quality based on key factors such as load times, mobile responsiveness, and user task completion rates.
- Project Timelines & Deadlines: Track project timelines and ensure your design projects meet deadlines.
- Design Impact on Business KPIs: Monitor how design changes impact broader business outcomes like conversions and sales.
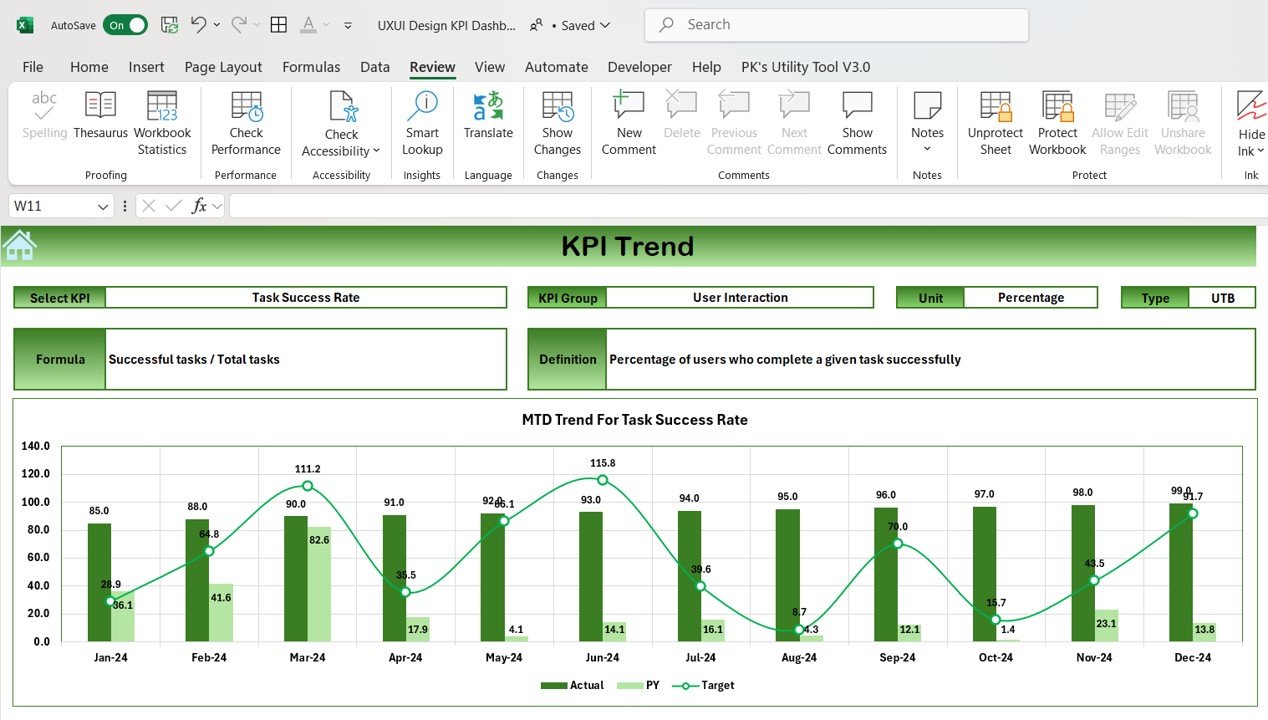
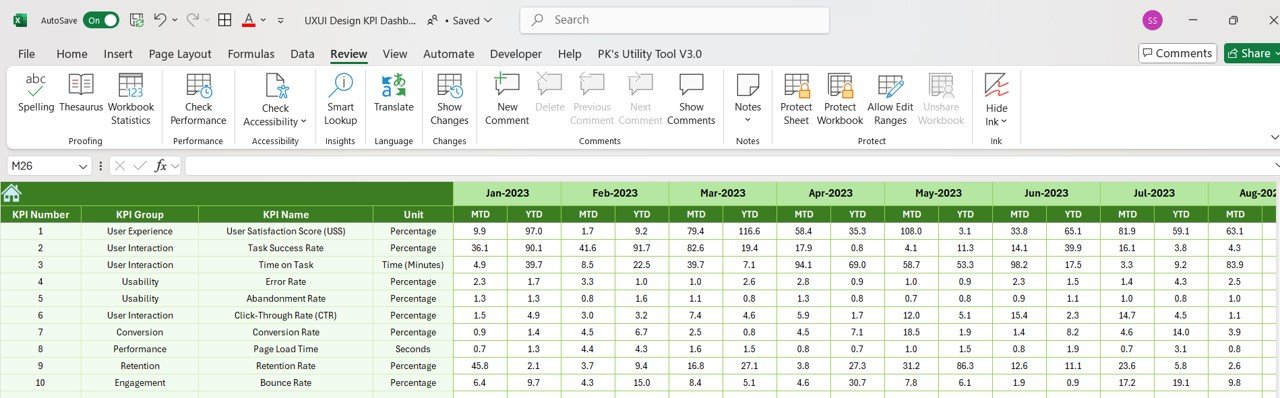
- Interactive Visualizations: Use customizable charts, filters, and slicers to track design performance across different metrics and time periods.
How to Use the UX/UI Design KPI Dashboard in Excel
1️⃣ Download the Template: Get immediate access to the UX/UI Design KPI Dashboard in Excel.
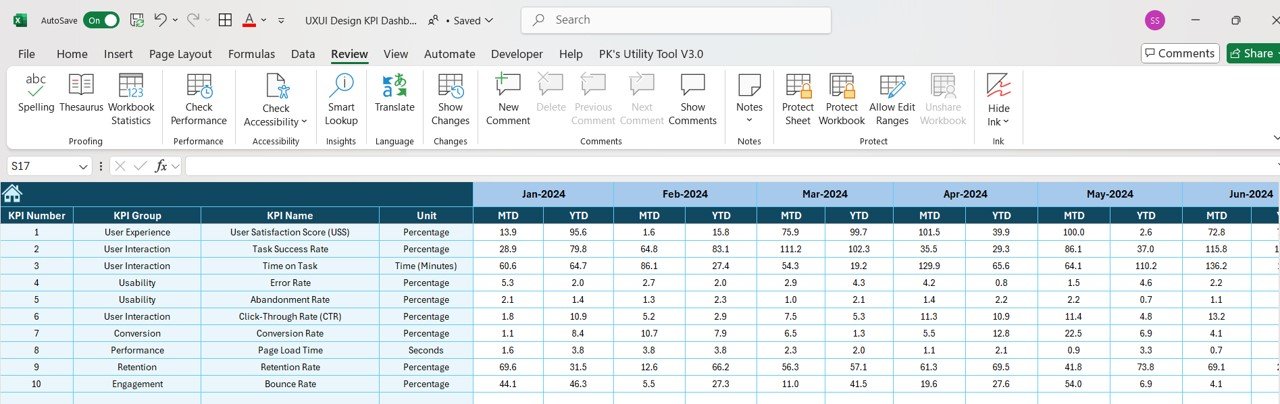
2️⃣ Input Your Design Data: Enter key data on your design progress, user feedback, engagement metrics, and business KPIs.
3️⃣ Track & Monitor Design KPIs: Use the dashboard to monitor metrics like user satisfaction, conversion rates, and design iteration progress.
4️⃣ Analyze & Optimize Your Design Process: Use data insights to optimize your design processes and improve user engagement.
5️⃣ Make Data-Driven Decisions: Use the insights from the dashboard to guide design improvements and align your design projects with business objectives.
Who Can Benefit from the UX/UI Design KPI Dashboard in Excel?
🔹 UX/UI Designers & Design Teams
🔹 Product Managers & Project Managers
🔹 Marketing & Customer Experience Teams
🔹 User Researchers & Analysts
🔹 Digital Agencies & Freelancers
🔹 Companies Looking to Improve User Experience
Take control of your design projects and optimize your user experience strategies with the UX/UI Design KPI Dashboard in Excel. Monitor design progress, measure impact, and ensure your designs align with user needs and business goals.
Click here to read the Detailed blog post
Visit our YouTube channel to learn step-by-step video tutorials
Youtube.com/@PKAnExcelExpert


Reviews
There are no reviews yet.