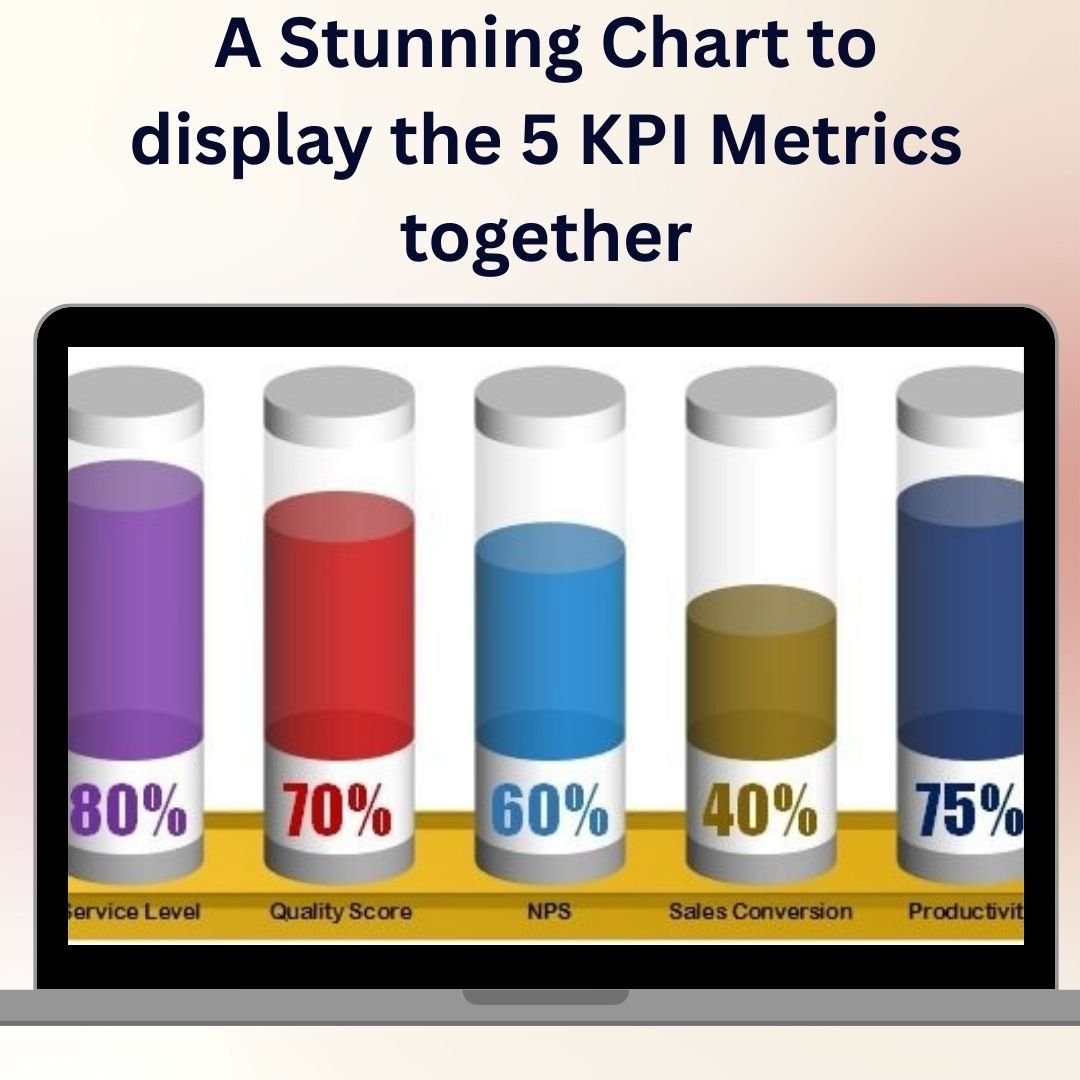
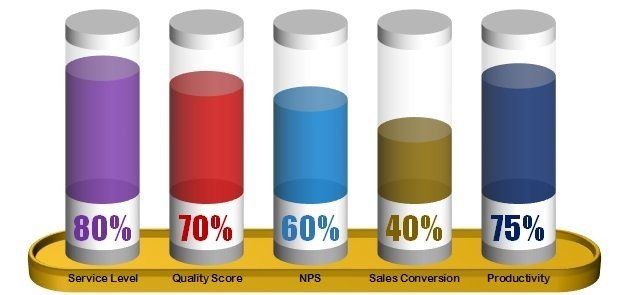
A Stunning Chart to Display the 5 KPI Metrics Together is a dynamic and visually appealing Excel template designed to showcase five key performance indicators (KPIs) on a single, easy-to-read chart. Whether you’re tracking sales, revenue, customer satisfaction, productivity, or any other important business metric, this template helps you bring together the most essential KPIs in one place, making it easier to monitor and compare performance at a glance.
With this stunning chart, you can effortlessly display your KPIs using a combination of dynamic visuals and data-driven insights. It’s ideal for business managers, analysts, and executives who need to track multiple metrics in one interactive chart. The chart automatically updates as new data is entered, offering real-time insights into the health of your business, team, or project.
Key Features of A Stunning Chart to Display the 5 KPI Metrics Together in Excel
📊 Display 5 KPIs Simultaneously
Track and display five critical KPIs in one chart, making it easy to compare and monitor performance across different metrics, all in one view.
📈 Interactive & Customizable Design
Fully customizable with options to change chart colors, data labels, and layout to suit your needs. The interactive features allow you to drill down into specific KPIs for more detailed analysis.
🔄 Real-Time Data Updates
As you update your data, the chart dynamically reflects the changes, ensuring that you always have the most accurate and up-to-date information for decision-making.
📉 Compare Metrics Across Time
Use the chart to visualize trends over time for each KPI, making it easier to identify patterns, successes, and areas needing improvement.
📏 Clear Visual Representation
With a stunning, easy-to-read design, this chart allows you to clearly communicate your KPIs to stakeholders, executives, and team members, enhancing your presentations and reports.
Why You’ll Love A Stunning Chart to Display the 5 KPI Metrics Together
✅ Track Multiple KPIs in One Place
No need to juggle multiple reports or dashboards. Track five key metrics in one chart for better clarity and improved decision-making.
✅ Get Real-Time Performance Insights
With dynamic data updates, this chart provides up-to-date performance insights, allowing you to make informed decisions quickly.
✅ Visualize Trends & Patterns
Analyze trends over time for each KPI, helping you spot patterns, identify potential issues, and make proactive adjustments to improve performance.
✅ Easy to Use & Customize
This chart is simple to use, with a user-friendly interface that allows you to customize it to your specific business needs, ensuring that it works for any KPI tracking scenario.
✅ Perfect for Presentations & Reports
Use this chart in your business presentations, meetings, or reports to effectively communicate your key performance metrics in a clear and visually appealing format.
What’s Inside A Stunning Chart to Display the 5 KPI Metrics Together Template?
- Five Key Metrics Display: Track and display up to five KPIs side by side for easy comparison.
- Dynamic & Interactive Chart: Customizable design that updates automatically as you input data.
- Trend Analysis: Visualize KPI trends over different time periods.
- Customizable Design: Adjust the colors, labels, and layout to suit your business needs.
- Real-Time Data Updates: Ensure your chart reflects the latest information as soon as new data is entered.
How to Use A Stunning Chart to Display the 5 KPI Metrics Together in Excel
1️⃣ Download the Template: Get instant access to the Excel template.
2️⃣ Input Your Data: Enter your five KPIs and the corresponding values.
3️⃣ Customize the Design: Adjust chart colors, labels, and layout as needed.
4️⃣ Track & Visualize KPIs: Use the chart to track, compare, and visualize your key performance metrics in real-time.
Who Can Benefit from A Stunning Chart to Display the 5 KPI Metrics Together?
🔹 Business Owners & Entrepreneurs
🔹 Sales Managers & Marketing Teams
🔹 Project Managers & Team Leaders
🔹 Executives & Senior Management
🔹 Data Analysts & Business Analysts
🔹 Anyone Tracking Key Performance Metrics in Business or Projects
Stay on top of your performance and visualize key metrics effectively with A Stunning Chart to Display the 5 KPI Metrics Together. Monitor your KPIs in one stunning, easy-to-read chart and make data-driven decisions with confidence.
Click here to read the Detailed blog post
Visit our YouTube channel to learn step-by-step video tutorials
Youtube.com/@PKAnExcelExpert


Reviews
There are no reviews yet.