In today’s rapidly growing healthcare industry, medical tourism has become a key driver of global patient care. Patients travel across countries for better treatments, cost efficiency, and advanced healthcare services. However, managing such a complex system requires accurate tracking of KPIs, financial performance, and patient outcomes.
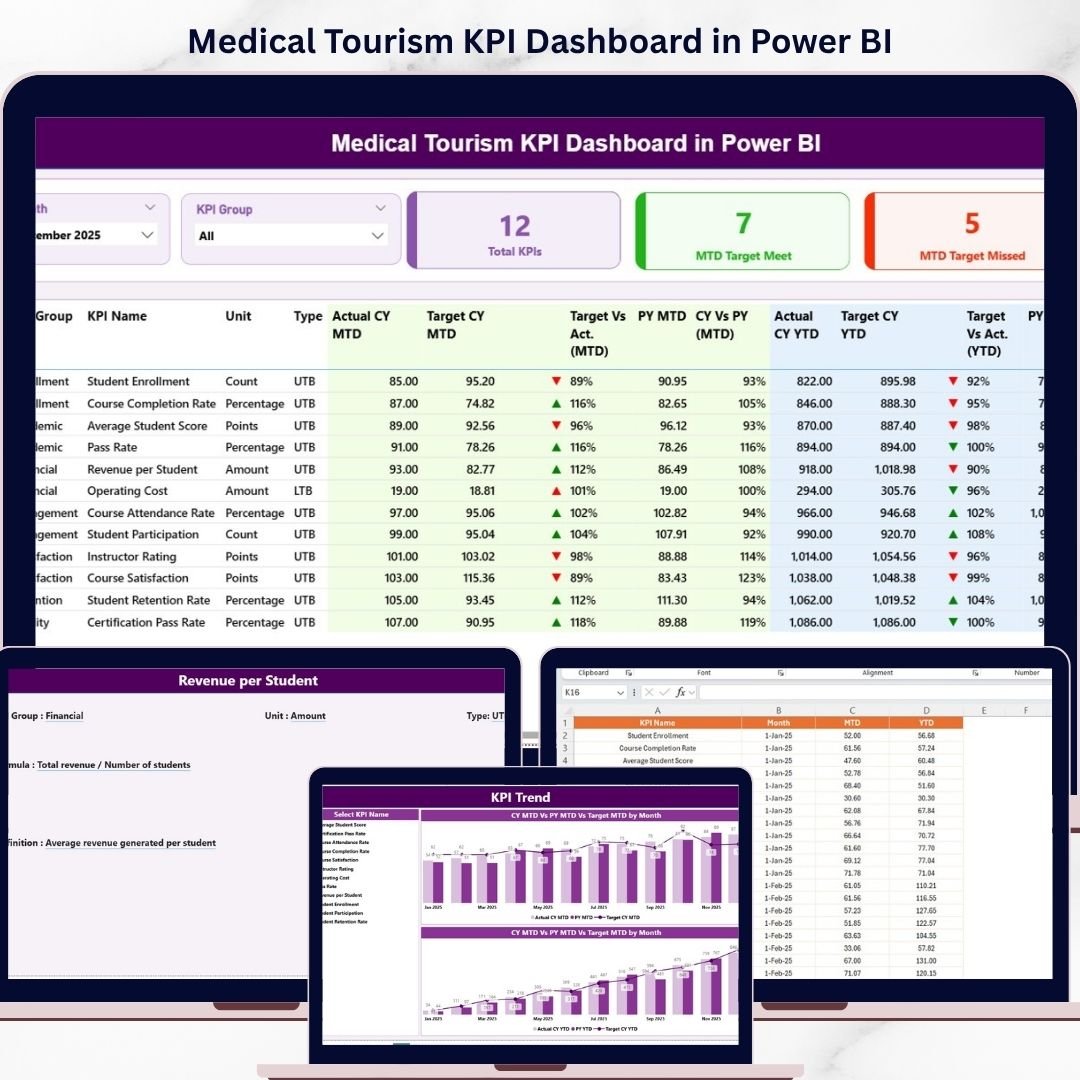
Medical Tourism KPI Dashboard in Power BI — a powerful, interactive solution designed to help healthcare organizations monitor performance, track KPIs, and make smarter decisions.
This dashboard consolidates all critical data into a single, easy-to-understand interface. Instead of relying on multiple reports and spreadsheets, you can now analyze performance, compare targets, and track trends in real time. As a result, decision-makers can act faster and improve both operational efficiency and patient satisfaction.
🚀 Key Features of Medical Tourism KPI Dashboard in Power BI
📊 Centralized KPI Dashboard – Monitor all key performance indicators in one place.
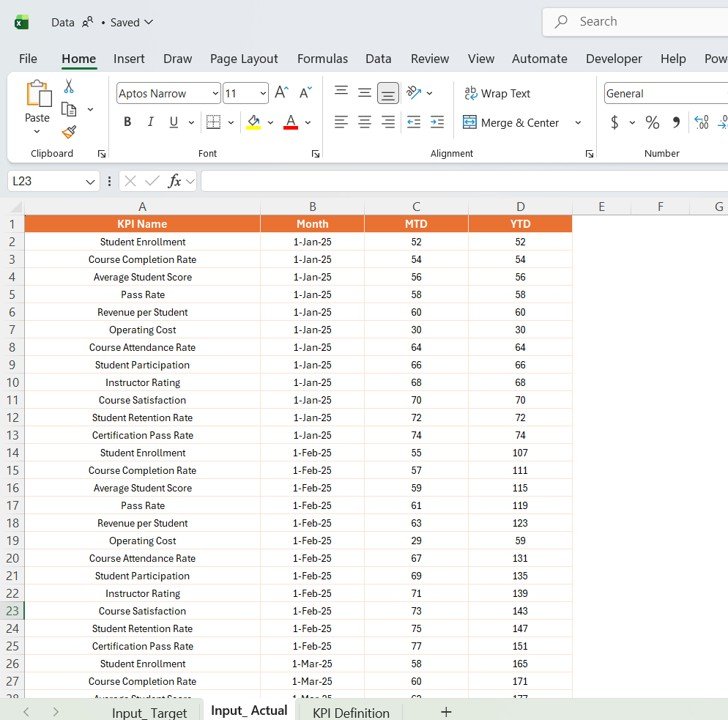
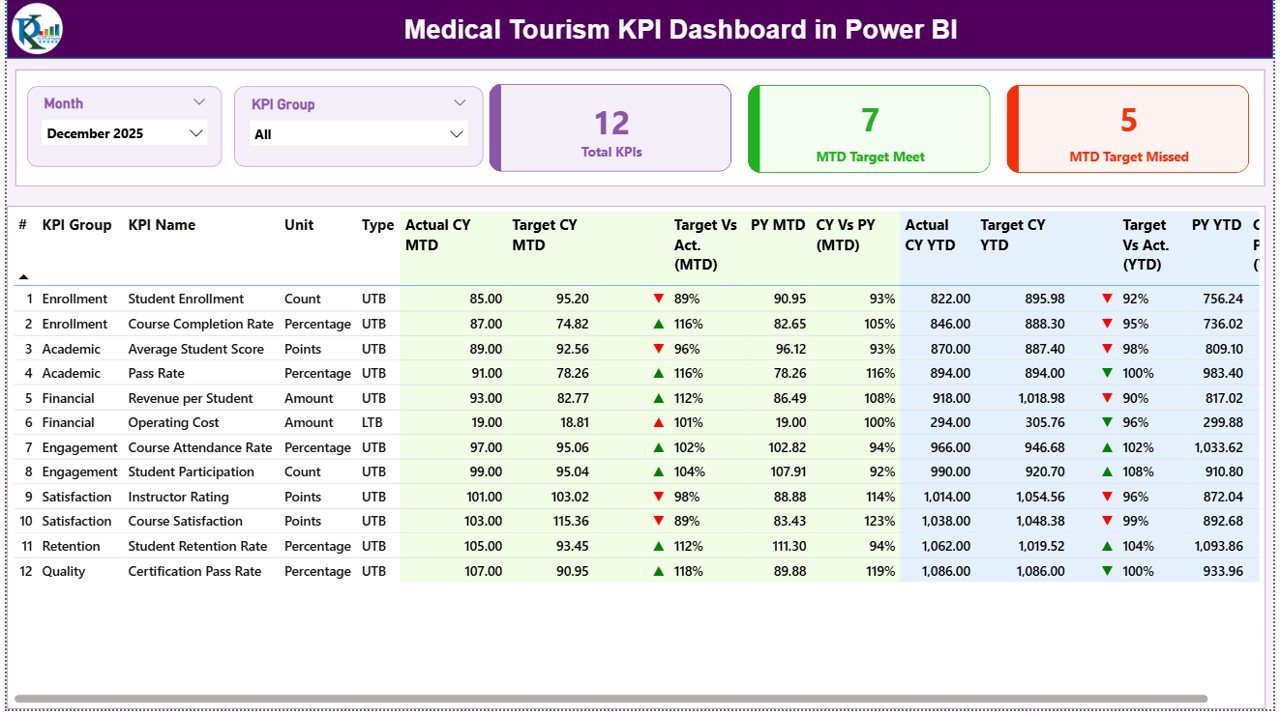
📅 MTD & YTD Performance Tracking – Compare Actual, Target, and Previous Year metrics.
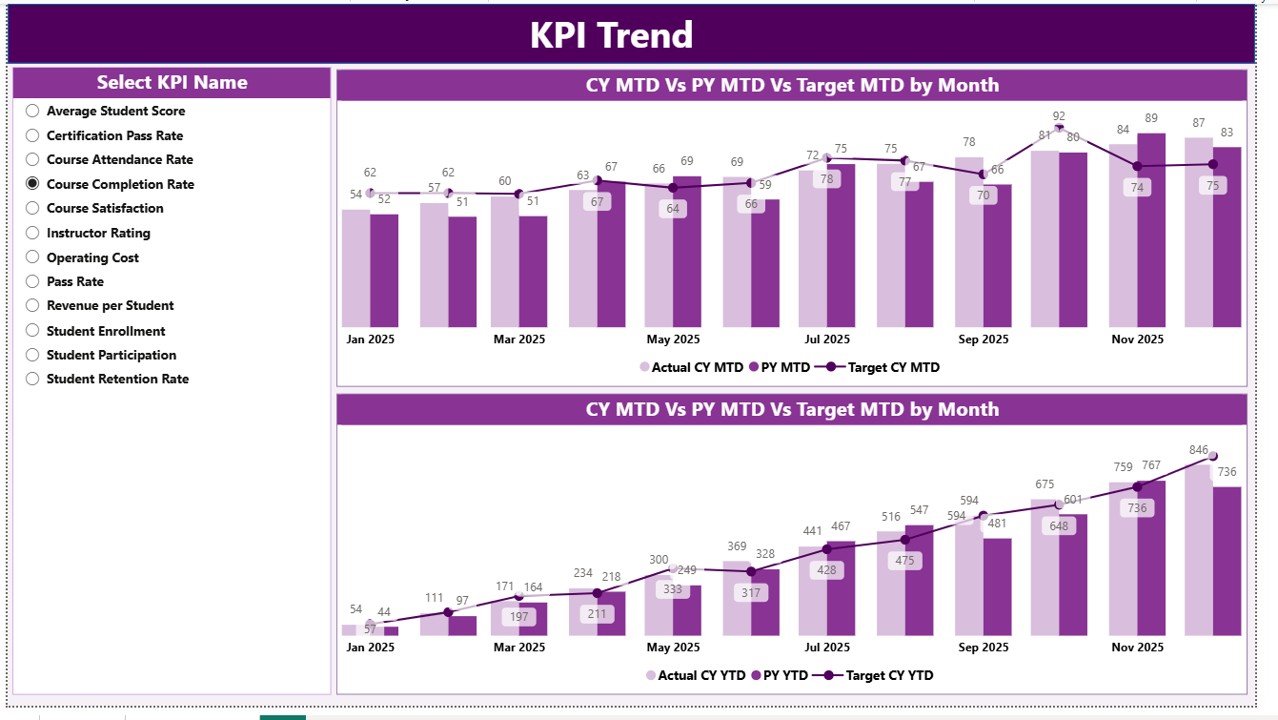
📈 Interactive Trend Analysis – Visualize KPI trends over time with dynamic charts.
🔺 Performance Indicators – Instantly identify performance gaps using visual icons.
🎯 Advanced Slicers & Filters – Filter data by month and KPI group for deeper insights.
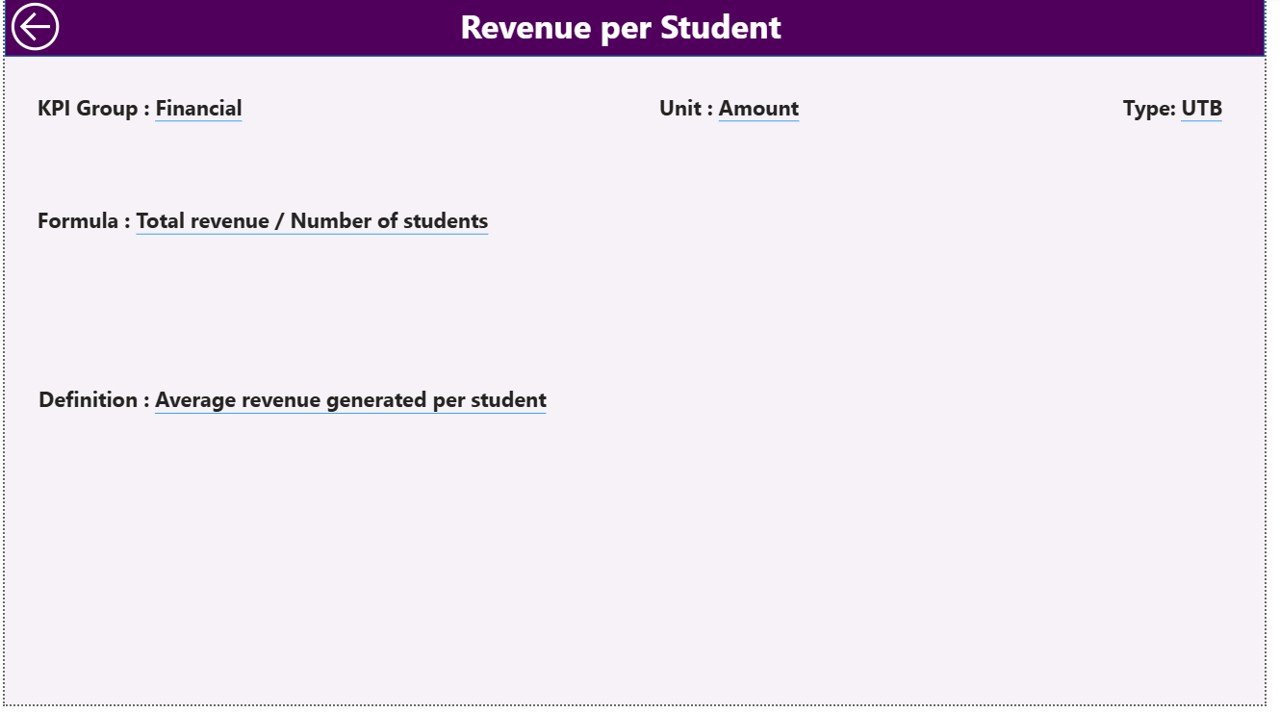
📘 KPI Drill-Through Feature – Access detailed KPI definitions and formulas instantly.
⚡ Real-Time Data Insights – Keep your dashboard updated with refresh functionality.
📉 Target vs Actual Comparison – Evaluate performance with clear percentage comparisons.
📂 What’s Inside the Medical Tourism KPI Dashboard in Power BI
This dashboard includes 3 powerful and interactive pages for complete KPI analysis:
📌 Summary Page
Get a complete overview of all KPIs with MTD and YTD tracking, target comparisons, and performance indicators.
📌 KPI Trend Page
Analyze KPI performance trends using combo charts comparing current year, previous year, and target values.
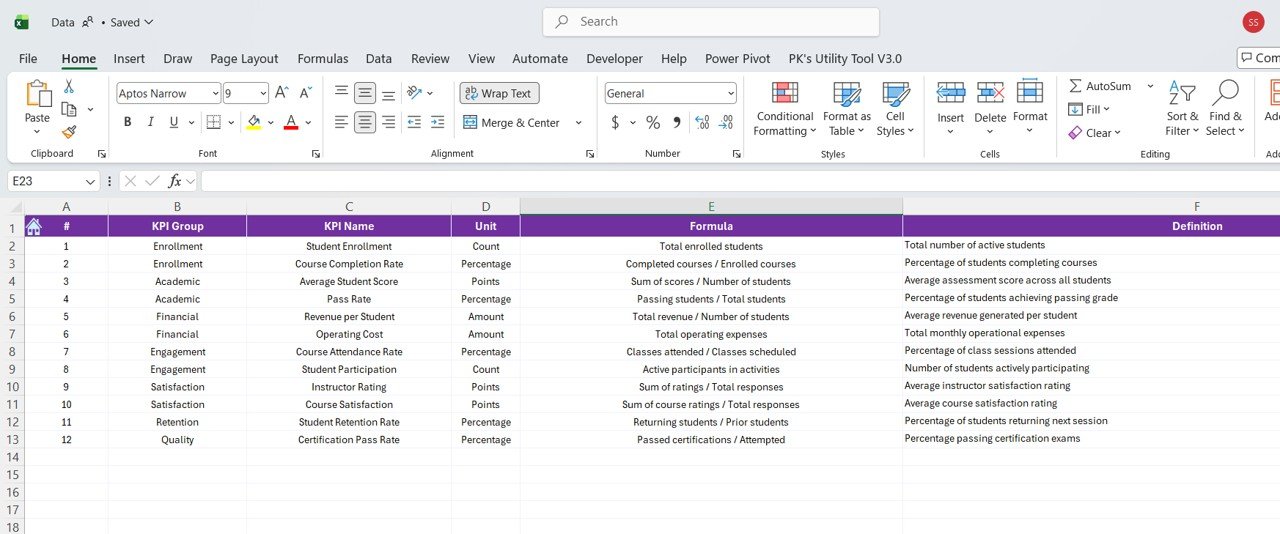
📌 KPI Definition Page (Drill-Through)
Understand KPI formulas, definitions, and types with detailed insights for accurate analysis.
🛠️ How to Use the Medical Tourism KPI Dashboard in Power BI
Using this dashboard is simple and efficient:
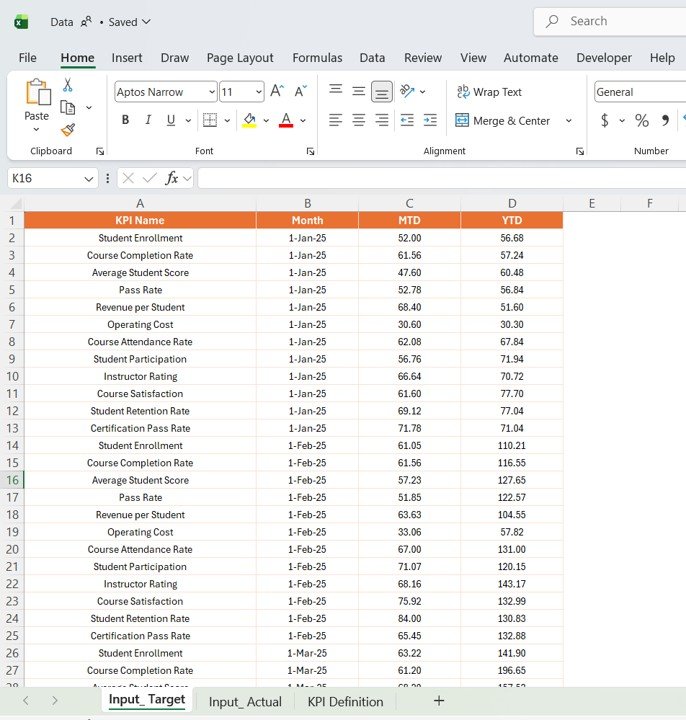
1️⃣ Connect or upload your Excel data source
2️⃣ Open the Power BI file
3️⃣ Click on Refresh to update data
4️⃣ Use slicers to filter by month or KPI group
5️⃣ Analyze KPI performance on the Summary page
6️⃣ Explore trends in the KPI Trend page
7️⃣ Drill through for KPI definitions and deeper insights
Within minutes, you can transform raw healthcare data into actionable insights.
👥 Who Can Benefit from This Medical Tourism KPI Dashboard in Power BI
This dashboard is ideal for:
🏥 Hospital Administrators managing patient flow and performance
📊 Healthcare Analysts tracking KPIs and trends
🌍 Medical Tourism Agencies monitoring operations and growth
💼 Finance Teams analyzing cost and profitability
📈 Consultants optimizing healthcare strategies
Whether you are managing a hospital or a medical tourism business, this dashboard helps you stay competitive and data-driven.
With this dashboard, you no longer need manual reports or scattered data sources. Everything is automated, interactive, and easy to understand. As a result, you save time, improve accuracy, and make faster decisions.
So, if you want to track KPIs efficiently, improve patient outcomes, and optimize your medical tourism operations, this dashboard is the perfect solution.


