Managing arts and cultural programs today requires more than creativity — it demands smart decision-making powered by data. Museums, galleries, cultural institutions, art festivals, and event organizers manage multiple activities simultaneously, including budgeting, artist coordination, venue performance, visitor engagement, and revenue tracking. However, many organizations still depend on disconnected spreadsheets and manual reporting systems, making performance evaluation slow and inefficient.
The Arts and Culture Dashboard in Power BI is designed to change that completely.
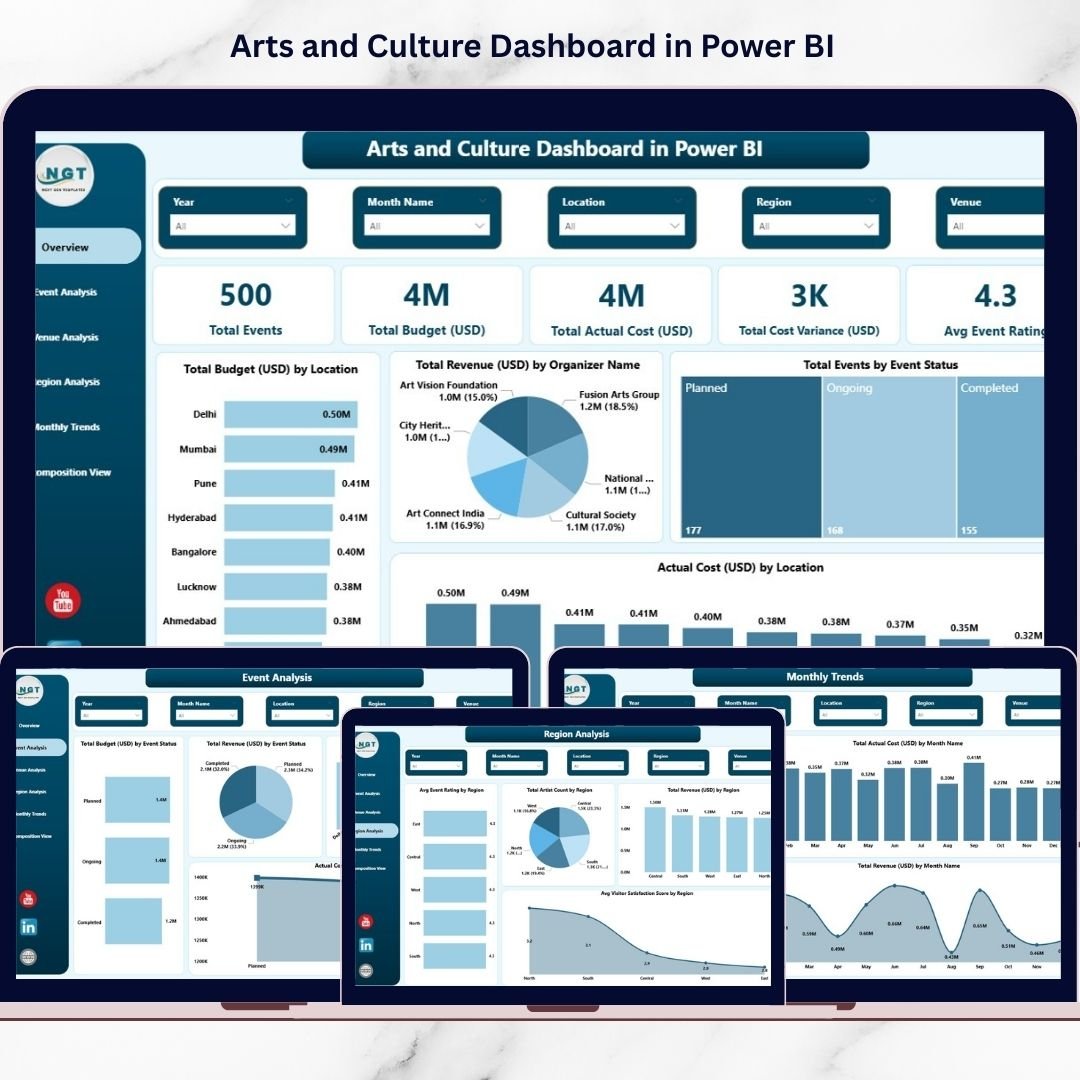
This ready-to-use interactive dashboard transforms complex cultural data into clear, visual insights that help organizations monitor performance, control budgets, and enhance audience experiences — all from one centralized platform. Instead of spending hours compiling reports, decision-makers can instantly analyze event outcomes and identify improvement opportunities.
Built using Microsoft Power BI, this dashboard combines powerful analytics with easy usability, allowing both technical and non-technical users to explore cultural performance through dynamic visuals and filters.
Whether you manage art exhibitions, cultural festivals, public programs, or creative initiatives, this dashboard helps you move from guesswork to data-driven strategy.
🚀 Key Feature of Arts and Culture Dashboard in Power BI
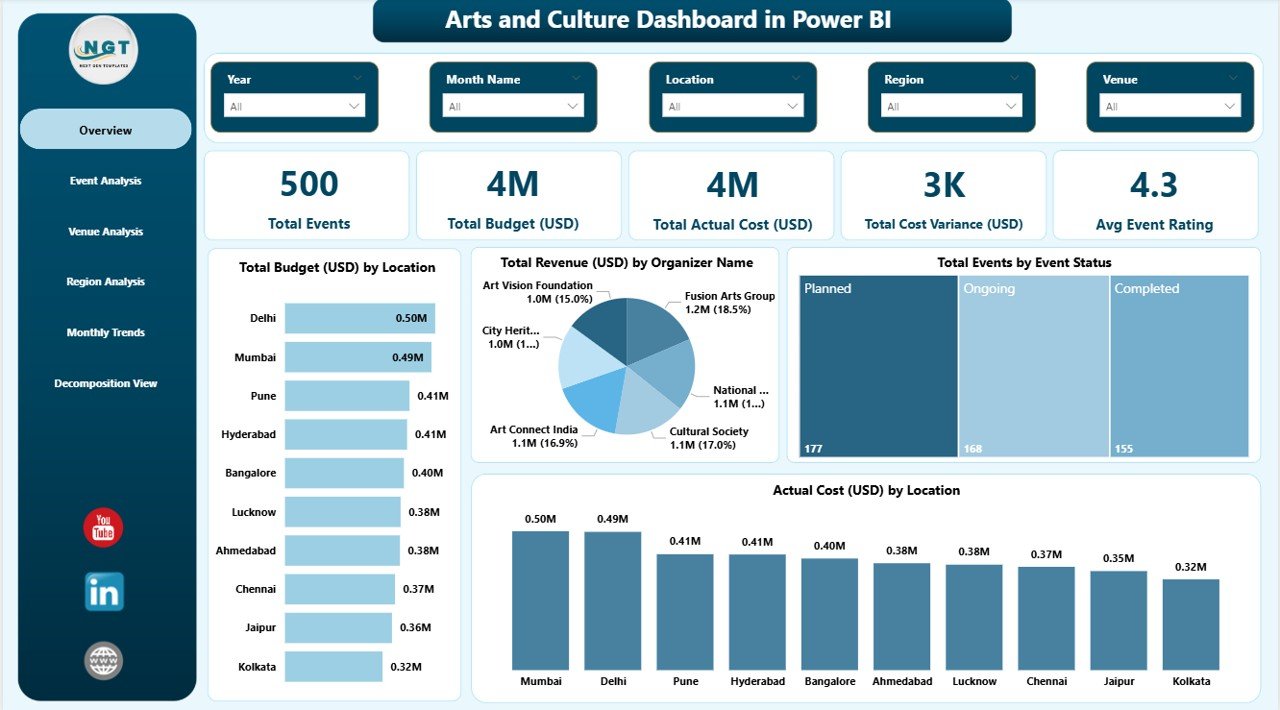
✨ Interactive KPI overview showing total events, budgets, costs, and ratings
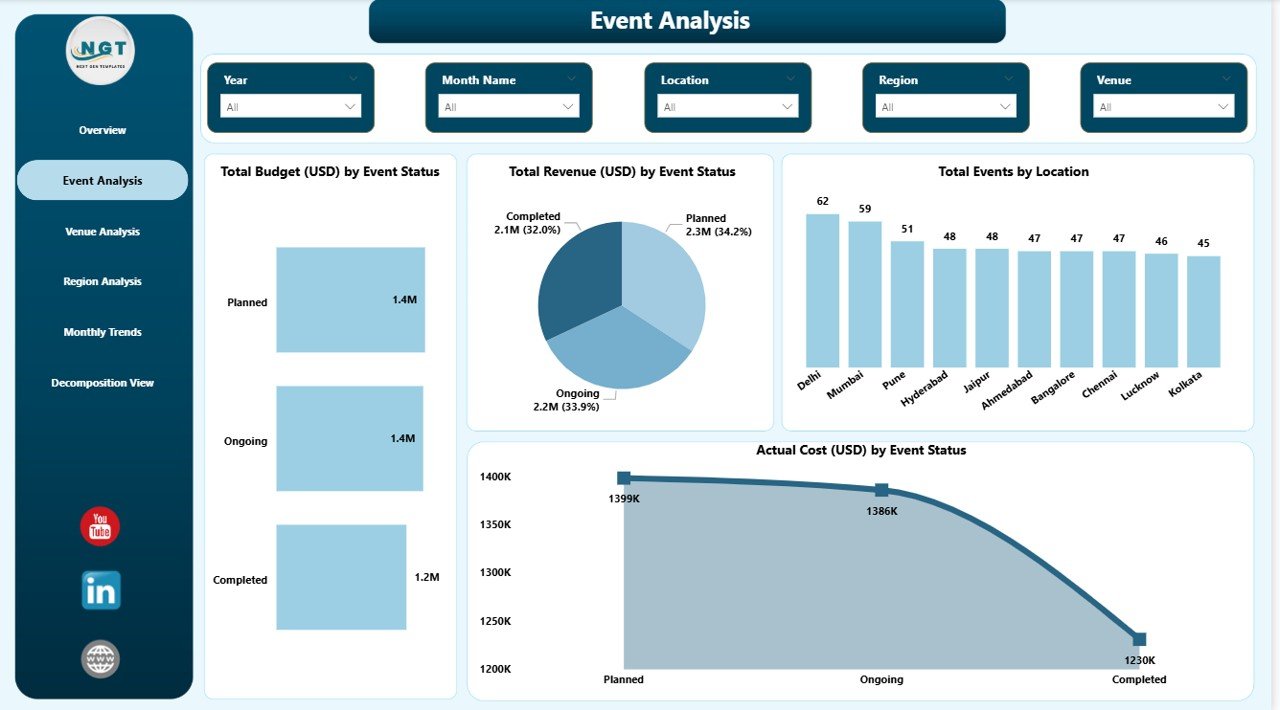
📊 Event performance analysis with revenue and cost comparisons
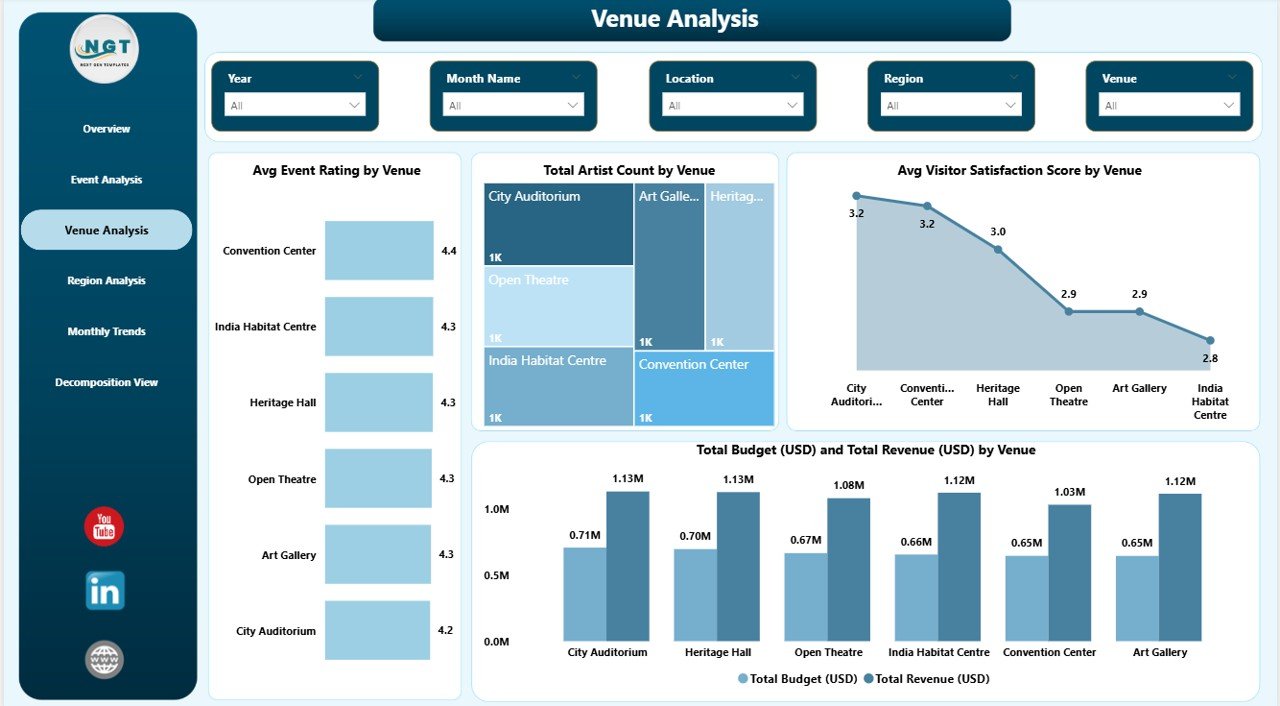
🏛 Venue performance insights including visitor satisfaction and artist participation
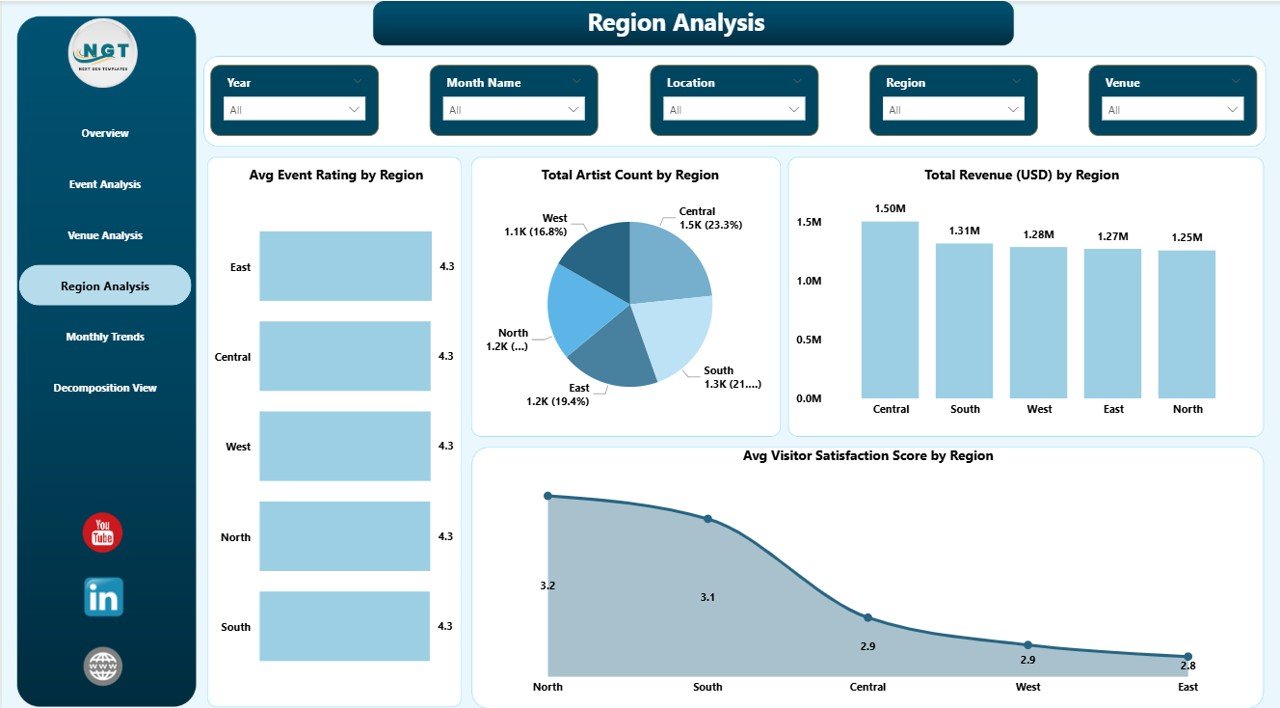
🌍 Regional comparison dashboards for strategic planning
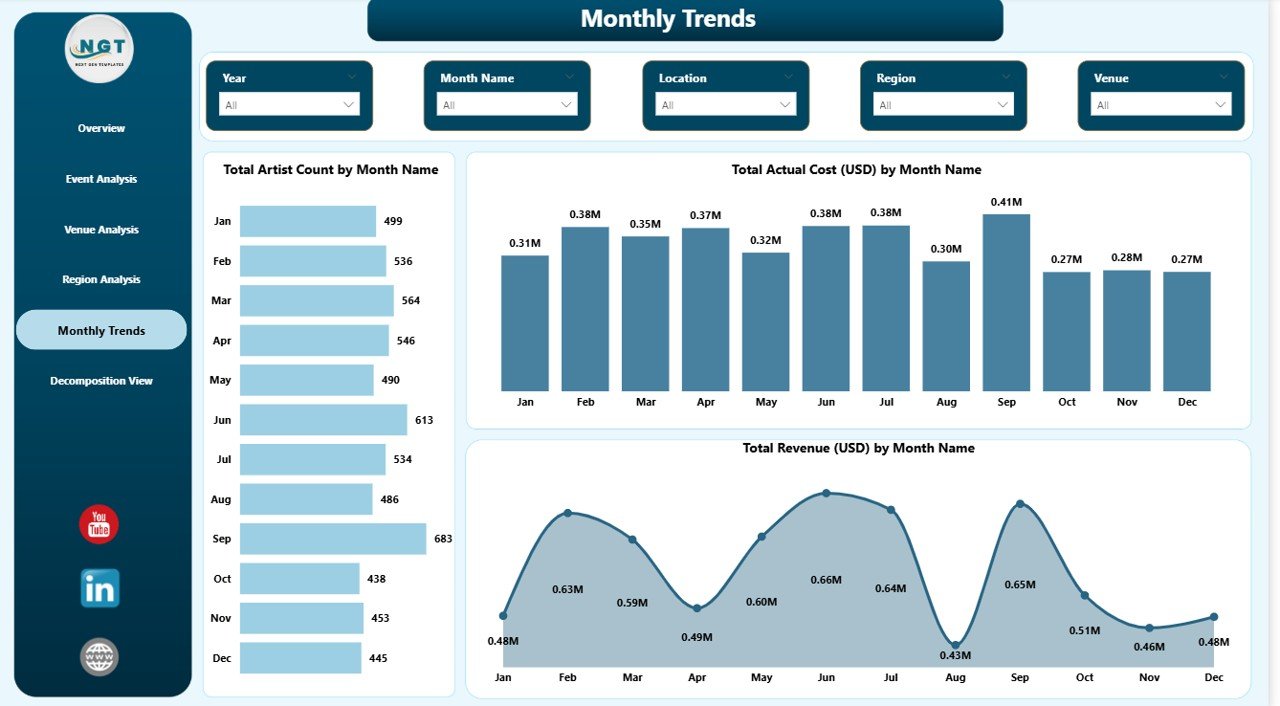
📅 Monthly trend tracking to identify seasonal patterns
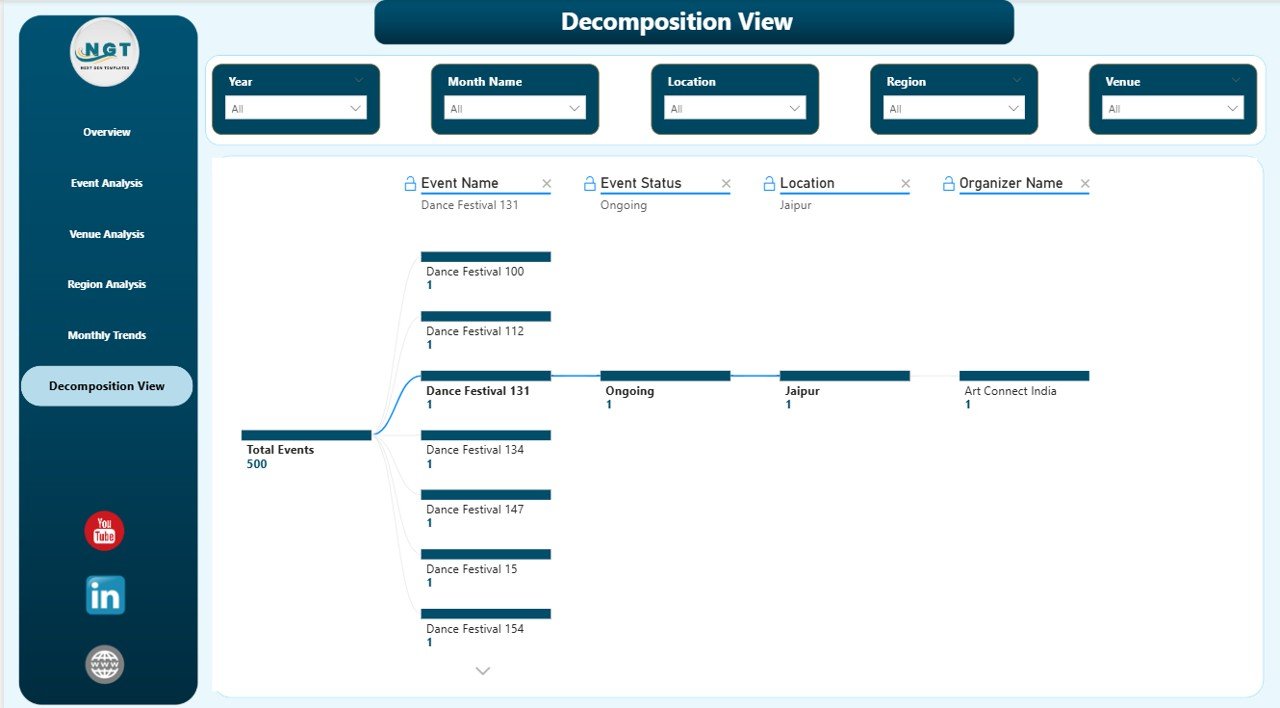
🔎 Advanced decomposition analysis for deep performance investigation
🎯 Dynamic slicers for instant filtering by location, organizer, and event status
⚡ Automated visual reporting that eliminates manual analysis
📦 What’s Inside the Arts and Culture Dashboard in Power BI
This dashboard includes five analytical pages plus an advanced decomposition view, each designed to answer key organizational questions:
✅ Overview Page – Displays overall performance using KPI cards and summary visuals.
✅ Event Analysis Page – Helps evaluate event success, revenue generation, and cost efficiency.
✅ Venue Analysis Page – Identifies high-performing venues and improves audience experience.
✅ Region Analysis Page – Compares cultural performance across regions.
✅ Monthly Trends Page – Reveals long-term patterns in revenue, artist participation, and expenses.
✅ Decomposition View – Enables deep drill-down analysis by event, organizer, location, or status.
Together, these pages create a complete cultural analytics ecosystem.
⚙️ How to Use the Arts and Culture Dashboard in Power BI
Using the dashboard is simple and requires no coding expertise:
1️⃣ Import your cultural event data into Power BI.
2️⃣ Update datasets including budgets, revenue, and visitor feedback.
3️⃣ Use slicers to filter data by event, region, or organizer.
4️⃣ Monitor KPIs instantly through interactive visuals.
5️⃣ Analyze trends and optimize future cultural programs.
Because the dashboard is fully interactive, users can explore insights with just a few clicks.
🎭 Who Can Benefit from This Arts and Culture Dashboard in Power BI
This dashboard is ideal for professionals and organizations such as:
🎨 Museums and art galleries
🎪 Cultural event organizers and festival planners
🏛 Government cultural departments
🌐 Non-profit cultural organizations
✈ Tourism and heritage boards
🎼 Creative industry managers
📊 Program coordinators and analysts
Anyone responsible for managing cultural programs, events, or audience engagement can benefit from structured analytics provided by this solution.
By adopting this dashboard, organizations gain real-time visibility into budgets, performance, and audience satisfaction. Leaders can allocate resources more effectively, improve event planning, and enhance cultural impact through measurable insights.
Instead of reacting after events conclude, teams can proactively manage programs using live performance data. The result is smarter planning, improved transparency, and stronger cultural outcomes.
The Arts and Culture Dashboard in Power BI bridges the gap between creativity and analytics — empowering organizations to preserve artistic excellence while achieving operational efficiency.
Click here to read the Detailed blog post
Watch the step-by-step video tutorial: