In today’s competitive automotive and manufacturing industry, heavy vehicle assembly operations must maintain high productivity, strict quality standards, and efficient production performance. Manufacturers constantly monitor assembly efficiency, production targets, downtime, quality metrics, and operational outcomes to remain competitive. However, many organizations still rely on scattered spreadsheets and manual reporting processes, making performance tracking slow and error-prone.
The Heavy Vehicle Assembly KPI Dashboard in Excel is a powerful, ready-to-use performance management solution designed specifically for monitoring assembly plant KPIs in a structured and visual format. This dashboard transforms raw operational data into meaningful insights using automated calculations, KPI comparisons, and dynamic charts — enabling faster and smarter decision-making.
Built entirely in Microsoft Excel, this dashboard provides an accessible and cost-effective analytics system without requiring complex software or technical expertise. Managers, engineers, and operational teams can track production performance instantly while comparing targets, actual performance, and previous year results.
Instead of analyzing multiple reports individually, users can view all critical KPIs from one centralized dashboard interface. As a result, organizations improve operational visibility, identify performance gaps early, and optimize assembly processes efficiently.
The dashboard is designed with structured worksheets that guide users from data entry to advanced performance analysis. Once data is entered, visuals update automatically, allowing teams to focus on analysis rather than report preparation.
Whether you manage heavy truck assembly, construction equipment manufacturing, or large vehicle production facilities, this dashboard provides the clarity needed to drive operational excellence.
📊 Key Feature of Heavy Vehicle Assembly KPI Dashboard in Excel
🚛 Complete KPI Performance Monitoring
Track production, efficiency, quality, and operational KPIs in one dashboard.
📅 Dynamic Month Selection
Choose a month from cell D3 and instantly update the entire dashboard.
📈 MTD & YTD Performance Analysis
Compare Month-to-Date and Year-to-Date results simultaneously.
🎯 Target vs Actual Comparison
Automatically evaluate performance against defined targets.
🔁 Previous Year Benchmarking
Analyze growth trends using historical performance comparison.
📊 Conditional Formatting Indicators
Up/down arrows highlight performance improvements instantly.
🧭 Easy Navigation Home Page
Quick-access buttons help users jump between sheets easily.
⚙️ Automated Calculations
Dashboard updates automatically when data changes.
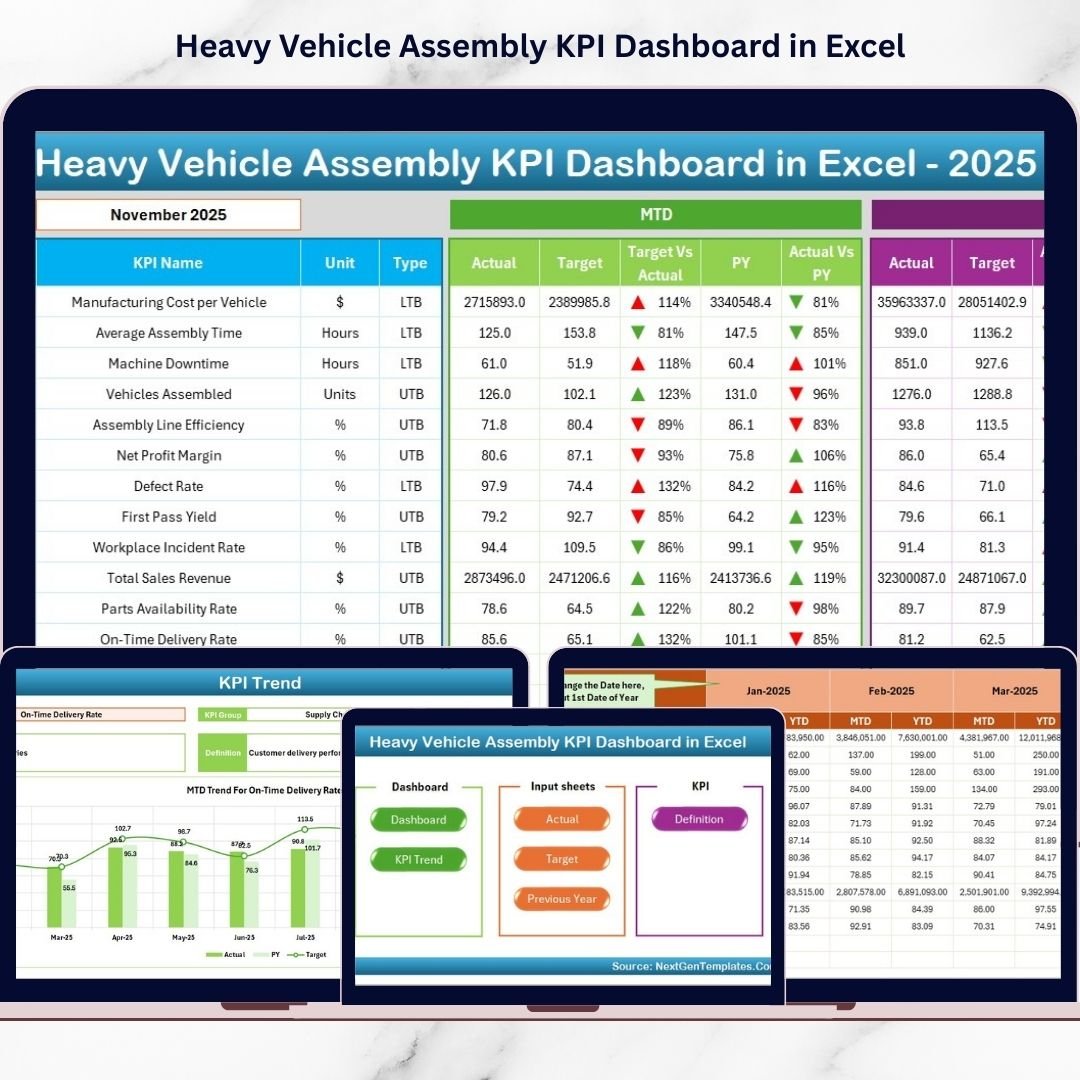
📦 What’s Inside the Heavy Vehicle Assembly KPI Dashboard in Excel
This ready-to-use Excel template includes 7 structured worksheets:
🔹 Home Sheet
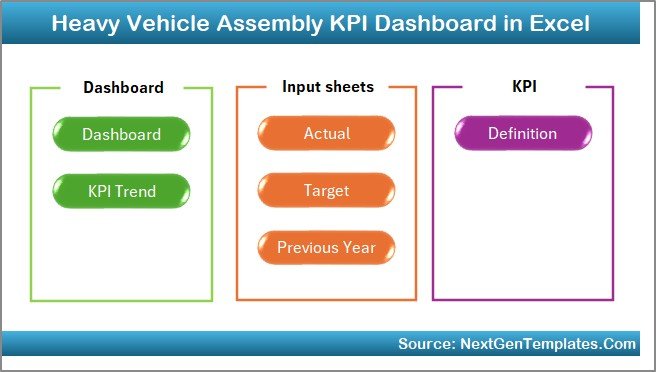
Acts as the navigation hub with six buttons that allow instant movement between dashboard sections, improving usability and workflow efficiency.
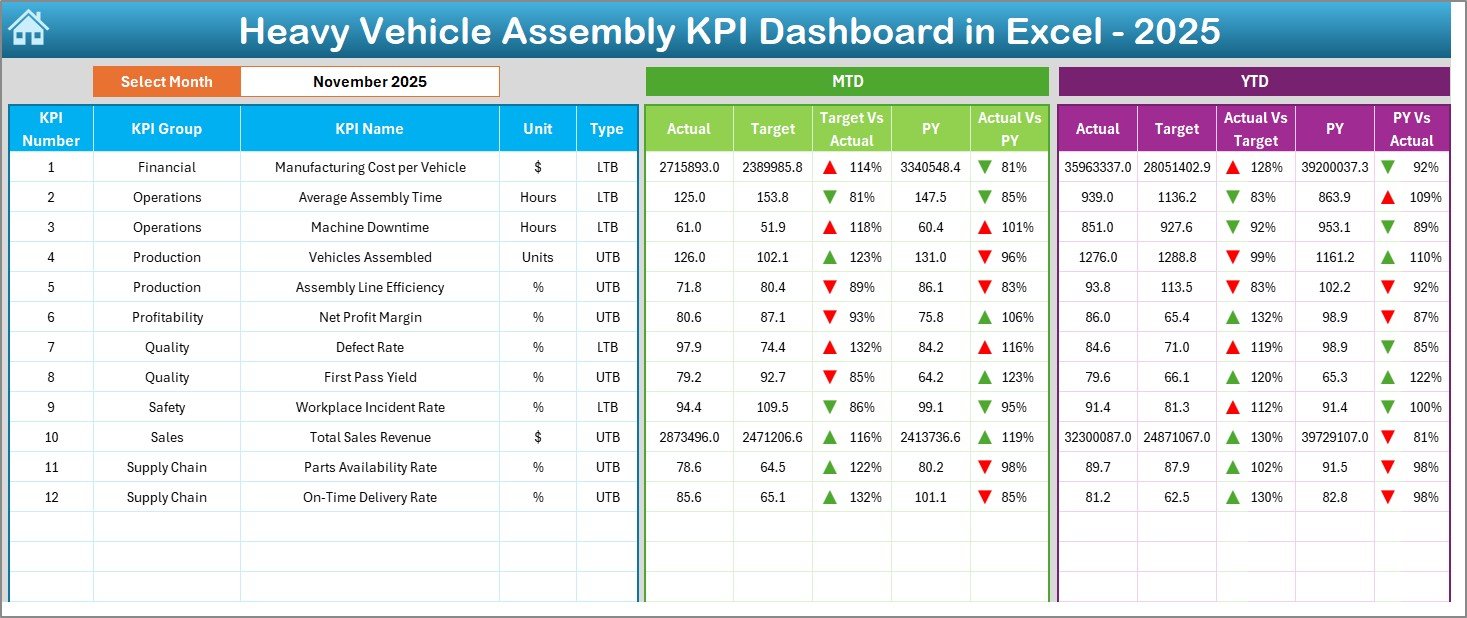
🔹 Dashboard Sheet (Main Page)
The core reporting interface showing all KPI performance.
Features include:
-
Month selection dropdown (Cell D3)
-
MTD Actual, Target & Previous Year comparison
-
YTD Actual, Target & Previous Year comparison
-
Target vs Actual analysis
-
PY vs Actual comparison
-
Visual up/down performance indicators
This page gives executives a quick overview of assembly performance.
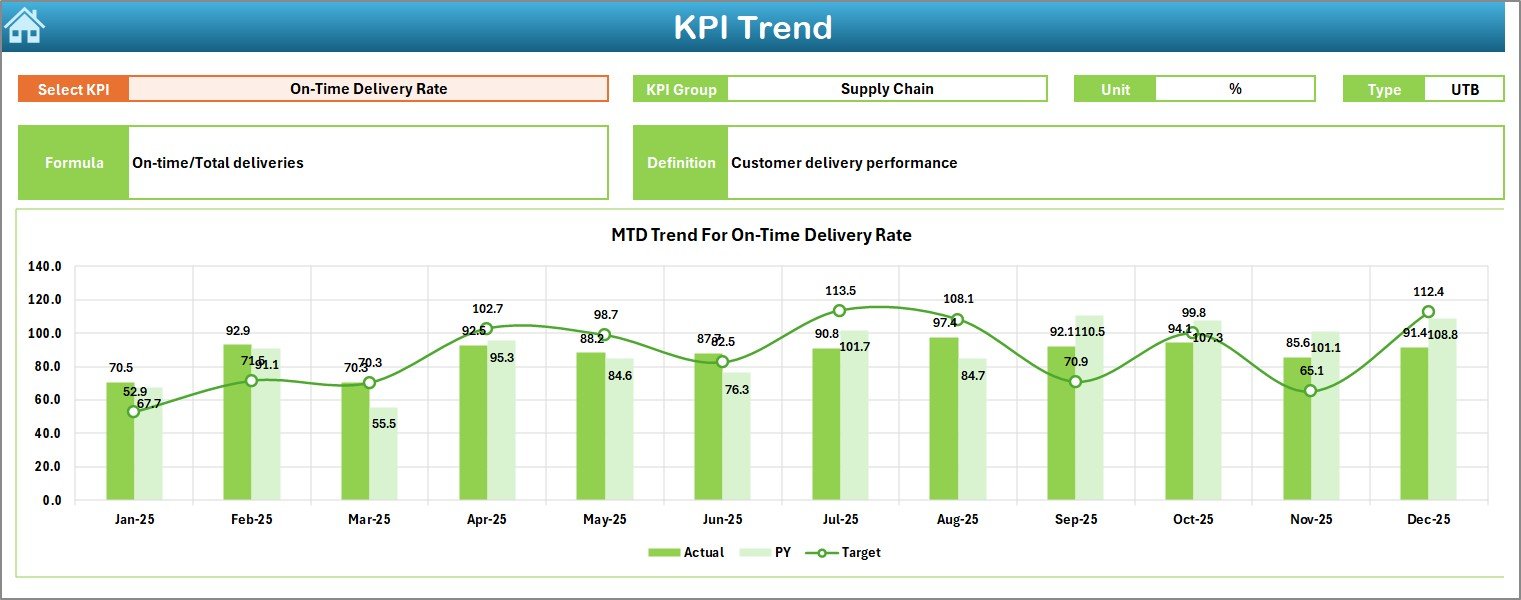
🔹 KPI Trend Sheet
Provides detailed KPI-level analysis.
Users can:
-
Select KPI from dropdown (Cell C3)
-
View KPI Group, Unit, Type (LTB/UTB)
-
See KPI Formula & Definition
-
Analyze MTD and YTD trend charts comparing:
-
Actual
-
Target
-
Previous Year values
-
Helps identify long-term performance trends.
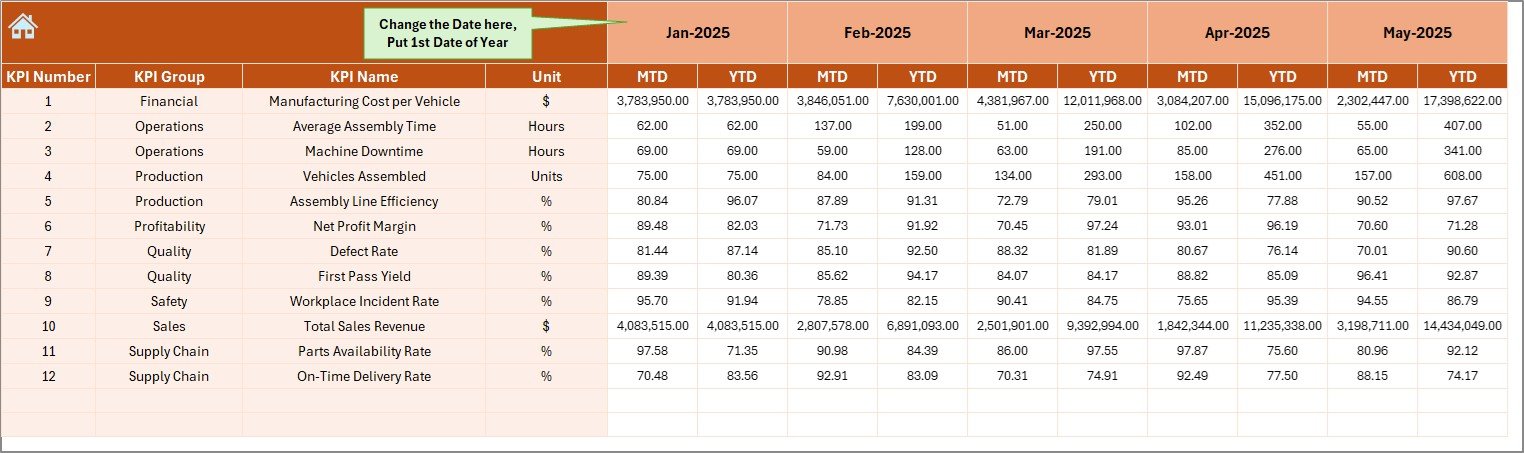
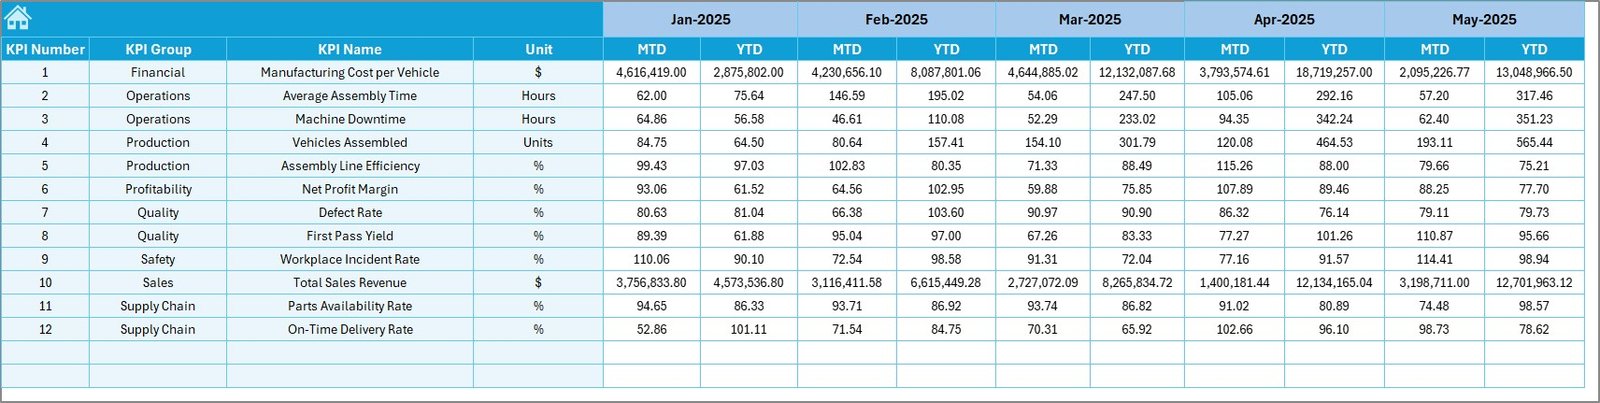
🔹 Actual Numbers Input Sheet
The primary data entry area.
Users:
-
Enter MTD and YTD actual values
-
Select starting month in Cell E1
-
Dashboard updates automatically after entry
Designed for simple and structured data input.
🔹 Target Sheet
Used to define monthly KPI targets.
The dashboard automatically compares actual performance against these targets for evaluation.
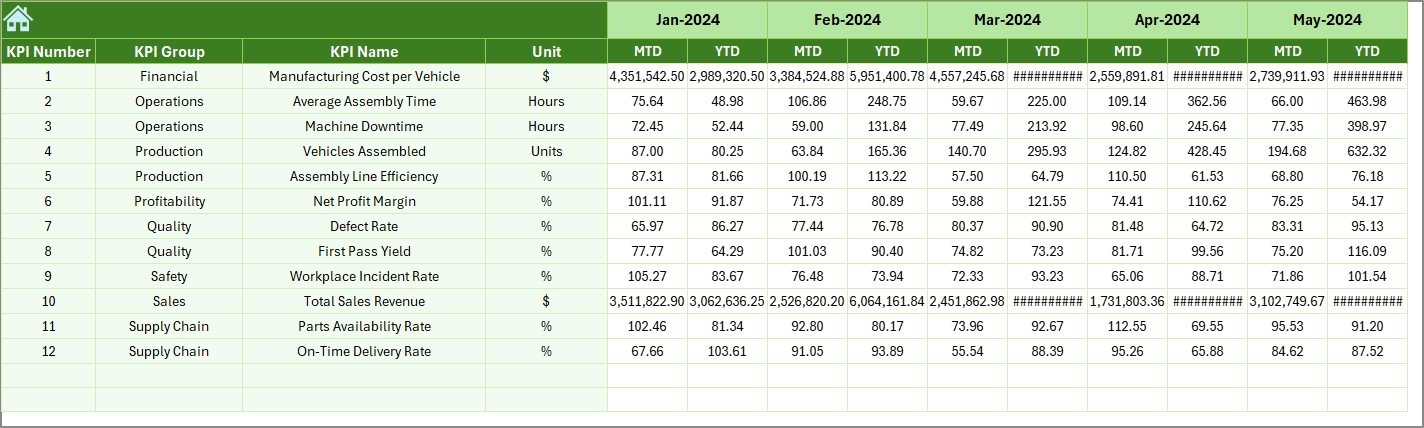
🔹 Previous Year Number Sheet
Stores historical KPI values for benchmarking.
Enables year-over-year performance analysis.
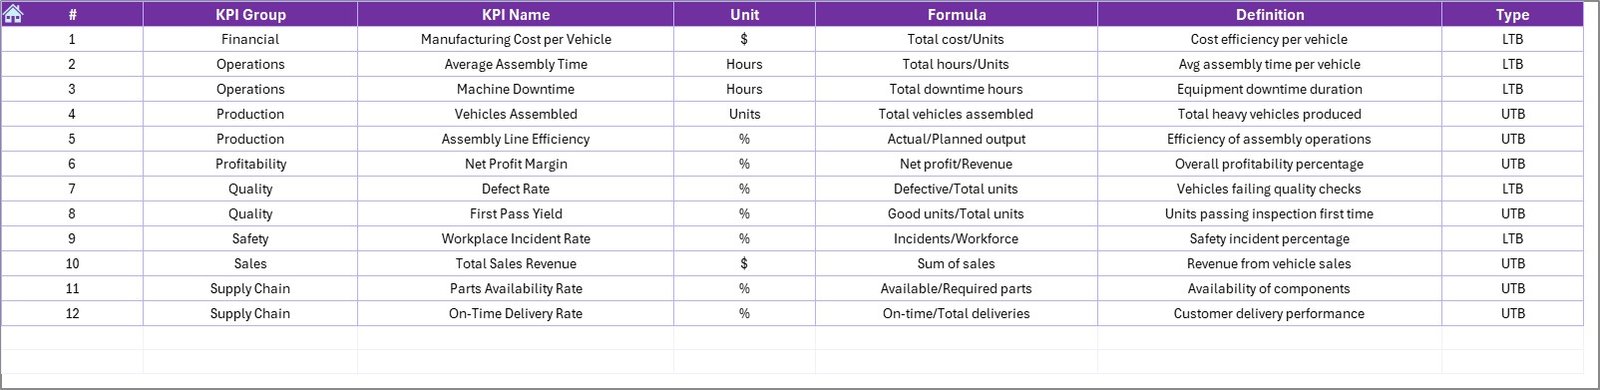
🔹 KPI Definition Sheet
Acts as the KPI master database.
Users define:
-
KPI Name
-
KPI Group
-
Unit
-
Formula
-
KPI Definition
Ensures consistency across all dashboard calculations.
🛠️ How to Use the Heavy Vehicle Assembly KPI Dashboard
1️⃣ Define KPIs in the KPI Definition sheet.
2️⃣ Enter monthly targets in the Target sheet.
3️⃣ Add previous year data for benchmarking.
4️⃣ Input actual MTD & YTD numbers.
5️⃣ Select the month from the Dashboard page.
6️⃣ Review insights and trends automatically.
Even users with basic Excel knowledge can operate the dashboard easily.
👥 Who Can Benefit from This Dashboard
This dashboard is ideal for:
✔ Assembly Plant Managers
✔ Production Engineers
✔ Operations Managers
✔ Quality Control Teams
✔ Manufacturing Analysts
✔ Automotive Industry Leaders
✔ Industrial Equipment Manufacturers
🚀 Business Benefits
Organizations using this dashboard can:
✅ Improve production monitoring
✅ Detect inefficiencies early
✅ Enhance operational accountability
✅ Reduce manual reporting effort
✅ Improve target achievement tracking
✅ Support data-driven manufacturing decisions
Ultimately, the dashboard helps transform assembly operations into a performance-driven system.
### Click here to read the Detailed blog post
Visit our YouTube channel to learn step-by-step video tutorials
👉 Youtube.com/@PKAnExcelExpert