Managing leases across multiple properties, cities, and regions can quickly become complex. Many organizations still depend on disconnected spreadsheets, which makes it difficult to track rent, maintenance expenses, escalation percentages, and security deposits accurately.
That’s why we built the Lease Management Dashboard in Power BI — a powerful, ready-to-use analytics solution that converts scattered lease data into clear, interactive intelligence.
With this professionally designed dashboard, property managers and finance teams can monitor lease performance, control costs, and analyze regional trends in one centralized Power BI environment. As a result, your organization gains real-time visibility, faster insights, and smarter decision-making.
Whether you manage retail stores, commercial properties, or corporate real estate portfolios, this dashboard gives you the control you’ve been missing.
🔑 Key Feature of Lease Management Dashboard in Power BI
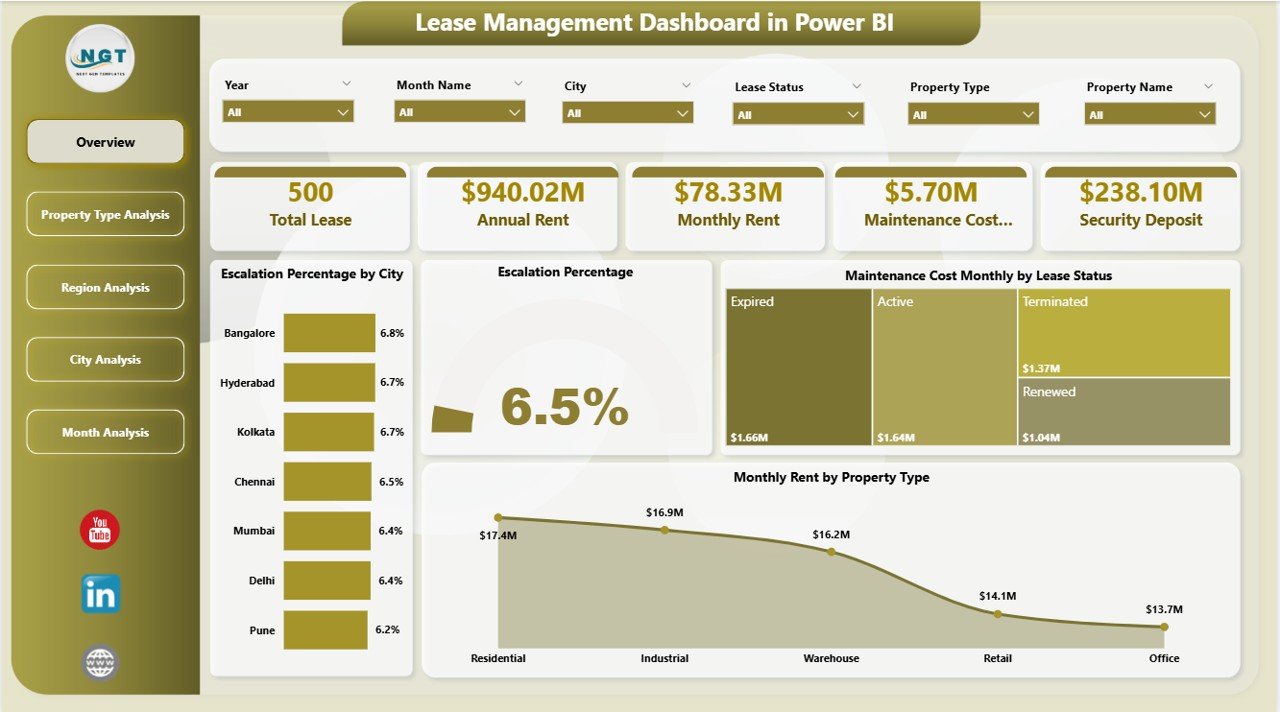
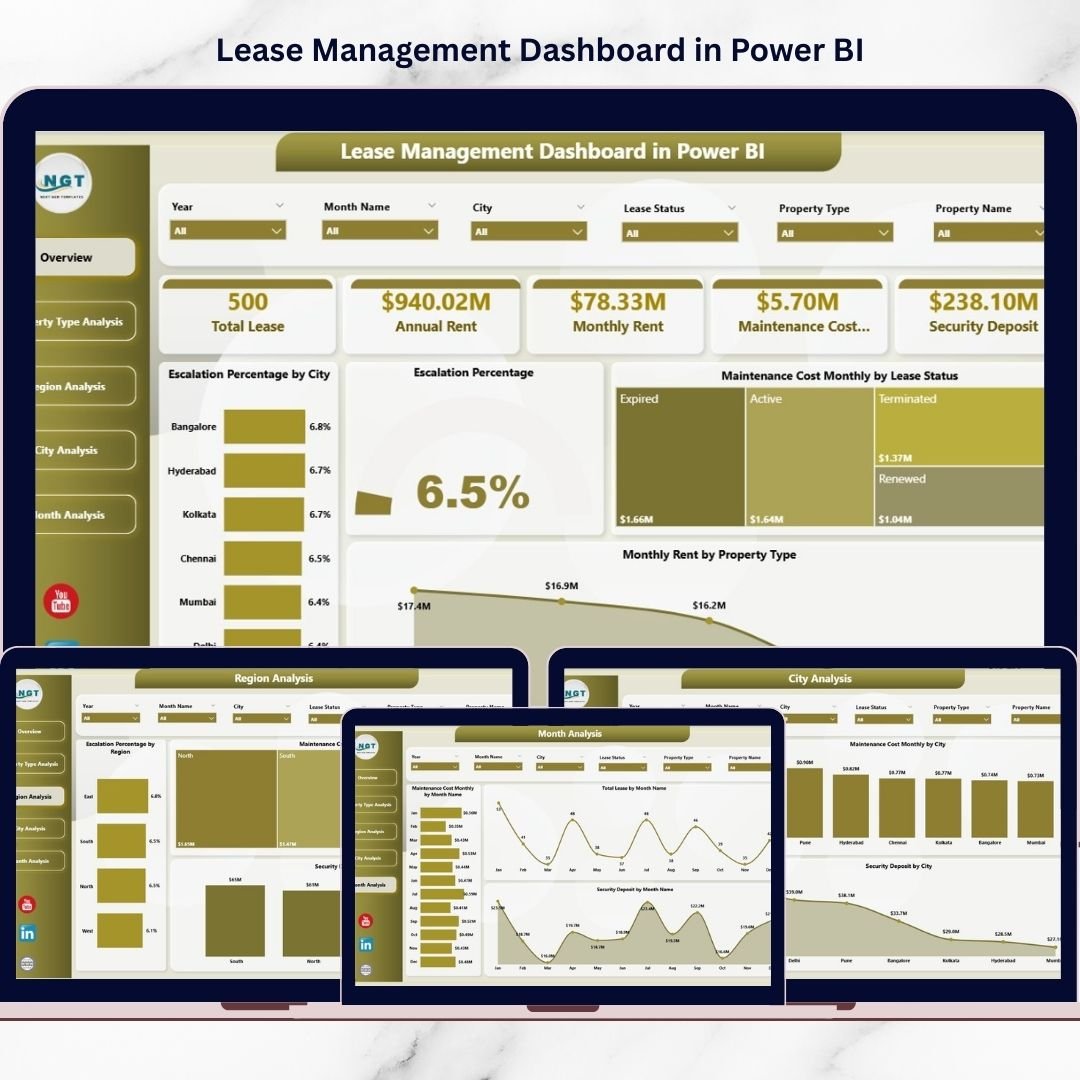
✨ Executive Overview Dashboard
Get an instant snapshot of lease performance with dynamic KPI cards and high-impact visuals.
📊 Interactive Slicers
Filter data by city, region, property type, and more for focused, real-time analysis.
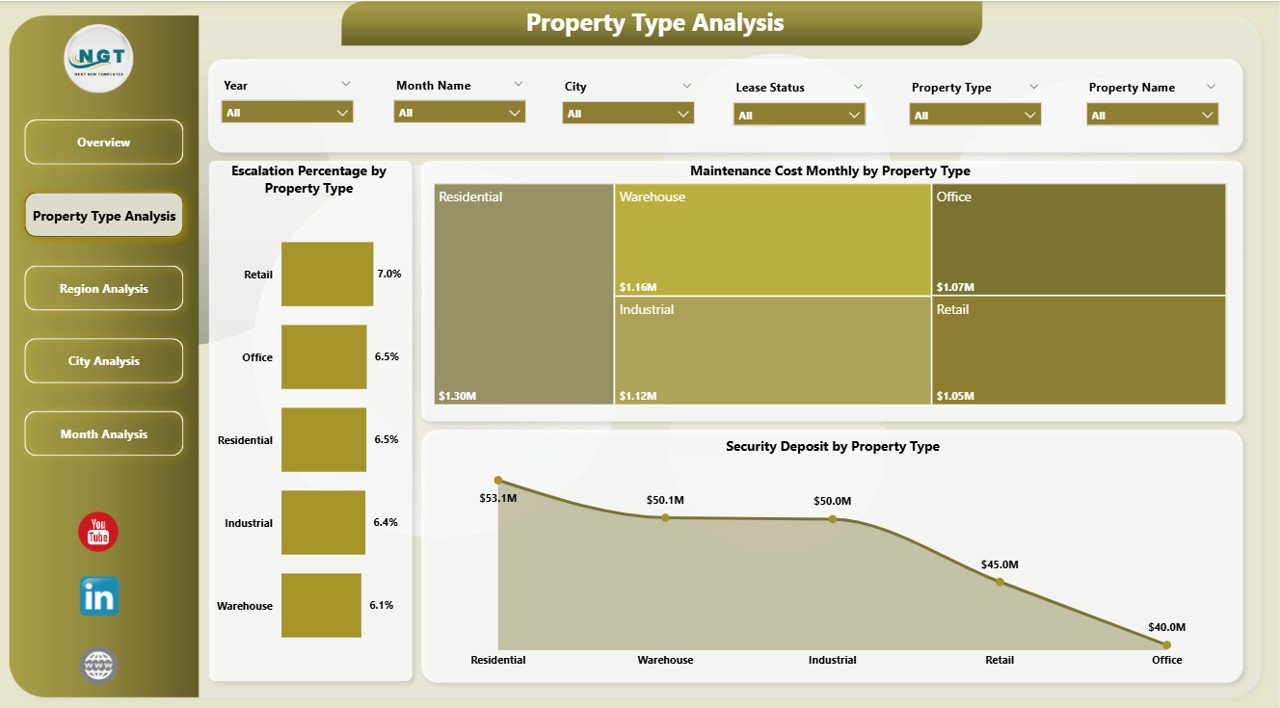
🏢 Property Type Intelligence
Compare commercial vs. residential performance and detect high-cost categories quickly.
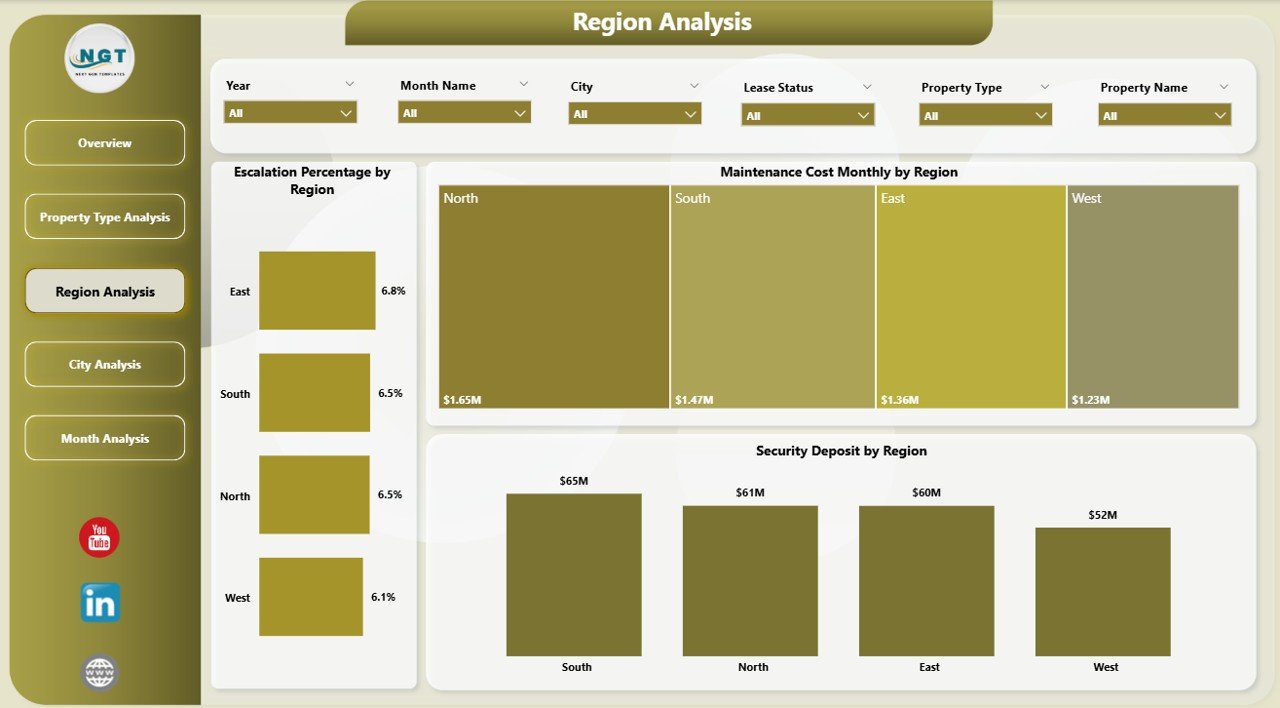
🌍 Region Performance Tracking
Identify high-expense regions and monitor escalation patterns across locations.
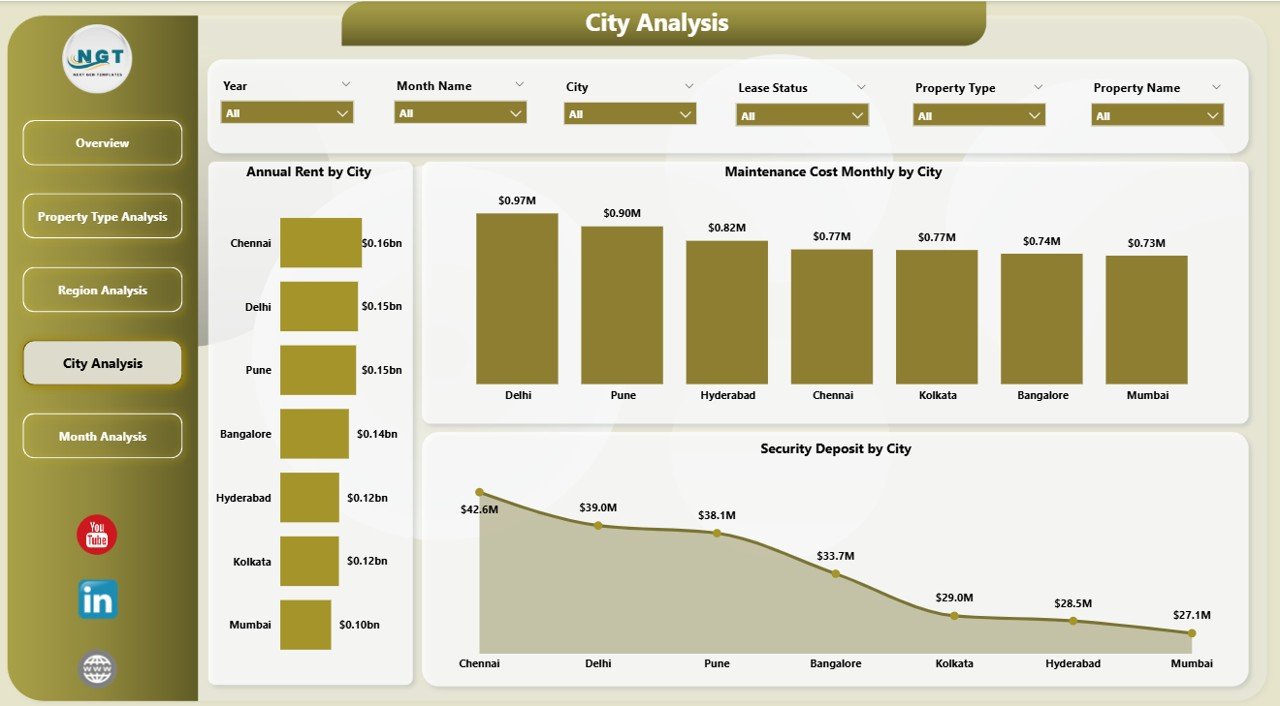
🏙️ City-Level Deep Dive
Pinpoint city-wise rent, maintenance, and deposit trends for precise decisions.
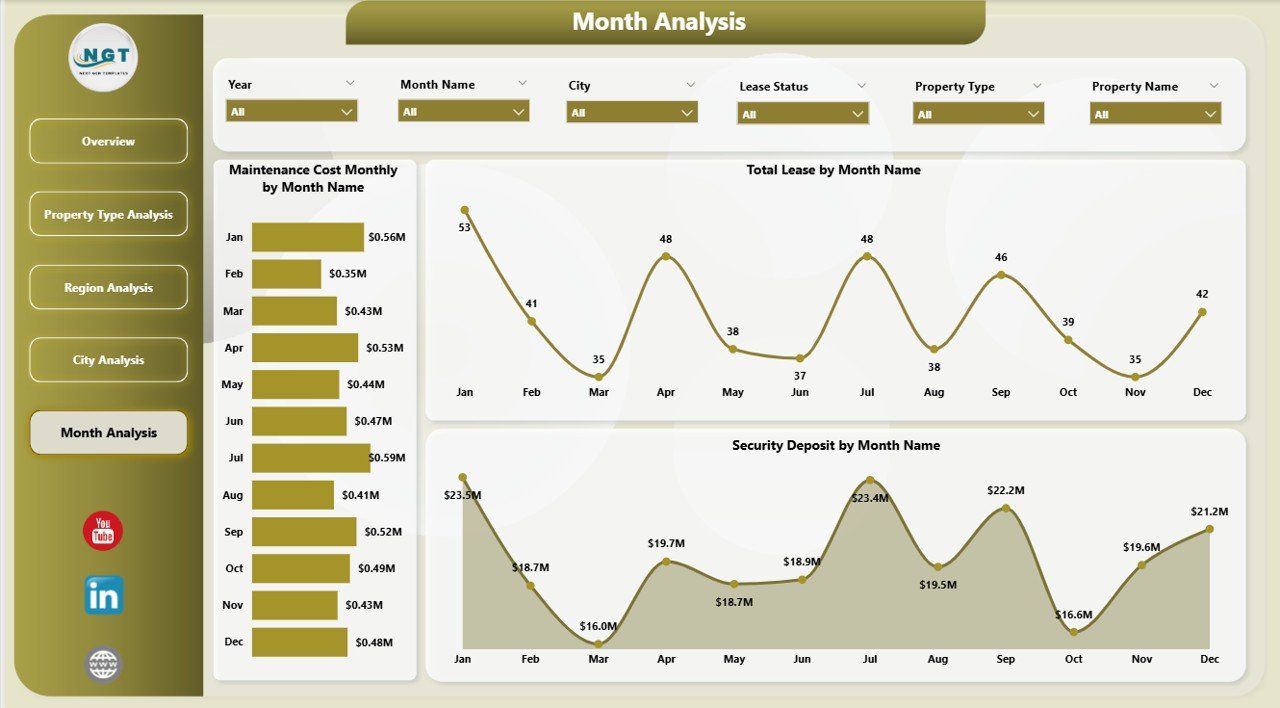
📅 Monthly Trend Analysis
Track lease growth, maintenance spikes, and deposit movements over time.
⚡ High-Performance Power BI Model
Handles large lease datasets smoothly with fast refresh capability.
🎯 Executive-Ready Visuals
Professional charts designed for leadership reviews and board meetings.
📦 What’s Inside the Lease Management Dashboard in Power BI
This product delivers a complete, ready-to-use Power BI solution.
✔️ Power BI Desktop File (.pbix)
✔️ 5 Interactive Analytical Pages
✔️ Dynamic KPI Cards
✔️ Advanced Slicers for Filtering
✔️ Clean and Structured Data Model
✔️ Fully Interactive Visuals
✔️ Easy-to-Refresh Data Framework
Everything is pre-configured so you can start analyzing immediately.
🛠️ How to Use the Lease Management Dashboard in Power BI
Getting started is simple and fast.
Step 1: Download and open the PBIX file
Step 2: Replace the sample data with your lease data
Step 3: Refresh the dataset
Step 4: Use slicers to filter insights
Step 5: Review dashboards for decision-making
Within minutes, you will have a powerful lease analytics command center.
🎯 Who Can Benefit from This Lease Management Dashboard in Power BI
This dashboard is designed for organizations managing multiple lease agreements.
✅ Real Estate Companies
✅ Property Managers
✅ Finance Teams
✅ Facility Management Firms
✅ Retail Chains
✅ Corporate Real Estate Teams
✅ Multi-location Businesses
If your organization wants better lease visibility and tighter financial control, this dashboard is essential.
Why This Dashboard Is a Must-Have
Unlike manual reports, this dashboard provides:
✔️ Centralized lease visibility
✔️ Real-time performance monitoring
✔️ Maintenance cost control
✔️ Escalation tracking
✔️ Regional comparison
✔️ Faster executive reporting
As a result, your team shifts from reactive reporting to proactive lease optimization.
### Click hare to read the Detailed blog post
📺 Visit our YouTube channel to learn step-by-step video tutorials
👉 Youtube.com/@PKAnExcelExpert