Managing a distillery is not only about crafting premium spirits. It is about controlling yield, minimizing losses, maintaining quality, optimizing production cost, and achieving revenue targets every month. However, when performance data sits in disconnected spreadsheets, visibility disappears. Consequently, issues stay hidden, targets get missed, and profit margins shrink.
That is why we built the Distilleries KPI Dashboard in Power BI — a ready-to-use, structured performance intelligence system designed specifically for distillery operations.
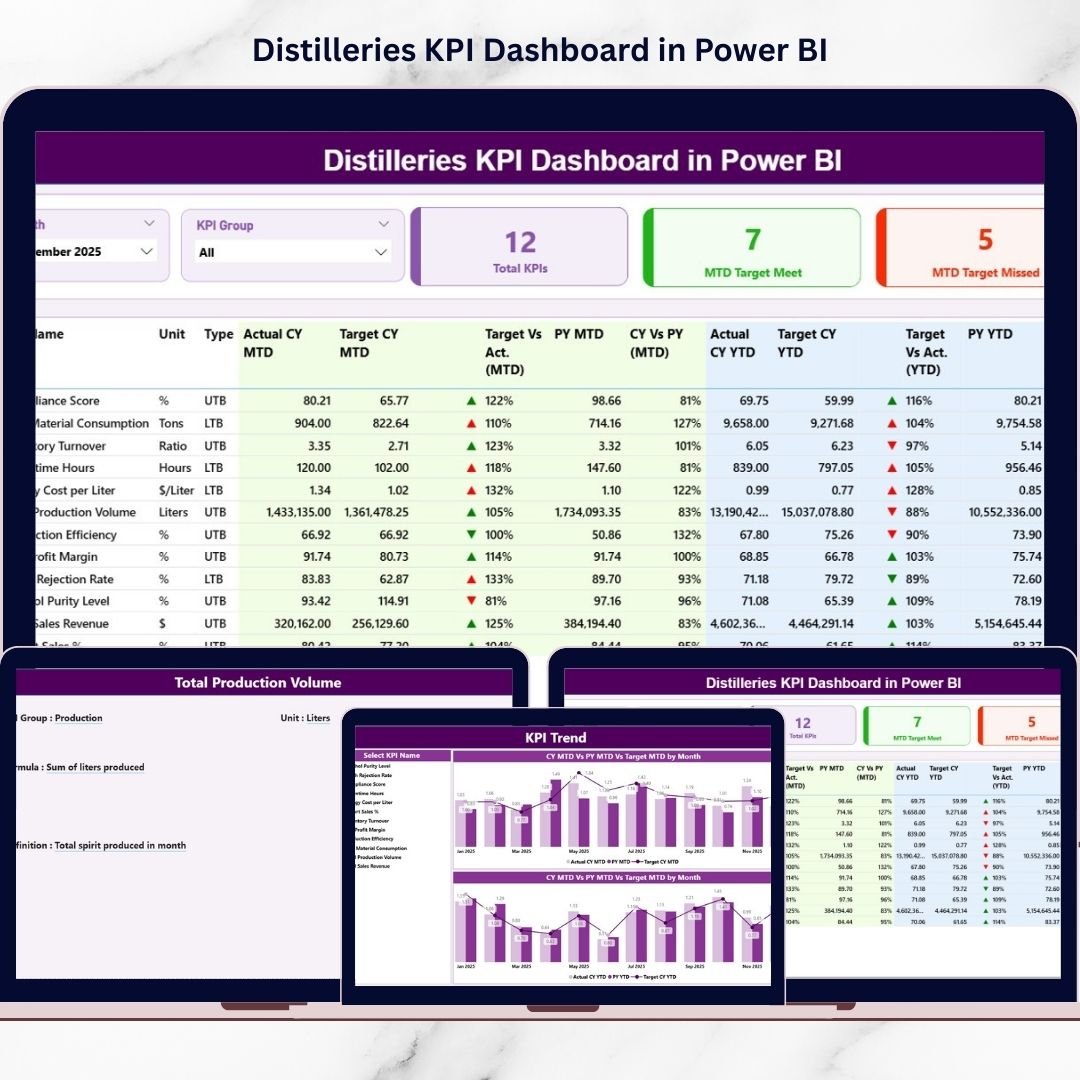
This powerful dashboard centralizes production, quality, financial, efficiency, and compliance KPIs into one interactive Power BI report. Moreover, it allows you to compare MTD and YTD performance against targets and previous year results instantly. As a result, you gain clarity, control, and confidence in every operational decision.
If you want to run your distillery with data-driven precision, this dashboard delivers exactly what you need.
🚀 Key Feature of Distilleries KPI Dashboard in Power BI
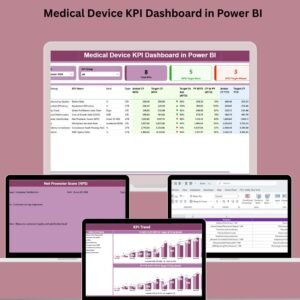
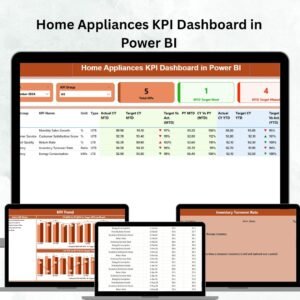
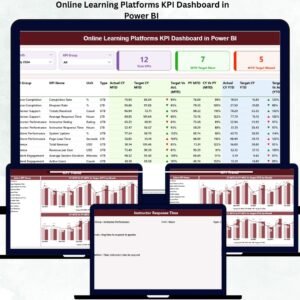
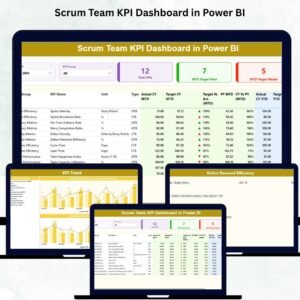
This dashboard includes 3 structured and interactive pages inside Power BI Desktop.
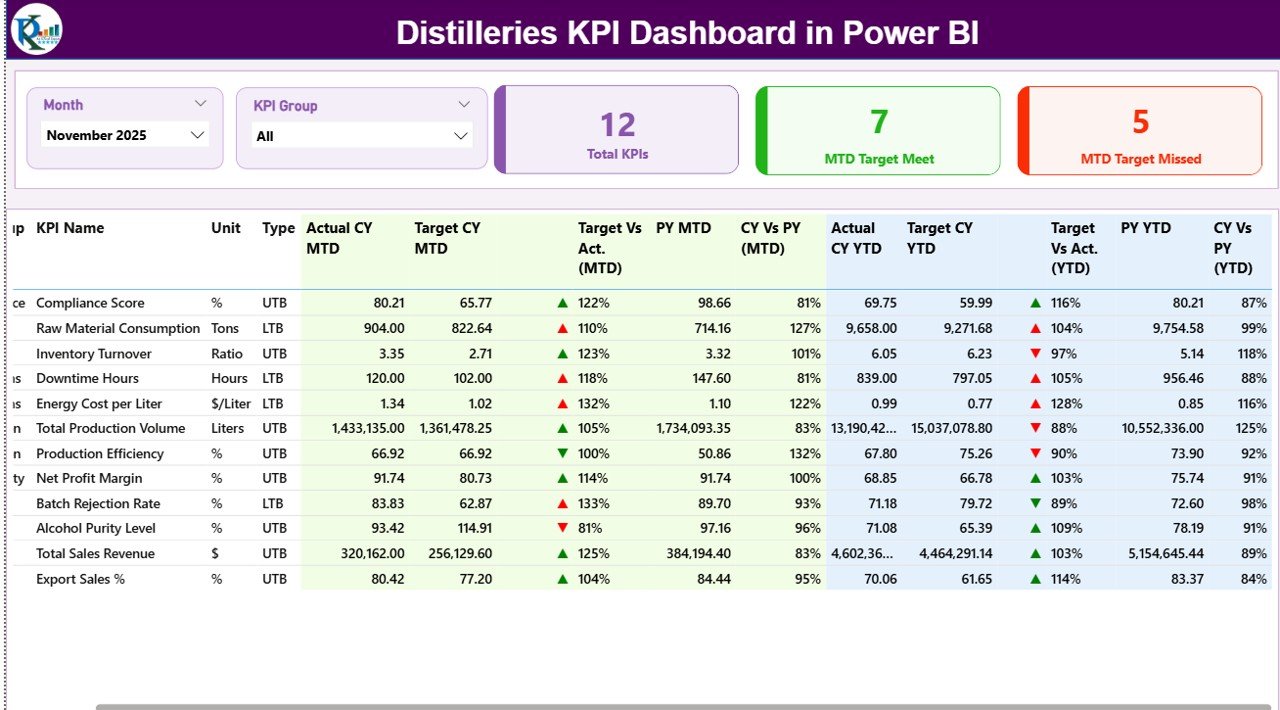
📊 Summary Page – Complete KPI performance overview
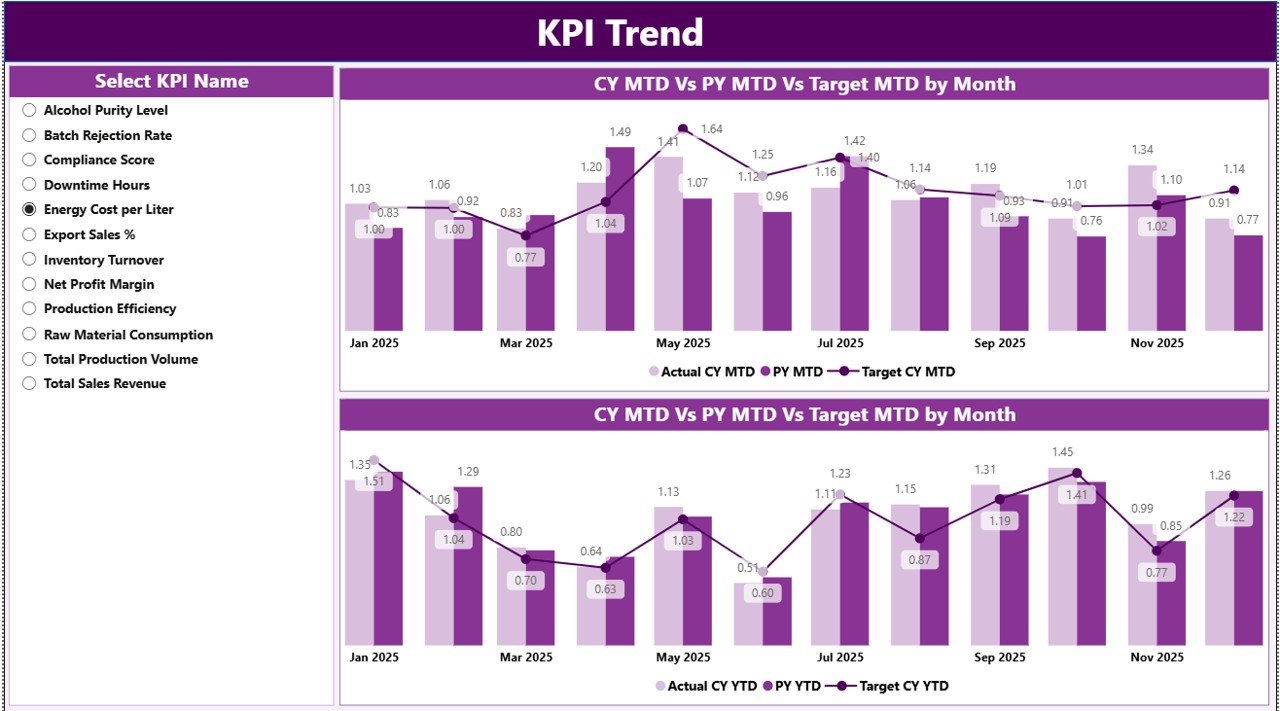
📈 KPI Trend Page – Visual trend analysis (MTD & YTD)
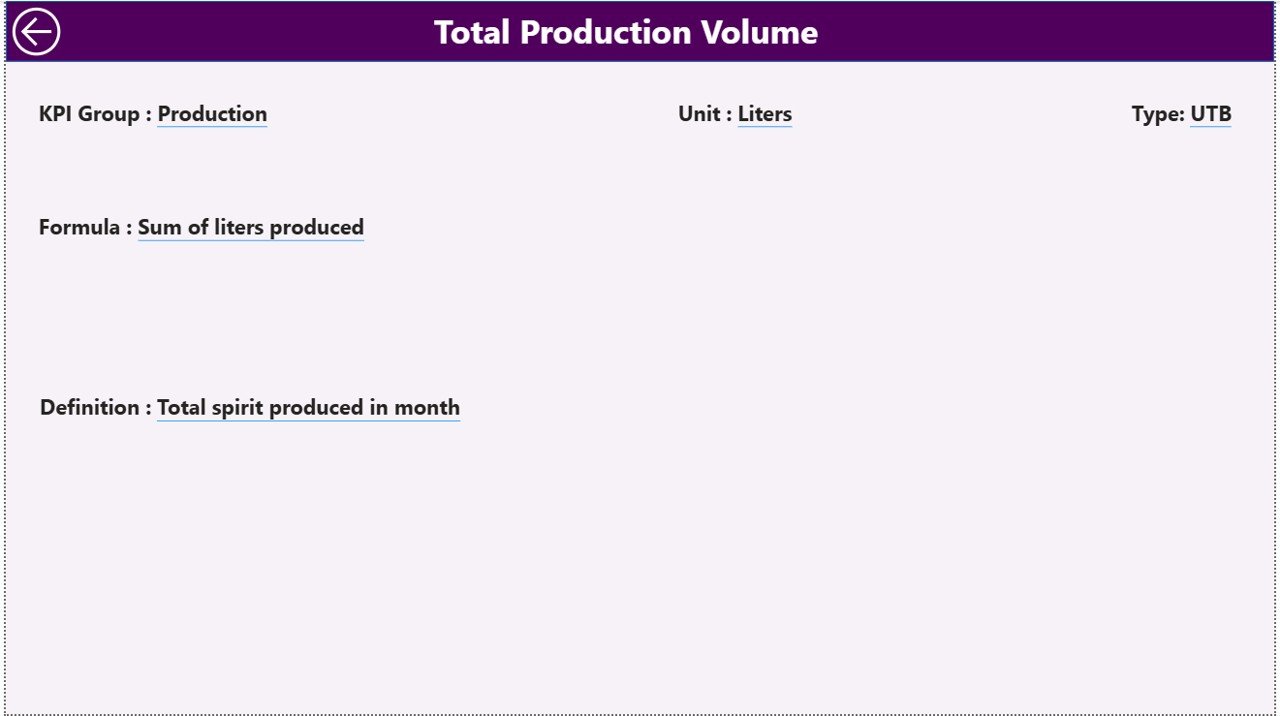
📘 KPI Definition Page – Drill-through KPI logic & formulas
✨ Powerful Highlights:
-
Month Slicer for dynamic filtering
-
KPI Group Slicer (Production, Quality, Financial, Efficiency, Compliance)
-
MTD & YTD Comparison
-
Target vs Actual Analysis
-
Previous Year Benchmarking
-
▲ / ▼ Performance Indicators
-
Interactive Combo Charts
-
Excel-Based Data Input
-
Fully Customizable KPI Framework
Because everything runs inside Power BI, your reporting becomes interactive, professional, and presentation-ready.
📦 What’s Inside the Distilleries KPI Dashboard in Power BI
This ready-to-use Power BI file includes:
✔ 3 Interactive Dashboard Pages
✔ KPI Performance Cards (Total KPIs, Target Meet, Target Missed)
✔ Detailed KPI Table with MTD & YTD Metrics
✔ Target vs Actual % Calculation
✔ CY vs PY Growth Comparison
✔ Combo Trend Charts (MTD & YTD)
✔ Drill-Through KPI Definitions
✔ Excel Data Source with Structured Sheets
✔ Flexible KPI Classification (LTB & UTB)
You simply update Excel data, refresh Power BI, and start analyzing performance immediately.
🛠 How to Use the Distilleries KPI Dashboard in Power BI
Implementation is simple:
1️⃣ Define KPIs in the Excel KPI Definition Sheet.
2️⃣ Enter Monthly Actual Numbers in Input_Actual Sheet.
3️⃣ Enter Targets in Input_Target Sheet.
4️⃣ Refresh Power BI.
5️⃣ Use slicers to filter by Month or KPI Group.
6️⃣ Review Summary Page first for high-level insights.
7️⃣ Analyze trends in KPI Trend Page.
8️⃣ Drill through to KPI Definition Page for formula clarity.
For example:
-
If Yield % drops below target, investigate fermentation or distillation efficiency.
-
If Cost per Liter rises, review raw material or energy usage.
-
If Sales Growth % declines compared to previous year, adjust distribution planning.
Because visuals update automatically, you can act immediately.
👥 Who Can Benefit from This Distilleries KPI Dashboard?
This dashboard is ideal for:
🥃 Distillery Owners
🏭 Plant Managers
🧪 Quality Control Teams
💰 Finance Heads
📦 Operations Managers
📊 Business Analysts
Whether you manage a small craft distillery or a large production facility, this dashboard scales with your operations.
📊 What KPIs Can You Track?
You can monitor key distillery metrics such as:
Production KPIs
-
Alcohol Yield %
-
Production Volume
-
Batch Completion Rate
-
Downtime Hours
-
Capacity Utilization %
Quality KPIs
-
Rejection Rate % (LTB)
-
Lab Test Compliance %
-
Customer Complaint Rate
Financial KPIs
-
Revenue per Liter
-
Production Cost per Unit
-
Gross Margin %
-
Inventory Turnover
Efficiency KPIs
-
Energy Consumption per Batch
-
Water Usage per Liter
-
Raw Material Loss % (LTB)
Because the KPI Definition sheet is editable, you can customize the dashboard according to your distillery’s requirements.
💡 How This Dashboard Improves Decision-Making
When you use this dashboard consistently:
-
You detect underperforming KPIs quickly
-
You reduce operational losses
-
You control production costs
-
You improve yield efficiency
-
You increase profit margins
-
You align teams with measurable goals
Instead of relying on assumptions, you make decisions backed by structured data.
Click here to read the Detailed blog post
Visit our YouTube channel to learn step-by-step video tutorials