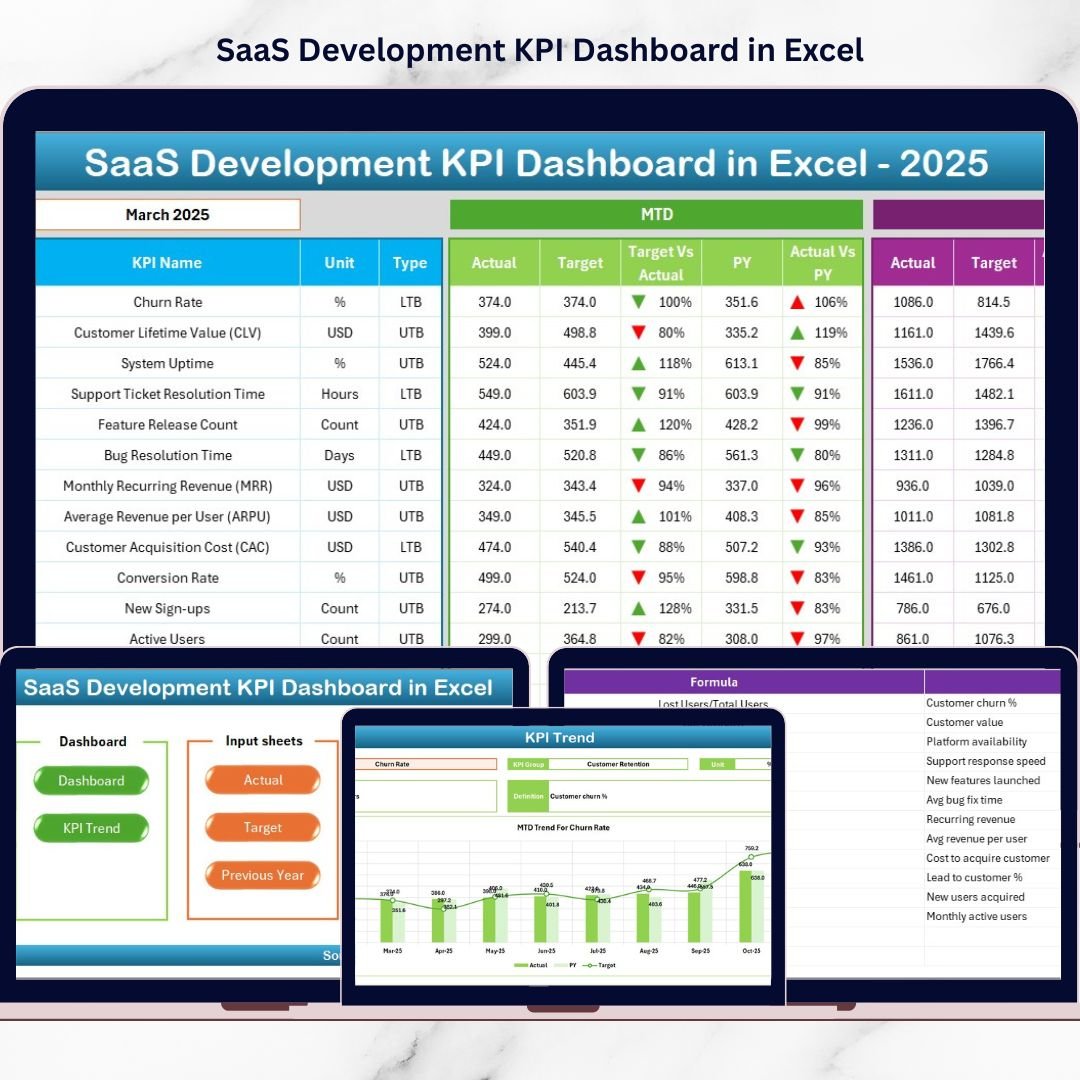
If you are running a SaaS company and still relying on scattered spreadsheets, you are slowing down your own growth. The SaaS Development KPI Dashboard in Excel gives you one powerful, structured system to monitor revenue, customer performance, and product development metrics — all in one dynamic Excel file.This ready-to-use template is designed for SaaS founders, product managers, finance teams, and operations leaders who want instant clarity on MRR, churn, CAC, feature velocity, and more — without investing in expensive BI tools.With 7 structured worksheets, automated calculations, dynamic month selection, and trend charts, this dashboard transforms raw data into actionable insights.
🚀 Key Feature of SaaS Development KPI Dashboard in Excel
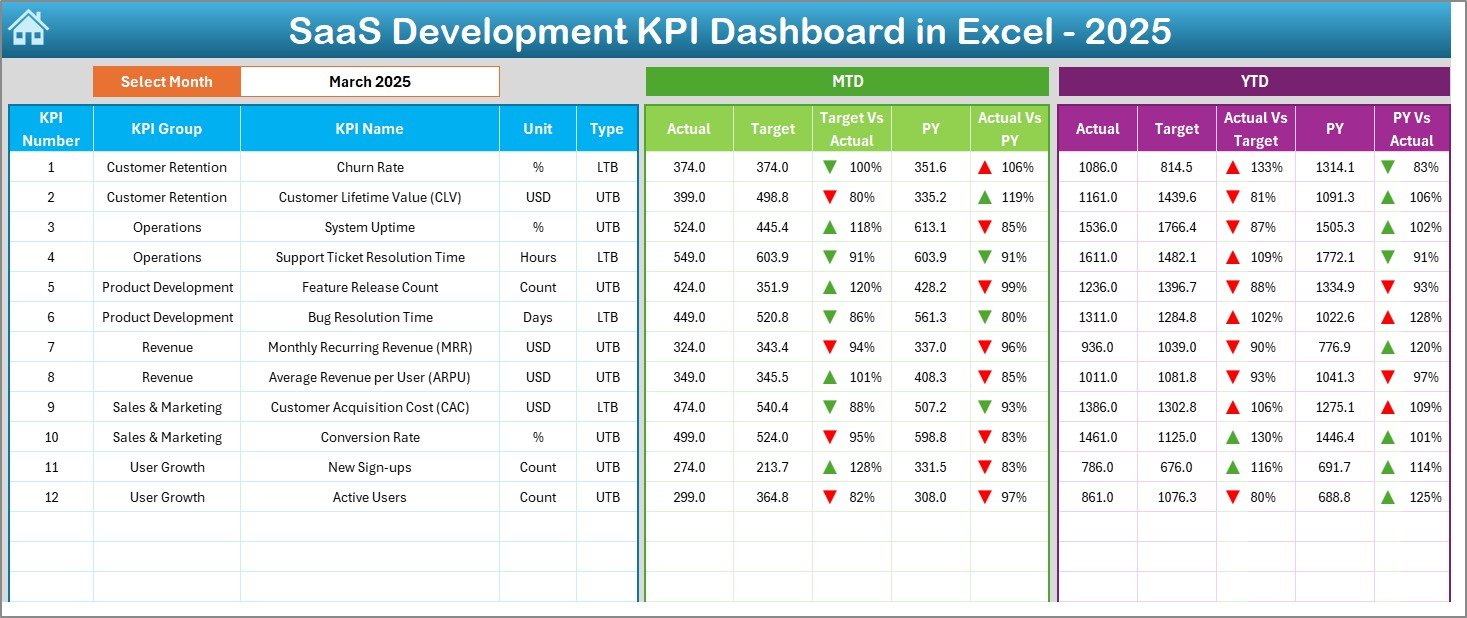
📅 Dynamic Month Selection (Cell D3) – Select any month and the entire dashboard updates automatically for MTD and YTD performance.
📊 MTD & YTD Performance Tracking – Monitor short-term and long-term growth in one view.
🎯 Target vs Actual Comparison – Instantly see which KPIs are hitting targets and which need attention.
📈 Previous Year Comparison – Measure real growth with CY vs PY analysis.
🔺 Conditional Formatting Arrows – Visual up/down indicators highlight performance instantly.
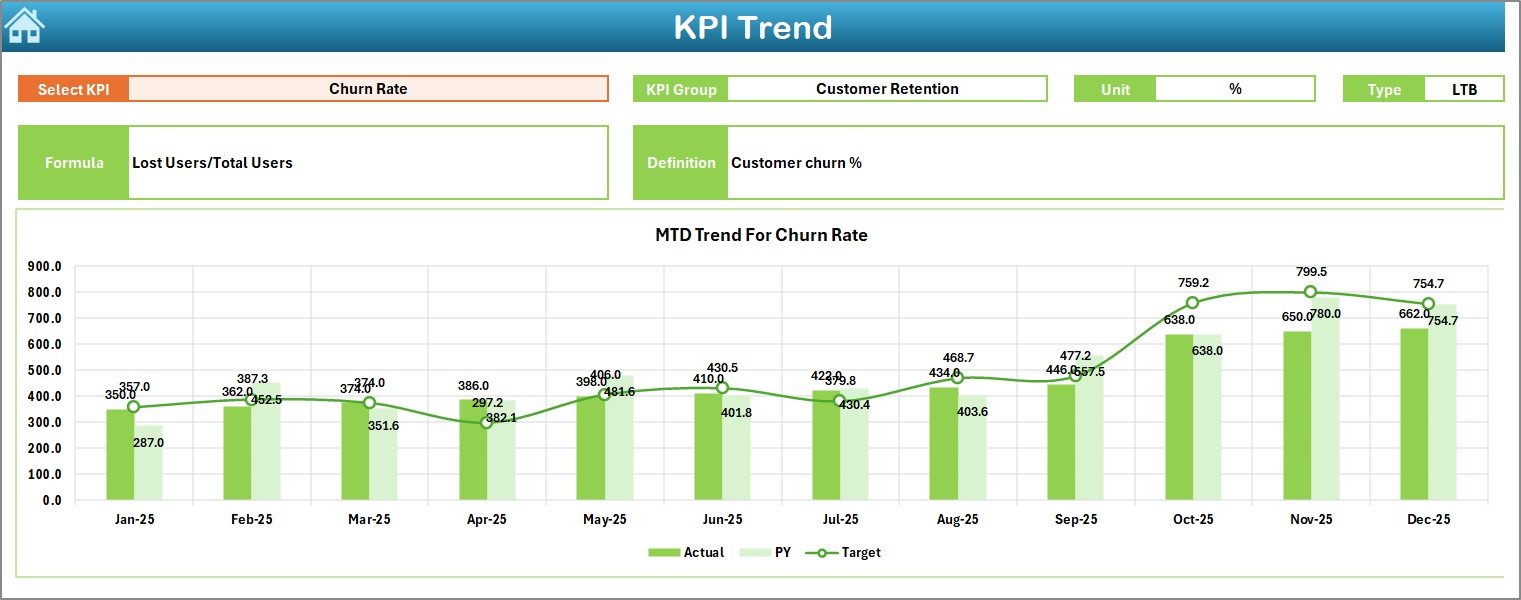
📉 KPI Trend Analysis Sheet – Analyze monthly trends with interactive KPI selection (Cell C3).
🧭 Summary Navigation Page – Clean index sheet with navigation buttons for quick access.
🧩 Fully Customizable Excel Template – Add, remove, or modify KPIs as your SaaS business grows.
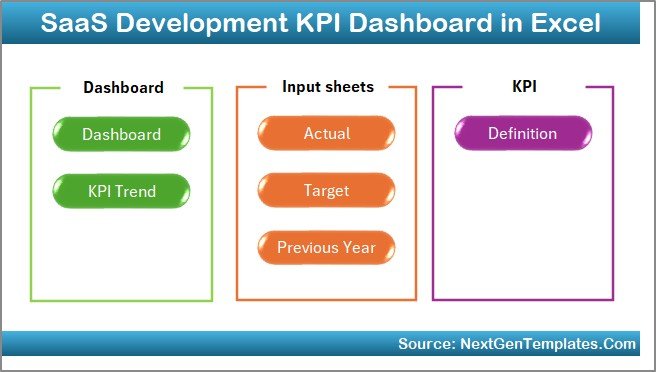
📂 What’s Inside the SaaS Development KPI Dashboard in Excel
This dashboard includes 7 structured worksheets:
1️⃣ Summary Sheet – Central index page with navigation buttons.
2️⃣ Dashboard Sheet – Main performance control center with:
-
MTD Actual, Target, Previous Year
-
YTD Actual, Target, Previous Year
-
% variance comparisons
-
Performance arrows
3️⃣ Trend Sheet – KPI-level monthly trend charts for deeper analysis.
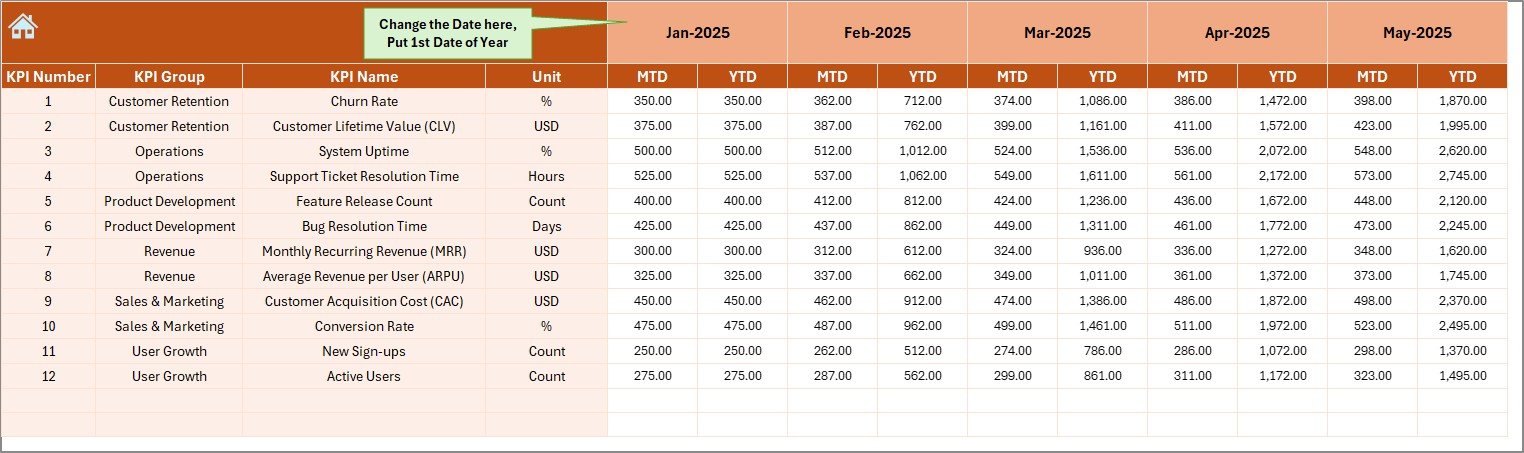
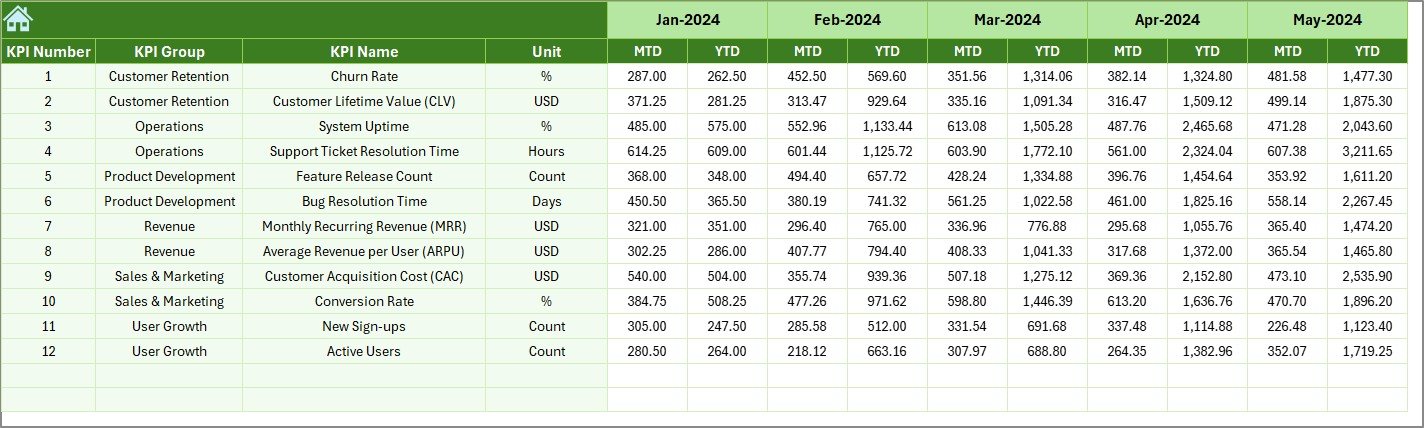
4️⃣ Actual Numbers Input Sheet – Enter current year MTD and YTD values.
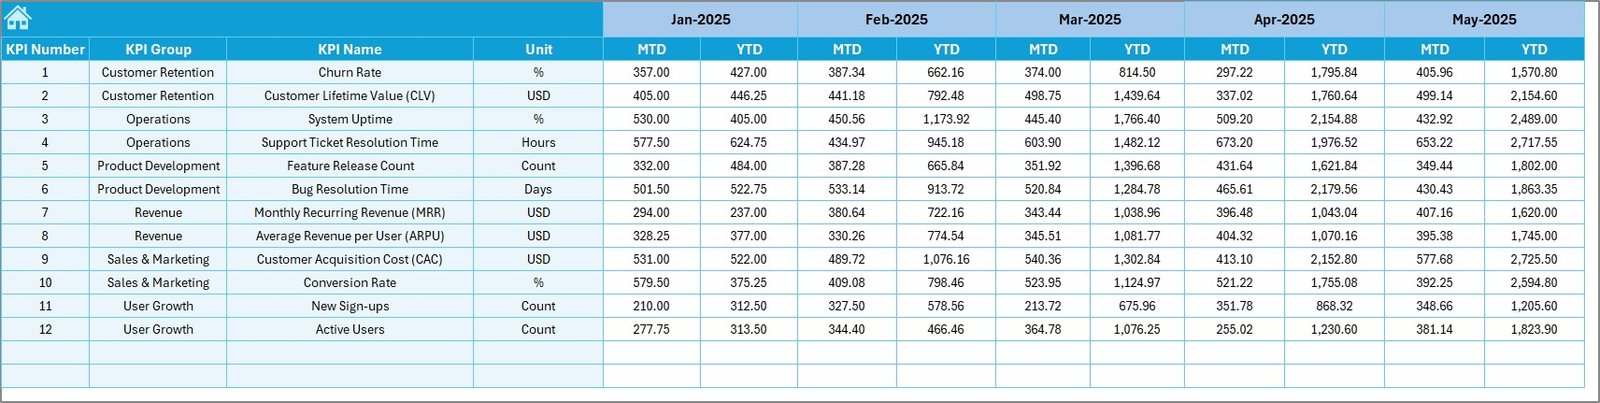
5️⃣ Target Sheet – Define monthly and yearly performance goals.
6️⃣ Previous Year Sheet – Store historical data for growth comparison.
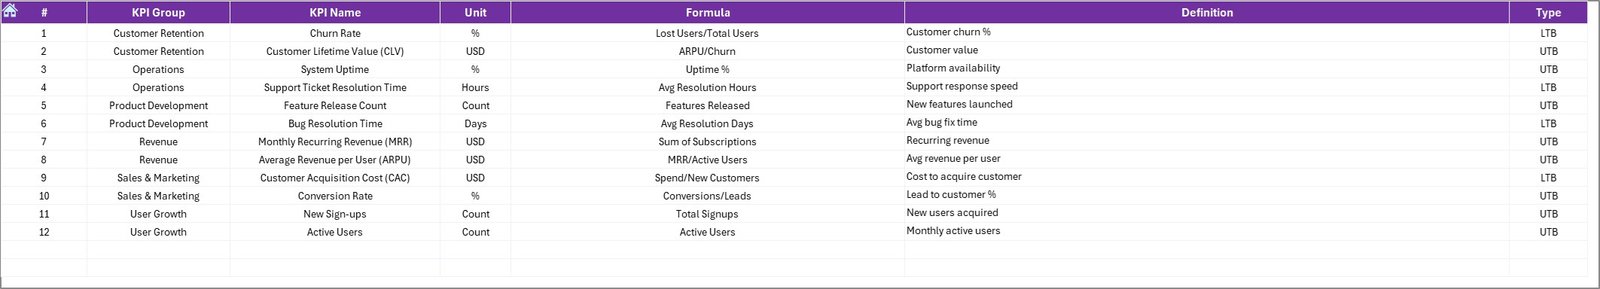
7️⃣ KPI Definition Sheet – Document KPI name, group, unit, formula, and definition for clarity.
This structured setup ensures organized reporting, consistency, and transparency.
🛠 How to Use the SaaS Development KPI Dashboard in Excel
Using this dashboard is simple:
1️⃣ Enter your current year actual data in the Actual Input sheet.
2️⃣ Add monthly and yearly targets in the Target sheet.
3️⃣ Enter historical data in the Previous Year sheet.
4️⃣ Define your KPIs properly in the KPI Definition sheet.
5️⃣ Select the desired month from Cell D3 in the Dashboard sheet.
6️⃣ For detailed trend analysis, choose a KPI from Cell C3 in the Trend sheet.
The dashboard will automatically calculate:
-
MTD vs Target %
-
YTD vs Target %
-
Current Year vs Previous Year %
-
Growth trends
-
Performance indicators
No complex formulas required. Just structured input and smart analysis.
👥 Who Can Benefit from This SaaS Development KPI Dashboard in Excel
👨💼 SaaS Founders – Monitor MRR, churn, and CAC in one place.
📊 Product Managers – Track feature release velocity and deployment efficiency.
💰 Finance Teams – Analyze revenue growth and cost performance.
📈 Growth Teams – Monitor conversion rate and active users.
🚀 Early-Stage Startups – Get enterprise-style KPI tracking at low cost.
🏢 Established SaaS Companies – Standardize monthly board reporting.
If your SaaS business depends on recurring revenue and customer retention, this dashboard becomes an essential decision-making tool.
This dashboard supports smarter SaaS growth by centralizing revenue, customer, and development KPIs in one dynamic Excel file. Instead of reacting late, you identify problems early and take strategic action.
Because small KPI improvements in SaaS compound over time, structured performance tracking directly impacts profitability.
Click here to read the Detailed blog post
Watch the step-by-step video tutorial: