Returns are no longer just a back-office function. They directly impact profitability, customer satisfaction, inventory accuracy, and operational efficiency. Yet many businesses still track returns in disconnected spreadsheets, making it difficult to monitor return rates, processing time, and financial losses.
Now imagine having MTD, YTD, Target vs Actual, and Previous Year comparisons — all updating dynamically with a single dropdown selection.
That’s exactly what the Returns Management KPI Dashboard in Google Sheets delivers.
This ready-to-use Google Sheets solution centralizes return performance tracking into one powerful and interactive system. With structured worksheets, dropdown controls (D3 & C3), automated comparisons, and visual conditional arrows, you gain instant clarity over return trends and cost impact.
If you want stronger return control, faster decisions, and improved margins, this dashboard is your competitive advantage.
🚀 Key Feature of Returns Management KPI Dashboard in Google Sheets
📊 Dynamic Month Selection (Cell D3) – Instantly update the entire dashboard
📈 MTD & YTD Performance Tracking – Monitor monthly and yearly results
🎯 Target vs Actual Comparison – Identify performance gaps quickly
📅 Previous Year Analysis – Measure year-over-year improvements
🔔 Conditional Up/Down Indicators – Visual performance direction
📌 KPI Trend Analysis Page (Cell C3) – Deep dive into each metric
📑 Centralized KPI Definition Sheet – Clear formulas and explanations
⚡ Fully Customizable Structure – Add KPIs anytime
🌐 Cloud-Based Access – Accessible from anywhere via Google Sheets
Everything updates automatically when you select a month — no manual recalculation required.
📂 What’s Inside the Returns Management KPI Dashboard in Google Sheets
This professional dashboard includes 6 structured worksheets:
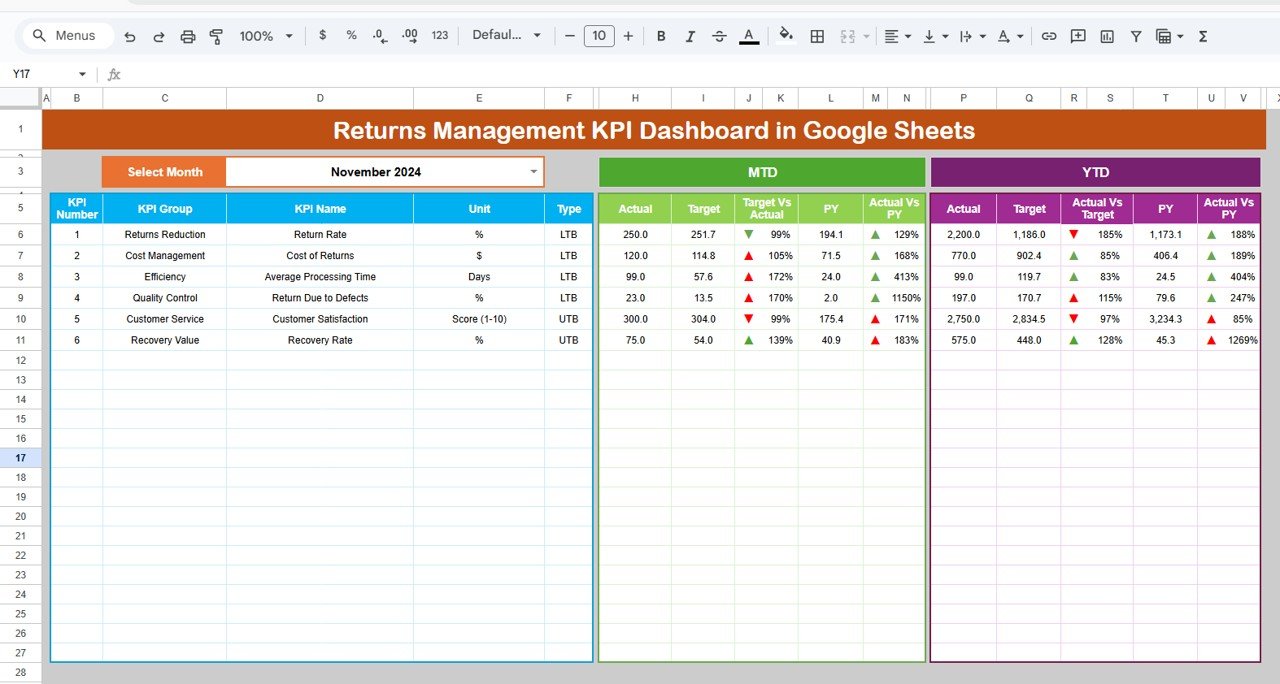
1️⃣ Dashboard Sheet – The main performance snapshot showing:
-
MTD Actual, Target, Previous Year
-
YTD Actual, Target, Previous Year
-
Target vs Actual comparison
-
PY vs Actual comparison
-
Visual conditional arrows
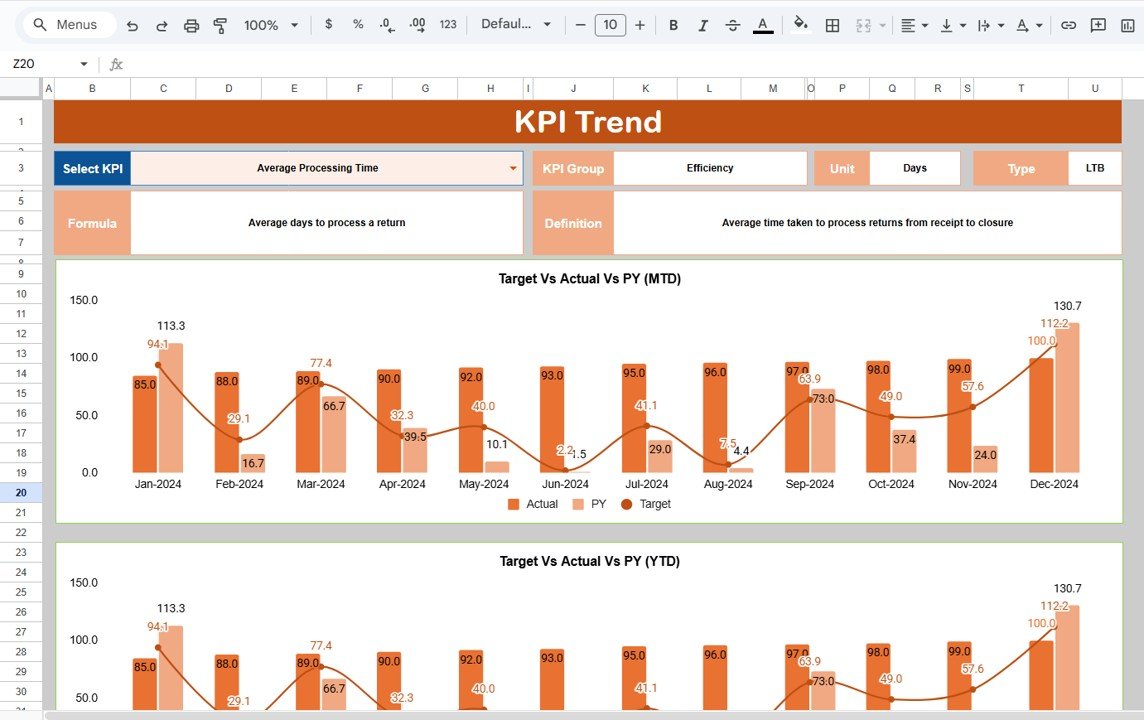
2️⃣ KPI Trend Sheet – Select a KPI from Cell C3 and view:
-
KPI Group
-
Unit
-
KPI Type (Lower the Better / Upper the Better)
-
Formula
-
Definition
-
Trend chart visualization
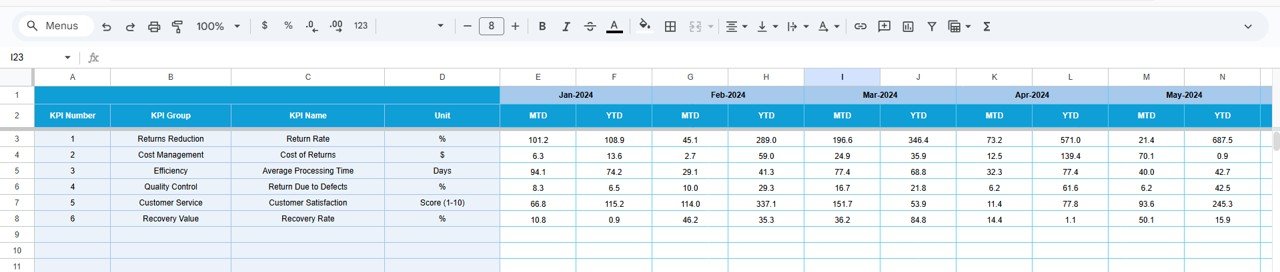
3️⃣ Actual Number Sheet – Enter MTD and YTD actual values. Change month in Cell E1 to align reporting.
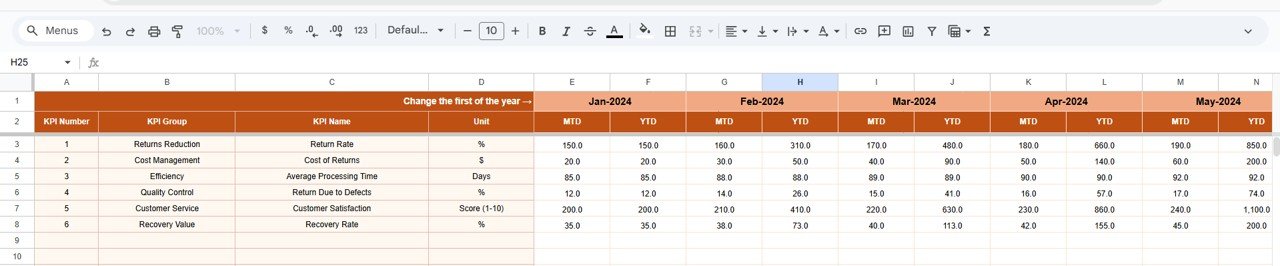
4️⃣ Target Sheet – Define monthly MTD and YTD targets for structured performance comparison.
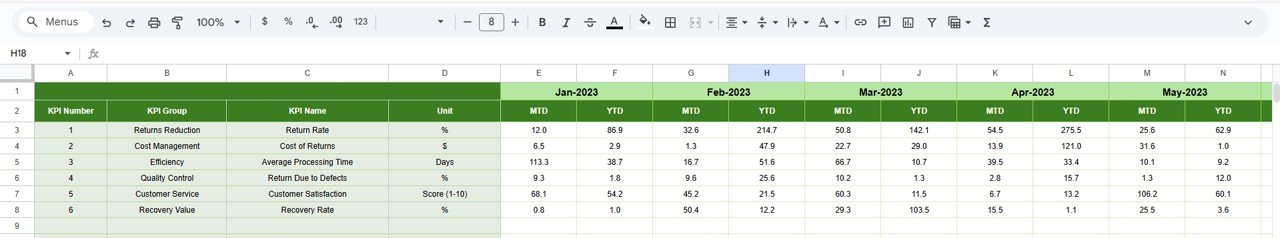
5️⃣ Previous Year Number Sheet – Store historical MTD and YTD data for growth analysis.
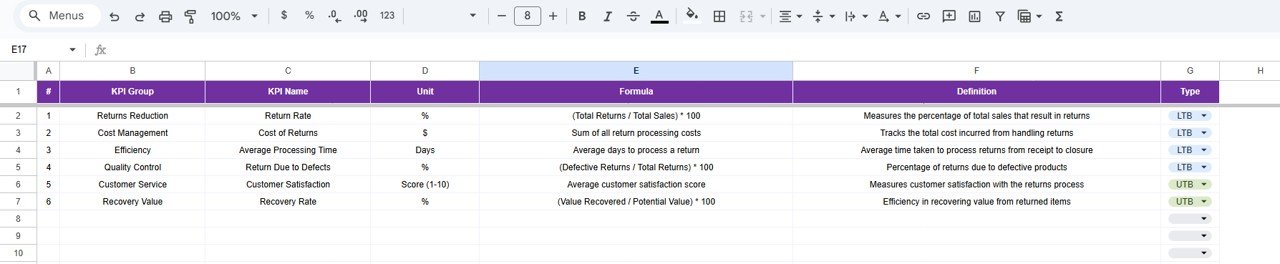
6️⃣ KPI Definition Sheet – Standardize KPI Name, Group, Unit, Formula, and Description.
The structured layout ensures clarity, accuracy, and professional reporting.
⚙️ How to Use the Returns Management KPI Dashboard in Google Sheets
Using the dashboard is simple and efficient:
1️⃣ Enter actual return data in the Actual Sheet.
2️⃣ Define targets in the Target Sheet.
3️⃣ Input previous year data in the Previous Year Sheet.
4️⃣ Define KPIs clearly in the KPI Definition Sheet.
5️⃣ Select the reporting month in Cell D3.
That’s it!
The dashboard automatically updates MTD, YTD, Target comparisons, and Year-over-Year analysis. Conditional arrows visually indicate performance improvement or decline, helping managers act immediately.
No advanced technical skills required.
🎯 Who Can Benefit from This Returns Management KPI Dashboard?
This dashboard is ideal for:
🏬 E-commerce Businesses
🏭 Manufacturing Companies
📦 Retail Stores
🚚 Logistics & Distribution Teams
🛍 Inventory Management Teams
💰 Finance & Cost Control Managers
📊 Operations Managers
Whether you manage a small store or a large distribution network, this Google Sheets dashboard adapts to your needs.
You can track KPIs such as:
-
Return Rate %
-
Refund Processing Time
-
Cost per Return
-
Return Approval Rate
-
Exchange Ratio
-
Damaged Product Rate
-
Customer Complaint Rate
-
Inventory Recovery Rate
Because it supports both Lower the Better (LTB) and Upper the Better (UTB) KPIs, it fits multiple return performance scenarios.
With real-time visibility and structured tracking, businesses reduce return losses, improve operational efficiency, and strengthen profitability.
This is not just a spreadsheet — it’s a strategic returns management system.
📖 Click here to read the Detailed blog post
Watch the step-by-step video tutorial: