Fleet operations never stop. Vehicles move every day. Fuel prices change frequently. Maintenance costs rise unexpectedly. Delivery commitments become tighter. Therefore, fleet managers must monitor utilization, cost, efficiency, and downtime continuously.
If you still rely on manual spreadsheets, you are losing visibility.
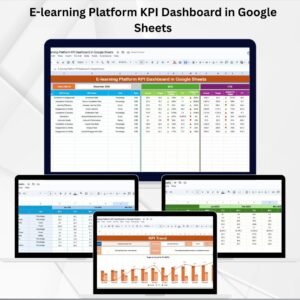
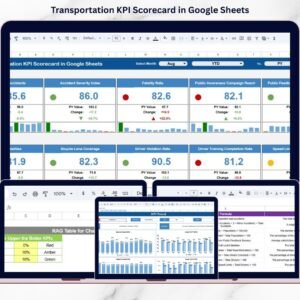
Now imagine tracking Fleet Utilization %, Fuel Efficiency, Downtime, Maintenance Cost, Revenue per Vehicle, Target vs Actual, and Year-over-Year Performance — all in one structured Google Sheets dashboard.
That is exactly what the Fleet Utilization KPI Dashboard in Google Sheets delivers.
This ready-to-use performance tracking system gives you complete control over fleet KPIs using automated calculations, dynamic comparisons, and real-time collaboration.
Stop reacting to problems. Start preventing them.
🚀 Key Features of Fleet Utilization KPI Dashboard in Google Sheets
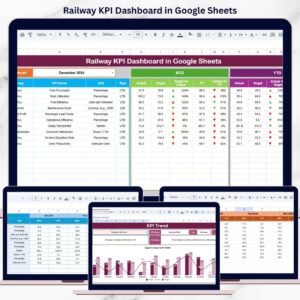
📊 6 Structured Worksheets for complete KPI management
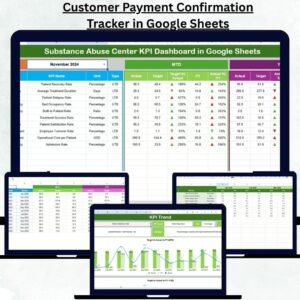
📅 MTD & YTD Performance Tracking
🎯 Target vs Actual Comparison
📈 Previous Year vs Current Year Growth Analysis
🔼 Conditional Formatting Indicators
🔎 Dynamic KPI Selection Dropdown
👥 Real-Time Multi-User Collaboration
⚙ Fully Customizable KPI Structure
📉 Trend Analysis Charts
Because it is built in Google Sheets, your team can update and monitor performance simultaneously from anywhere.
📦 What’s Inside the Fleet Utilization KPI Dashboard in Google Sheets
This dashboard contains 6 powerful worksheets designed for structured fleet performance tracking:
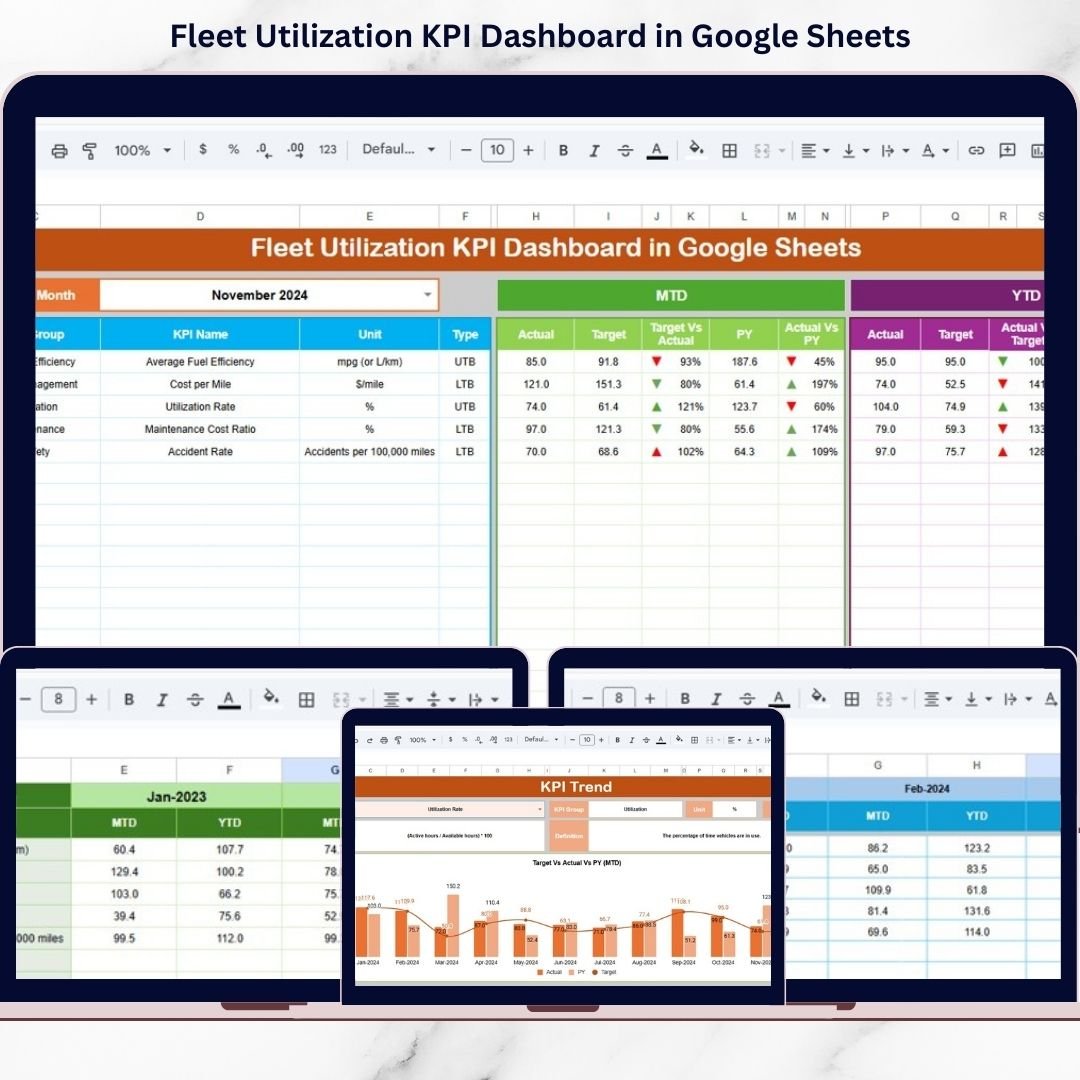
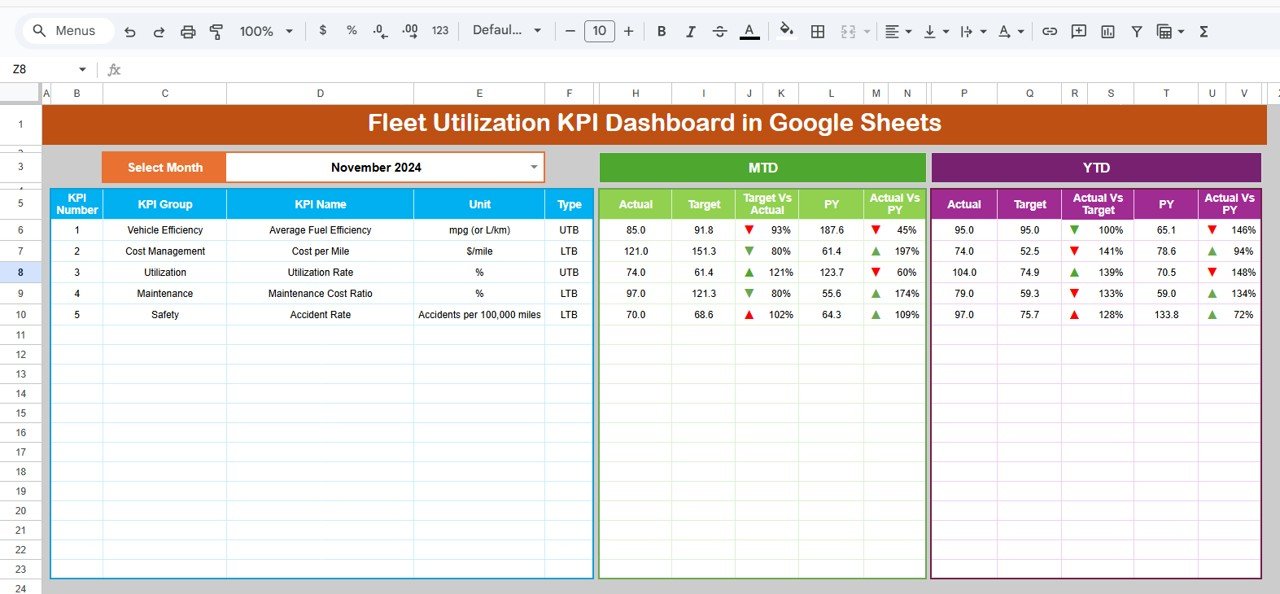
1️⃣ Dashboard Sheet – Central Performance View
This is the main control center.
Here you can:
-
Select Month (Cell D3)
-
View MTD Actual, Target & Previous Year
-
View YTD Actual, Target & Previous Year
-
Instantly see performance direction via arrows
Managers can quickly identify strong and weak KPIs without digging into raw data.
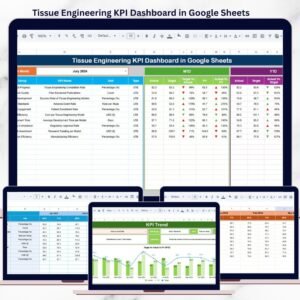
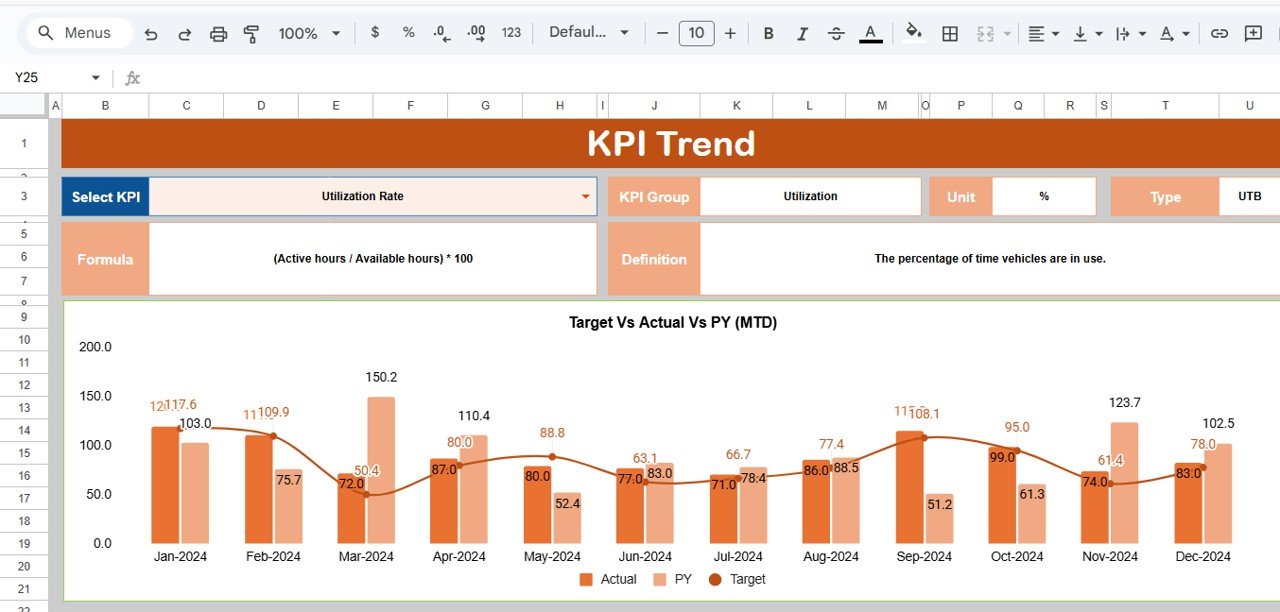
2️⃣ KPI Trend Sheet – Deep KPI Analysis
Select any KPI from dropdown (Cell C3) and view:
-
KPI Group
-
KPI Unit
-
KPI Type (Lower/Upper the Better)
-
Formula
-
Definition
-
Monthly Trend Chart
This helps you analyze long-term performance patterns instead of relying on one month’s data.
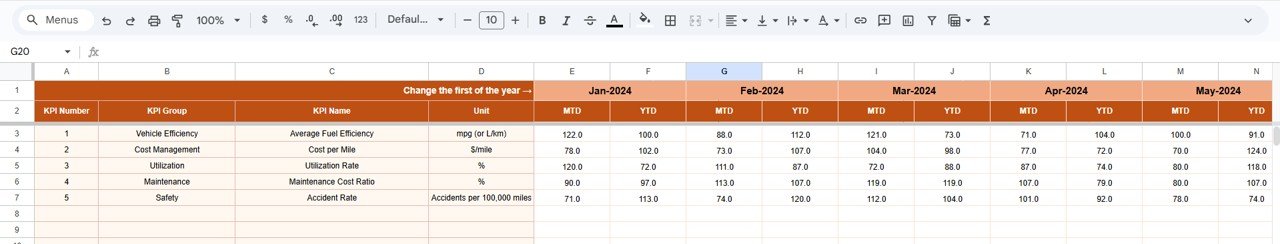
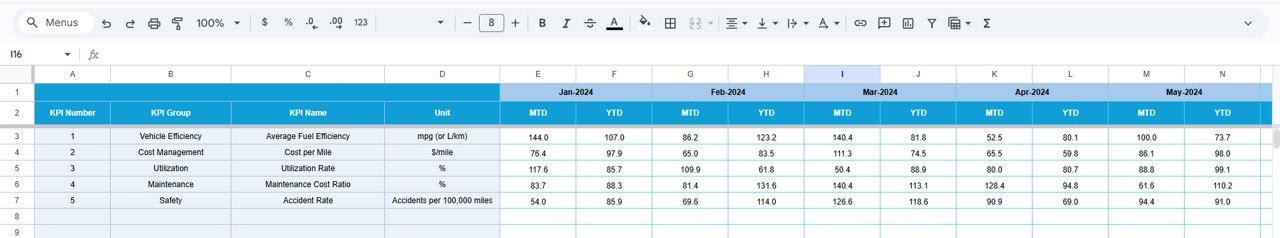
3️⃣ Actual Number Sheet – Data Entry Section
Enter actual MTD and YTD values here.
Key Feature:
-
Month setup in Cell E1
Once updated, the dashboard refreshes automatically.
4️⃣ Target Sheet – Goal Setting Area
Enter:
-
Monthly MTD Targets
-
YTD Targets
This enables automatic Target vs Actual comparison and accountability tracking.
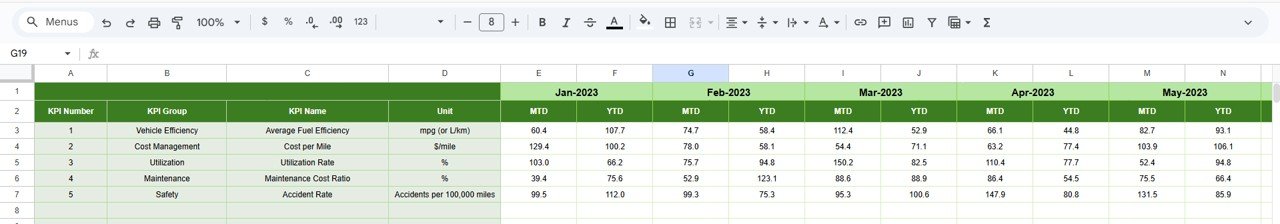
5️⃣ Previous Year Number Sheet – Historical Comparison
Enter last year’s values to unlock:
-
Year-over-Year comparison
-
Growth percentage calculation
-
Performance improvement tracking
Growth becomes measurable and strategic.
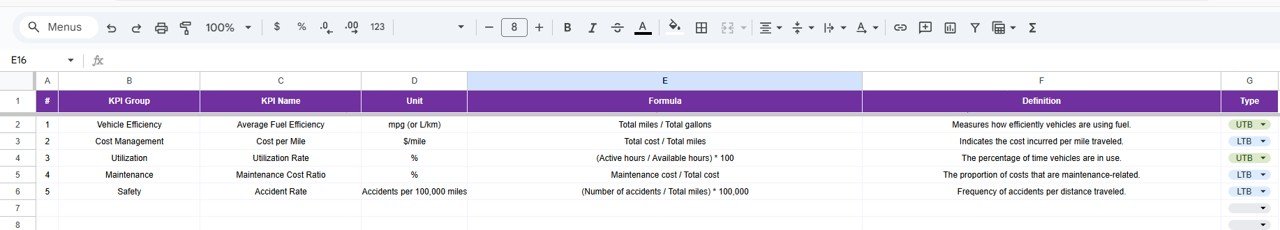
6️⃣ KPI Definition Sheet – Master KPI Logic
Maintain structured KPI definitions including:
-
KPI Name
-
KPI Group
-
Unit
-
Formula
-
KPI Definition
This ensures clarity and transparency across teams.
🛠 How to Use the Fleet Utilization KPI Dashboard in Google Sheets
Using this dashboard is simple:
1️⃣ Enter first month in setup cell
2️⃣ Input actual MTD & YTD data
3️⃣ Enter targets and previous year numbers
4️⃣ Select month from dropdown
5️⃣ Analyze dashboard insights
No advanced technical skills required.
👥 Who Can Benefit from This Fleet Utilization KPI Dashboard in Google Sheets
🚚 Logistics Companies
🚛 Transport Operators
📦 Delivery Businesses
🏗 Construction Vehicle Fleets
🚗 Rental Fleet Operators
📊 Fleet Managers
💰 Operations & Finance Teams
If you manage vehicles, fuel, cost, or performance, this dashboard becomes your daily decision tool.
By using this dashboard, you:
✔ Detect underutilized vehicles
✔ Monitor maintenance cost spikes
✔ Track fuel efficiency clearly
✔ Compare performance vs targets
✔ Measure year-over-year improvements
✔ Improve cost control
✔ Optimize fleet productivity
Instead of manually compiling reports, you focus on optimizing your fleet.
This is not just a Google Sheet. It is a complete fleet performance control system designed for modern fleet operations.
If you want higher utilization, lower cost, and smarter fleet decisions — this dashboard gives you the structure you need.
📖 Click here to read the Detailed blog post
Watch the step-by-step video tutorial: