The Flooring and Tiles KPI Dashboard never stands still. Customer preferences change quickly. Builders demand faster deliveries. Raw material prices fluctuate regularly. Meanwhile, competition grows every month.
If you still manage your performance using scattered Excel sheets, you are operating in the dark.
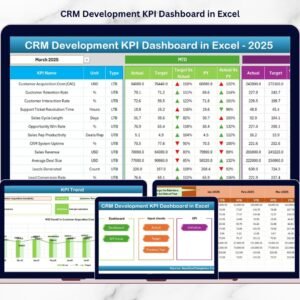
Now imagine tracking Revenue, Gross Margin, Net Profit, Inventory Turnover, Dealer Performance, MTD vs Target, YTD Growth, and Previous Year Comparison — all in one structured Excel dashboard.
That is exactly what the Flooring and Tiles KPI Dashboard in Excel delivers.
This ready-to-use dashboard gives you complete visibility into your business performance using dynamic comparisons, trend charts, and conditional indicators. As a result, you make faster decisions, reduce profit gaps, and stay ahead of competitors.
Stop guessing. Start measuring.
🚀 Key Features of Flooring and Tiles KPI Dashboard in Excel
📊 7 Structured Worksheets for complete KPI tracking
📅 MTD & YTD Performance Monitoring
🎯 Target vs Actual Comparison
📈 Previous Year Growth Analysis
🔼 Conditional Formatting Indicators (Green & Red Arrows)
🔎 Dropdown Month Selection for instant updates
🧭 Easy Navigation Buttons
🛠 Fully Customizable KPI Structure
📉 Trend Analysis Charts for long-term insights
Because it is built in Excel, you can update data easily and refresh results instantly.
📦 What’s Inside the Flooring and Tiles KPI Dashboard in Excel
This dashboard contains 7 powerful worksheets designed for structured performance monitoring:
1️⃣ Home Sheet
Your navigation hub.
Jump to any sheet instantly using clickable buttons. Save time and improve user experience.
2️⃣ Dashboard Sheet

The heart of the dashboard.
Here you can:
-
Select the month (Cell D3)
-
View MTD Actual, Target & Previous Year
-
View YTD Actual, Target & Previous Year
-
Compare growth visually
Conditional arrows instantly show performance status.
3️⃣ KPI Trend Sheet
Analyze performance over time.
You can:
-
Select KPI from dropdown
-
View KPI formula & definition
-
Track MTD and YTD trends
-
Compare Actual vs Target vs Previous Year
This sheet helps detect early warning signals.
4️⃣ Actual Numbers Input Sheet
Enter monthly performance data here.
Once you input data, the dashboard updates automatically.
You only enter data once — the system handles the rest.
5️⃣ Target Sheet
Set monthly and yearly goals.
Clear targets improve accountability and guide sales teams effectively.
6️⃣ Previous Year Numbers Sheet
Track growth with historical comparison.
Automatically calculate:
-
Growth %
-
Performance gaps
-
Improvement trends
7️⃣ KPI Definition Sheet
Understand every KPI clearly.
Includes:
-
KPI Name
-
Group
-
Unit
-
Formula
-
Definition
This ensures transparency and clarity across your team.
🛠 How to Use the Flooring and Tiles KPI Dashboard in Excel
Using this dashboard is simple:
1️⃣ Enter Actual data monthly
2️⃣ Input Target values
3️⃣ Add Previous Year numbers
4️⃣ Select month from dropdown
5️⃣ Review MTD and YTD comparisons
No advanced Excel skills required. The design is structured and user-friendly.
👥 Who Can Benefit from This Flooring and Tiles KPI Dashboard in Excel
🏭 Tile Manufacturers
🏪 Flooring Retailers
📦 Building Material Distributors
🏗️ Construction Supply Businesses
📊 Sales Managers
💰 Finance Teams
If you operate in the flooring supply chain, this dashboard becomes your performance control system.
By using this dashboard, you:
✔ Identify low-margin product lines
✔ Monitor dealer performance
✔ Track inventory turnover
✔ Improve cash flow visibility
✔ Compare actual vs target instantly
✔ Detect growth trends early
✔ Improve profitability consistently
Instead of spending hours creating reports, you focus on scaling your business.
This is not just an Excel file. It is a complete KPI management system designed for the flooring and tiles industry.
If you want better control, smarter decisions, and stronger growth — this dashboard delivers exactly what you need.