In firearms manufacturing, precision is everything. Accuracy, discipline, quality control, and strict regulatory compliance are non-negotiable. Firearms Manufacturing KPI Dashboard in Power BI A single performance gap can impact safety, compliance, and profitability.
If your production facility is still relying on scattered Excel sheets and manual reporting, you are operating with limited visibility. Managers struggle to track targets. Supervisors miss quality trends. Finance teams cannot compare performance year-over-year effectively.
It’s time to upgrade your performance monitoring system.
Firearms Manufacturing KPI Dashboard in Power BI the Firearms Manufacturing KPI Dashboard in Power BI is a professionally designed, ready-to-use interactive reporting solution built specifically for firearms production companies. It centralizes production, quality, safety, compliance, and financial KPIs into one powerful dashboard.
Because it connects to an Excel data source, you can update numbers easily while Power BI handles calculations, visualization, and analysis automatically.
Key Features of Firearms Manufacturing KPI Dashboard in Power BI 📊
🚀 Interactive Summary Page with Slicers for Month and KPI Group
📈 MTD & YTD Performance Tracking in one structured view
🎯 Target vs Actual Comparison with automatic calculation
🔄 Current Year vs Previous Year Analysis
🔺 Visual Performance Icons (▲ / ▼) for instant status identification
📊 Combo Charts for Trend Analysis
🧾 Drill-Through KPI Definition Page
📂 Excel-Connected Data Model for Easy Updates
Green ▲ highlights strong performance.
Red ▼ signals areas needing immediate attention.
Because of dynamic slicers, managers can filter by production, quality, safety, or financial KPIs instantly.
What’s Inside the Firearms Manufacturing KPI Dashboard in Power BI 📂
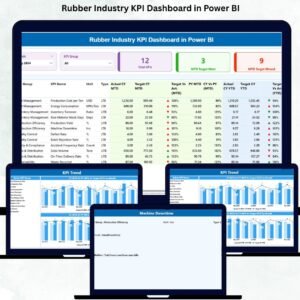
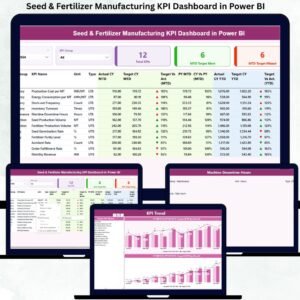
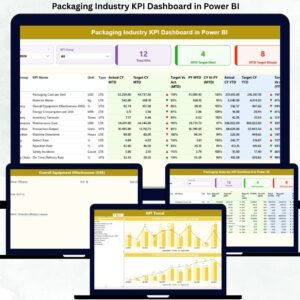
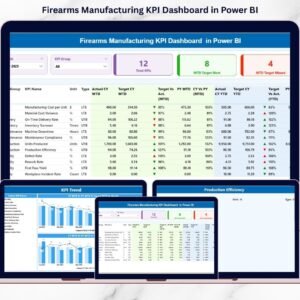
This Power BI solution contains 3 structured pages, each serving a specific function.
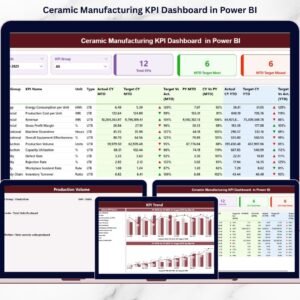
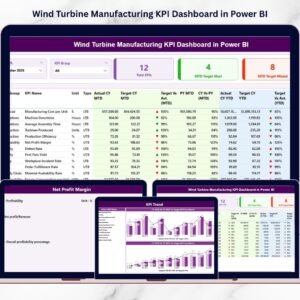
1️⃣ Summary Page – Central Performance Control
The Summary Page acts as the dashboard’s command center.
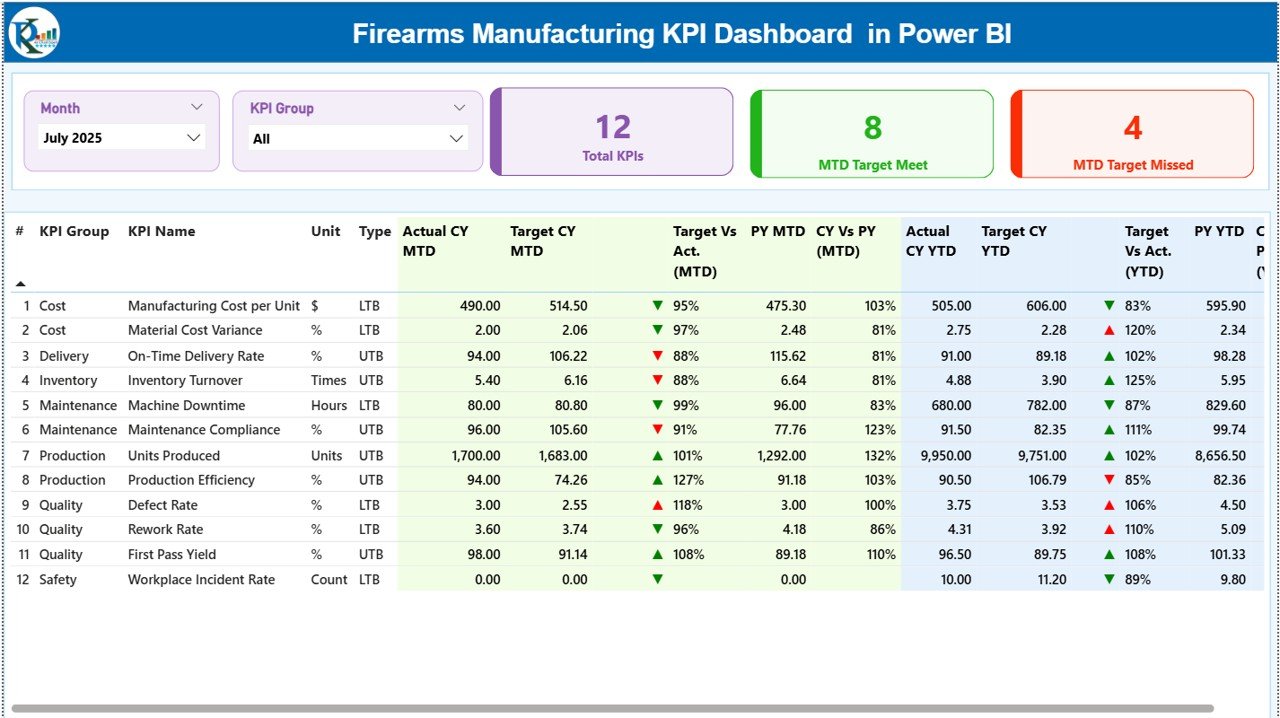
At the top, you will find:
-
Month Slicer
-
KPI Group Slicer
These filters allow flexible performance analysis.
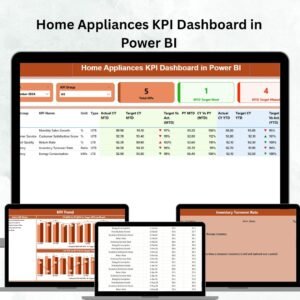
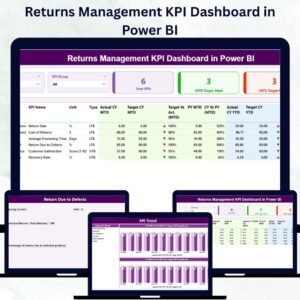
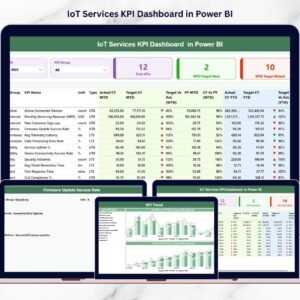
Below that, 3 KPI cards display:
-
Total KPI Count
-
MTD Target Meet Count
-
MTD Target Missed Count
This gives management immediate clarity on performance health.
The detailed KPI table includes:
-
KPI Number
-
KPI Group
-
KPI Name
-
Unit
-
Type (LTB / UTB)
-
Actual CY MTD
-
Target CY MTD
-
MTD Icon
-
Target vs Actual %
-
PY MTD
-
CY vs PY %
-
YTD Metrics
Formulas used:
Actual MTD / Target MTD
Current Year / Previous Year
This structure allows both short-term and long-term evaluation.
2️⃣ KPI Trend Page – Visual Performance Insights
The KPI Trend page transforms numbers into visuals.
Select a KPI from the slicer and instantly view:
📈 MTD Combo Chart
📊 YTD Combo Chart
Each chart compares:
-
Current Year Actual
-
Target
-
Previous Year
This helps identify:
Seasonal patterns
Performance drops
Target gaps
Growth trends
Instead of reading reports, managers interpret trends visually.
3️⃣ KPI Definition Page – Drill-Through Transparency
This hidden page ensures clarity in KPI calculations.
By drilling through from the Summary Page, users can view:
-
KPI Formula
-
KPI Definition
-
KPI Unit
-
KPI Type
This promotes accountability and data transparency across departments.
How to Use the Firearms Manufacturing KPI Dashboard in Power BI ⚙️
Setup is simple:
1️⃣ Enter monthly MTD and YTD actual values in the Excel Input Actual sheet.
2️⃣ Update targets in the Input Target sheet.
3️⃣ Maintain structured KPI definitions in KPI Definition sheet.
4️⃣ Refresh Power BI.
The dashboard updates automatically.
Always use the first date of the month (e.g., 01-Jan-2024) to ensure accurate time intelligence calculations.
The slicers allow flexible analysis without modifying the report structure.
Who Can Benefit from This Firearms Manufacturing KPI Dashboard in Power BI 🎯
This dashboard is ideal for:
✔ Production Managers
✔ Quality Control Teams
✔ Compliance Officers
✔ Plant Supervisors
✔ Finance & Cost Control Teams
✔ Manufacturing Executives
It supports KPIs such as:
Units Produced
Production Efficiency %
Machine Utilization %
Defect Rate
Rework %
Safety Incident Count
Compliance Audit Score
Cost per Unit
Gross Profit Margin
Whether you operate a small manufacturing unit or a large-scale production plant, this dashboard enhances control and visibility.
Instead of reactive management, you gain proactive decision-making.
The Firearms Manufacturing KPI Dashboard in Power BI transforms operational data into structured intelligence. It improves compliance monitoring, enhances quality tracking, supports cost control, and strengthens production efficiency.
If your goal is precision in reporting that matches precision in manufacturing — this Power BI dashboard delivers the control you need.
Click here to read the Detailed blog post
Visit our YouTube channel to learn step-by-step video tutorials:
👉 https://www.youtube.com/@PKAnExcelExpert