Knowledge is one of the most valuable assets in any organization. However, when employees leave, roles change, or systems evolve, critical knowledge often disappears silently. Without measurement, organizations cannot protect what they cannot see.
That is exactly where the Knowledge Preservation KPI Dashboard in Excel becomes a game-changing solution.
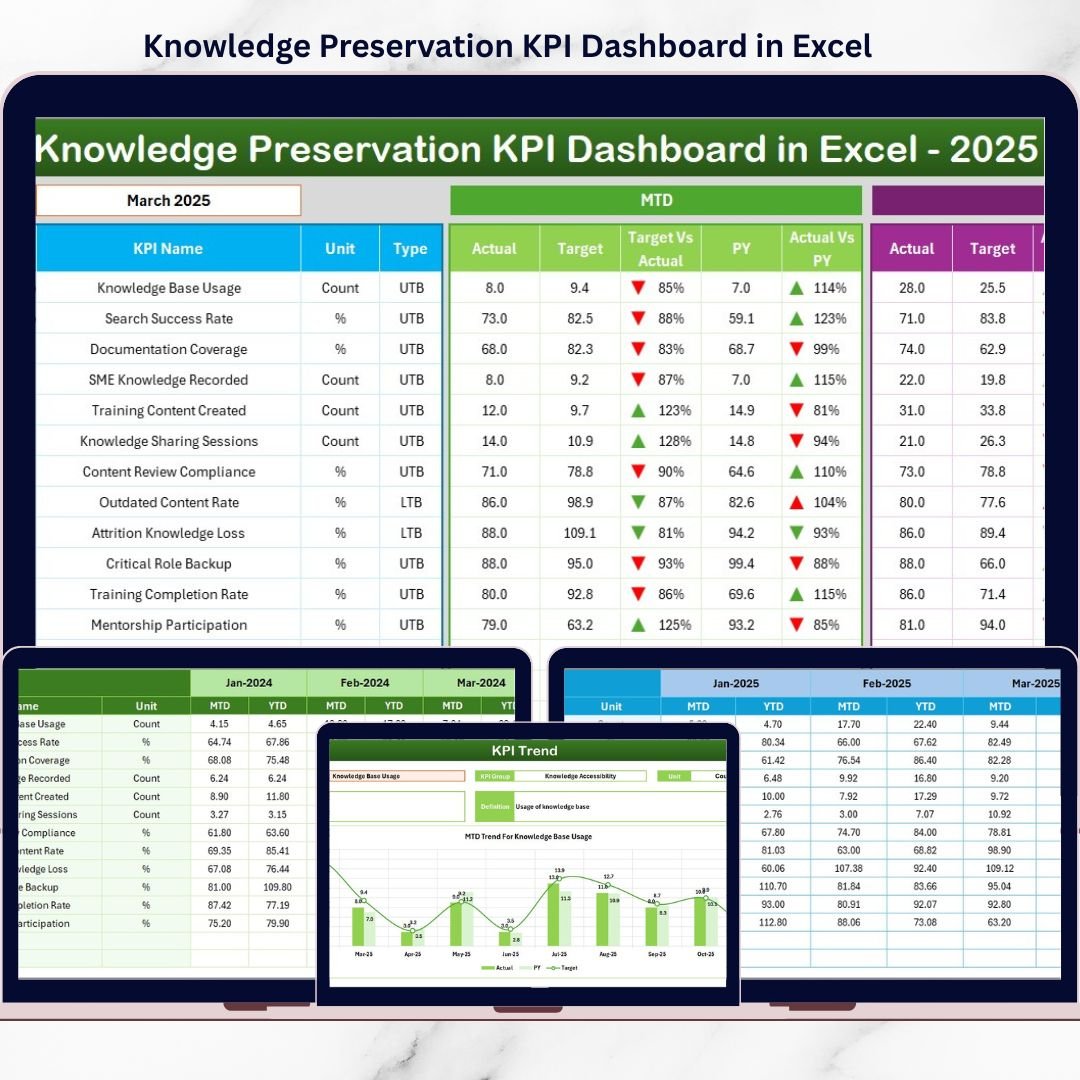
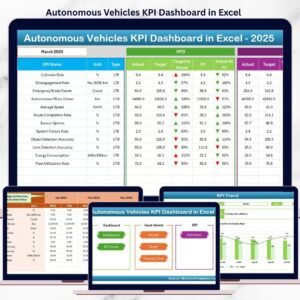
This ready-to-use Excel dashboard helps organizations measure, monitor, and protect knowledge assets using clearly defined KPIs, MTD & YTD tracking, trend analysis, and performance indicators—all inside Excel. Instead of relying on assumptions, leaders gain clear, data-driven visibility into knowledge continuity, gaps, and risks.
🔑 Key Features of Knowledge Preservation KPI Dashboard in Excel
📊 Comprehensive KPI Monitoring
Track knowledge retention, documentation coverage, transfer effectiveness, and dependency risks in one centralized dashboard.
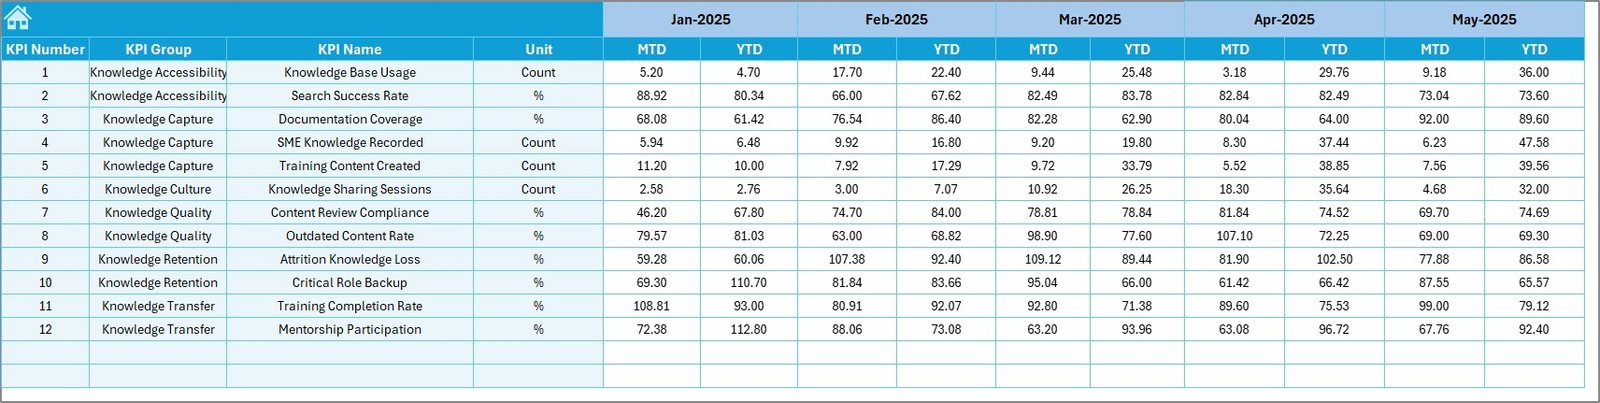
📅 MTD & YTD Performance Tracking
Monitor short-term and long-term knowledge preservation performance using Month-to-Date and Year-to-Date views.
🎯 Target vs Actual Comparison
Instantly identify gaps using Actual vs Target and Previous Year vs Actual comparisons with visual indicators.
📈 Trend Analysis for Proactive Action
Analyze historical trends to identify early warning signs of knowledge loss before risks escalate.
🧭 Centralized Navigation with Home Sheet
Quickly navigate between Dashboard, KPI Trend, Input, Target, Previous Year, and KPI Definition sheets.
🎨 Visual Performance Indicators
Conditional formatting with up/down arrows makes performance interpretation fast and intuitive.
⚙️ Fully Excel-Native & Customizable
No external tools required. Modify KPIs, targets, and data easily to match your organization’s needs.
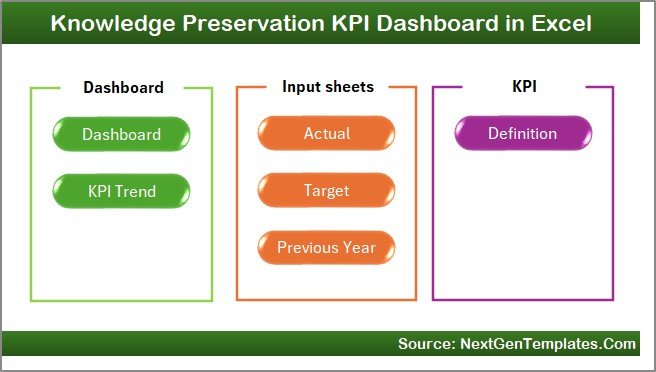
📦 What’s Inside the Knowledge Preservation KPI Dashboard?
📁 Home Sheet – A clean navigation hub with buttons to access all sections instantly.
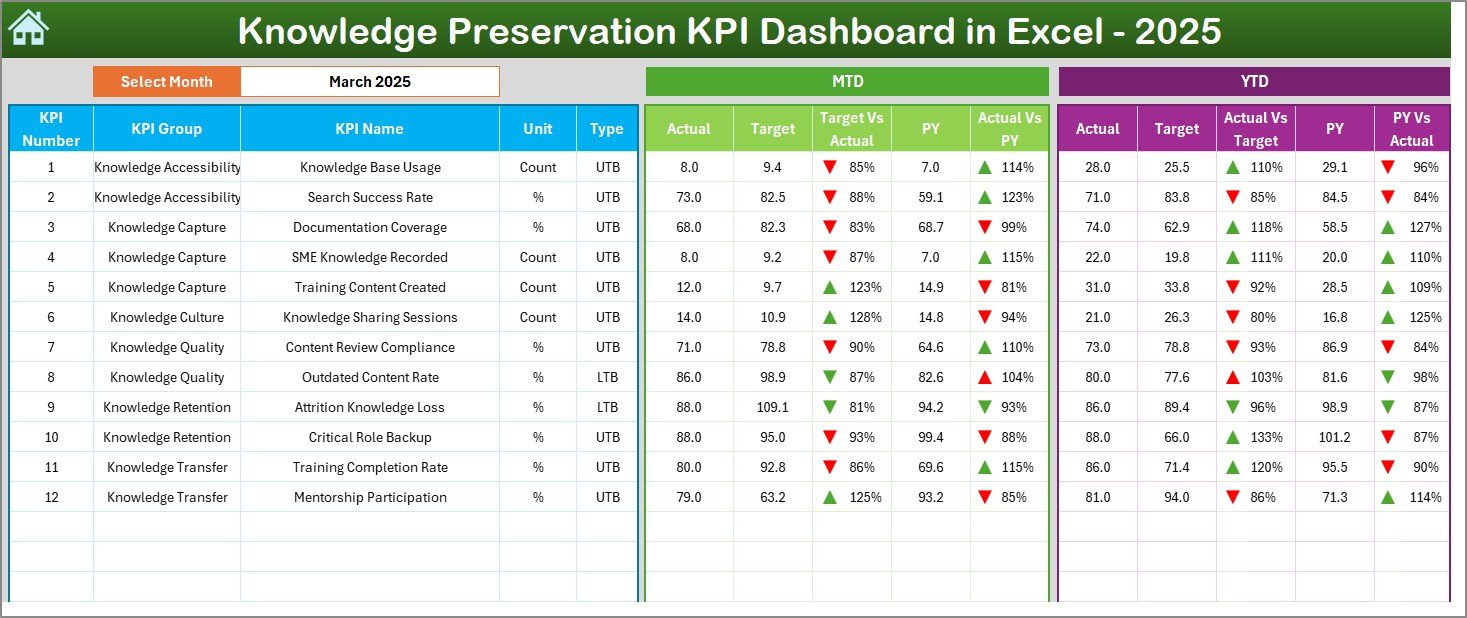
📊 Dashboard Sheet – Displays all KPIs with MTD & YTD Actual, Target, Previous Year, and performance indicators.
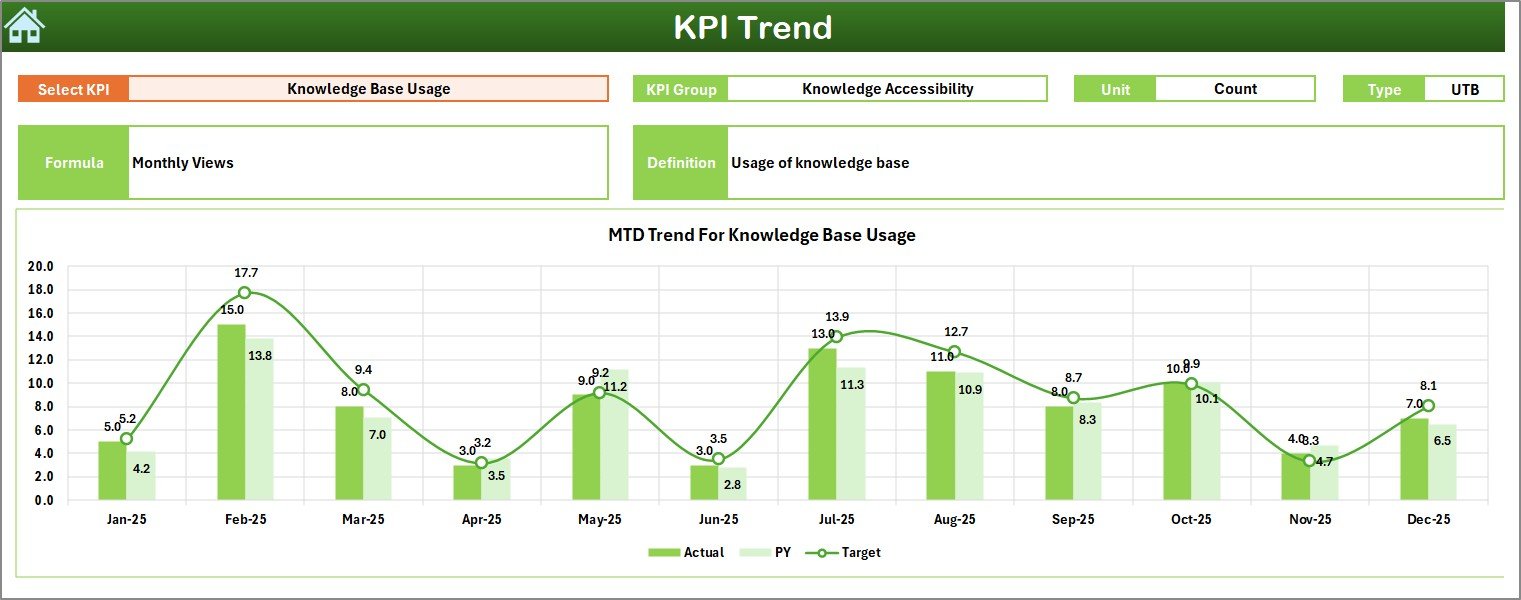
📈 KPI Trend Sheet – Analyze individual KPIs with MTD & YTD trend charts, definitions, and formulas.
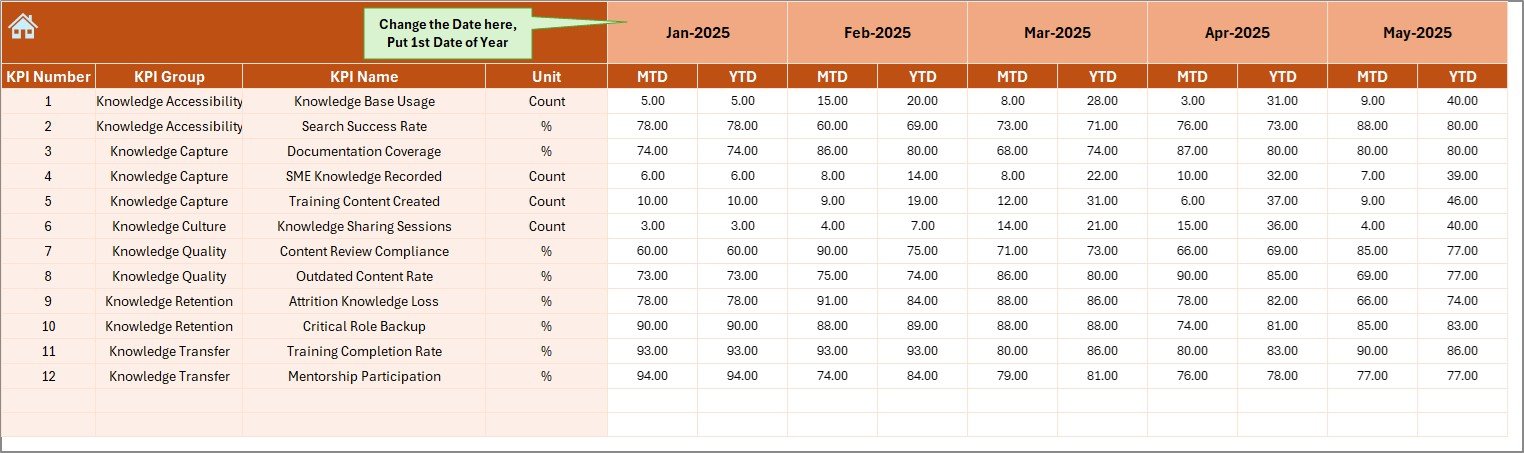
📝 Actual Numbers Input Sheet – Enter current year MTD & YTD actual values with flexible month selection.
🎯 Target Sheet – Define MTD & YTD targets for every knowledge KPI.
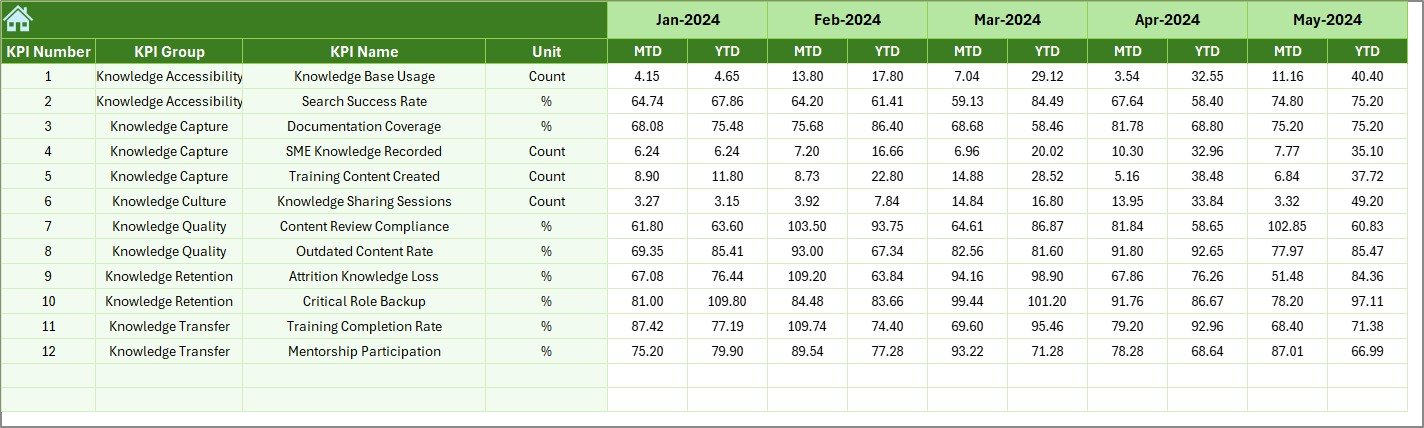
📊 Previous Year Numbers Sheet – Store historical data for year-over-year comparison.
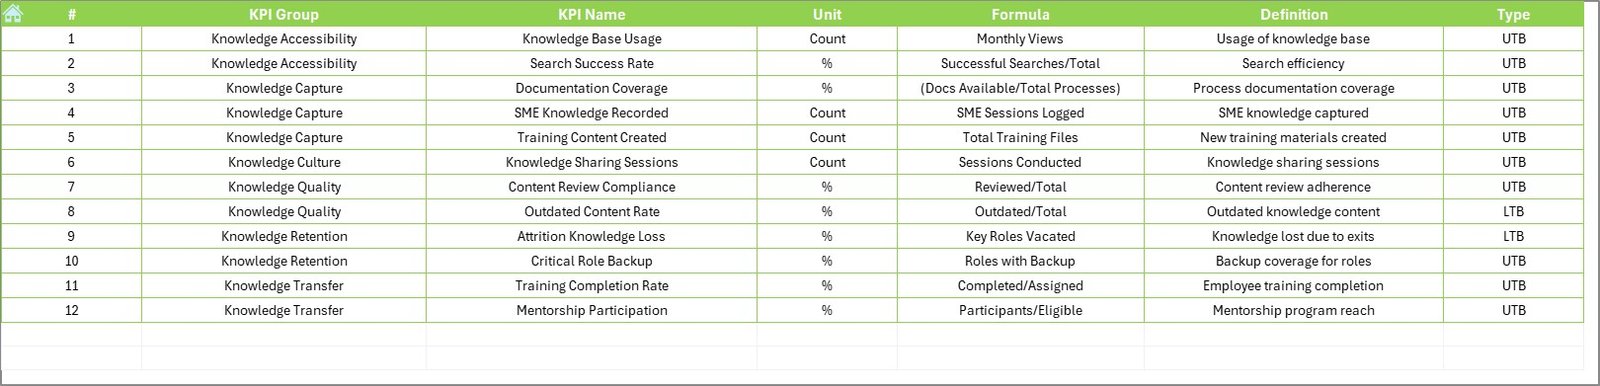
📘 KPI Definition Sheet – Maintain KPI name, group, unit, formula, definition, and KPI type (LTB / UTB).
🛠️ How to Use the Knowledge Preservation KPI Dashboard in Excel
1️⃣ Define your knowledge KPIs in the KPI Definition Sheet
2️⃣ Enter MTD & YTD targets in the Target Sheet
3️⃣ Update actual performance in the Actual Numbers Input Sheet
4️⃣ Select the reporting month from the Dashboard Sheet
5️⃣ Review MTD & YTD performance instantly
6️⃣ Use the KPI Trend Sheet to analyze patterns and risks
7️⃣ Take corrective actions to strengthen knowledge continuity
No advanced Excel skills required—this dashboard is beginner-friendly and management-ready.
👥 Who Can Benefit from This Knowledge Preservation KPI Dashboard?
🏢 HR & Learning Teams – Track training effectiveness and knowledge transfer
📚 Knowledge Management Teams – Measure documentation and retention maturity
⚙️ Operations & Process Teams – Reduce dependency on key individuals
🛡️ Risk & Compliance Teams – Improve continuity and audit readiness
💼 Leadership & Management – Gain visibility into organizational knowledge risks
🏭 Small to Large Organizations – Scale knowledge preservation effortlessly
📖 Click here to read the Detailed blog post
▶️ Visit our YouTube channel to learn step-by-step video tutorials
👉 https://youtube.com/@PKAnExcelExpert


Reviews
There are no reviews yet.