Business transformation fails when progress is not measured clearly. Many organizations invest heavily in change initiatives but struggle to track outcomes, alignment, and real impact. That is exactly where the Business Transformation KPI Dashboard in Excel delivers value.
This ready-to-use Excel dashboard turns complex transformation data into clear, actionable insights. Instead of relying on assumptions, scattered spreadsheets, or static reports, you get a centralized, interactive KPI tracking system that shows exactly how your transformation initiatives are performing—month by month and year by year.
Whether you are driving digital transformation, cost optimization, operational efficiency, or cultural change, this dashboard helps you measure what truly matters and act with confidence.
🔑 Key Features of Business Transformation KPI Dashboard in Excel
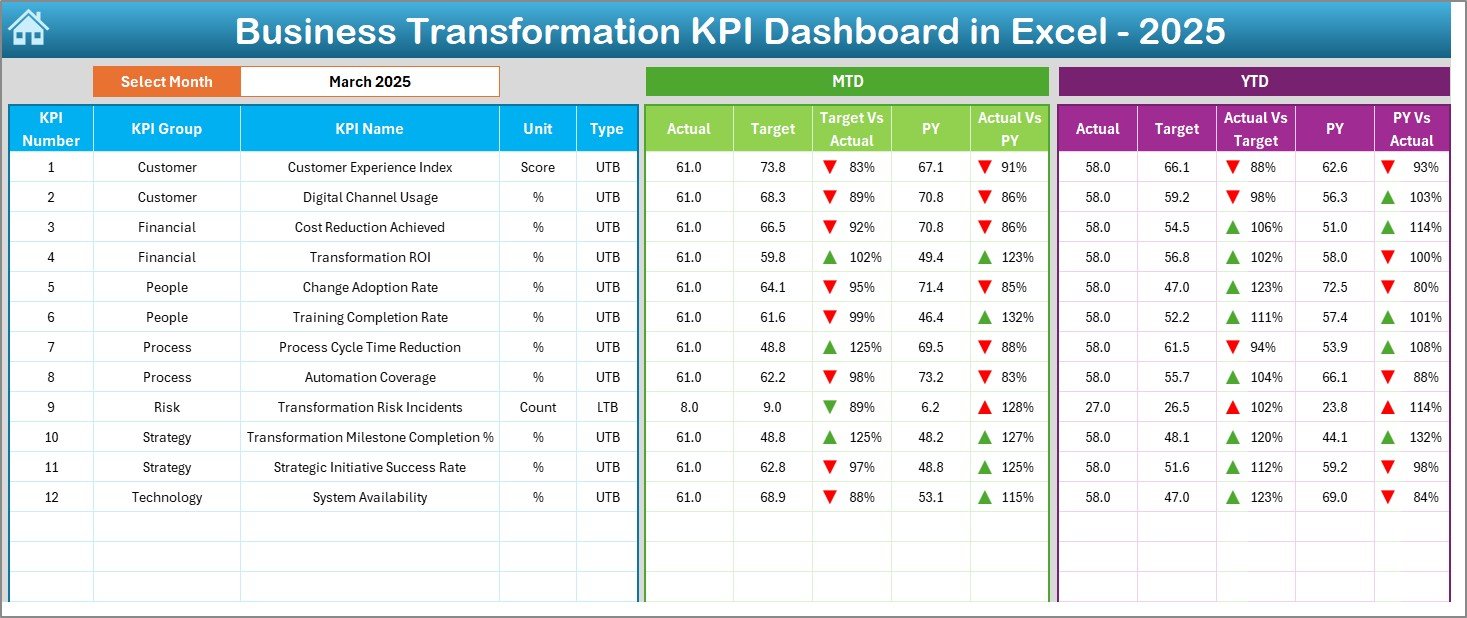
🚀 Interactive Month Selection
Select any month from a dropdown and instantly update the entire dashboard with fresh insights.
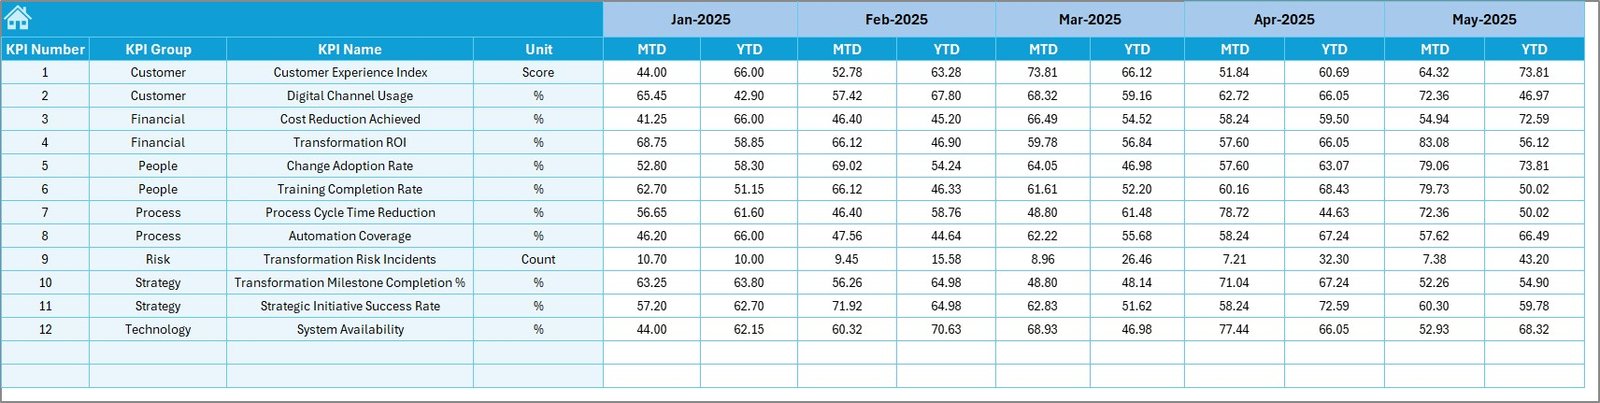
📈 MTD & YTD Performance Tracking
Monitor Month-to-Date and Year-to-Date performance for every transformation KPI.
🎯 Target vs Actual Comparison
Clearly see gaps between planned targets and actual results using smart variance indicators.
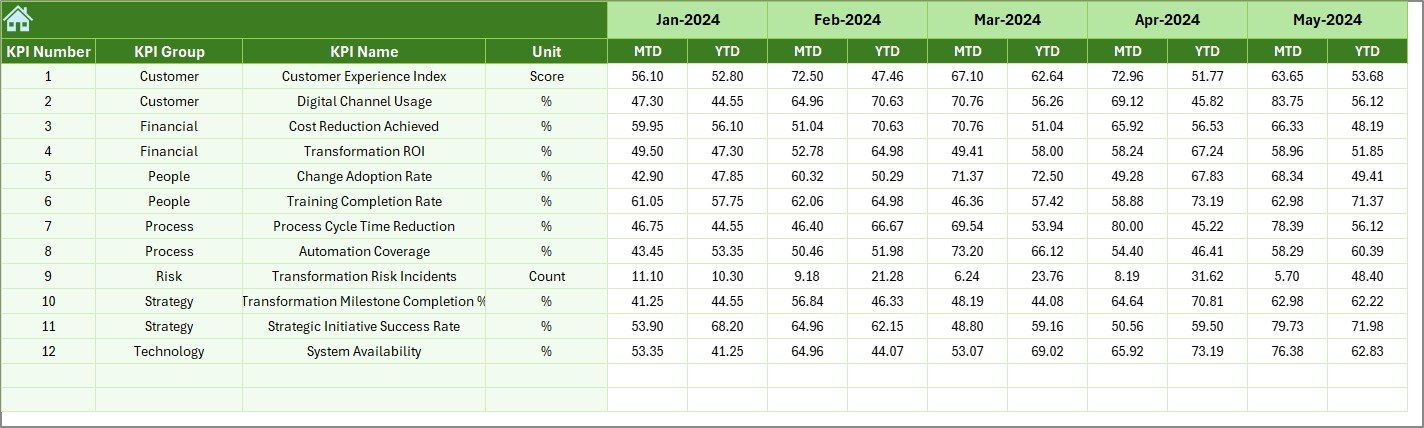
🔁 Previous Year Comparison
Track real improvement by comparing current performance with last year’s numbers.
📊 Visual Performance Indicators
Up/down arrows and conditional formatting highlight success areas and risks instantly.
🧭 Executive-Friendly Navigation
One-click buttons allow quick movement between dashboard sections without confusion.
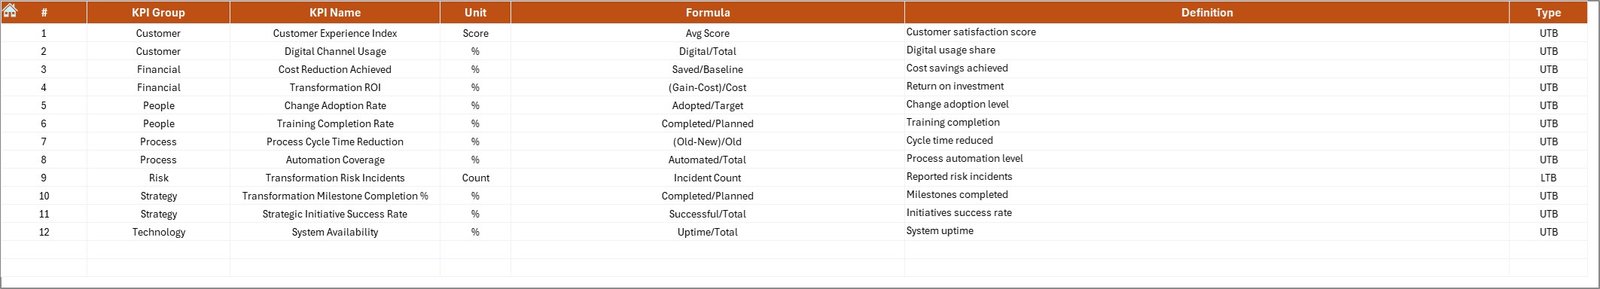
🧩 Structured KPI Governance
Dedicated KPI definition sheet ensures clarity, consistency, and accountability.
💼 Excel-Based & Cost-Effective
No BI tools, no subscriptions—just powerful analytics inside familiar Excel.
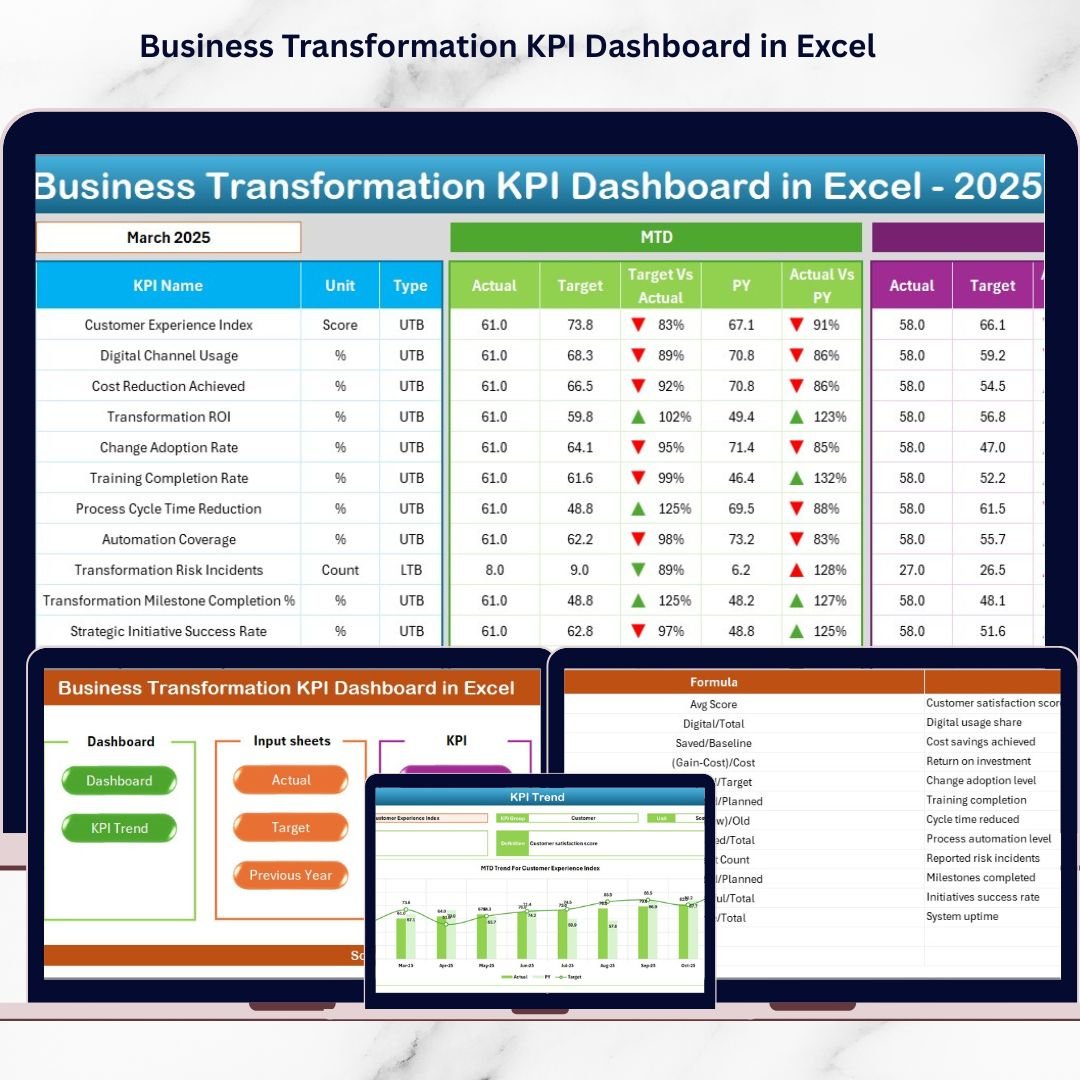
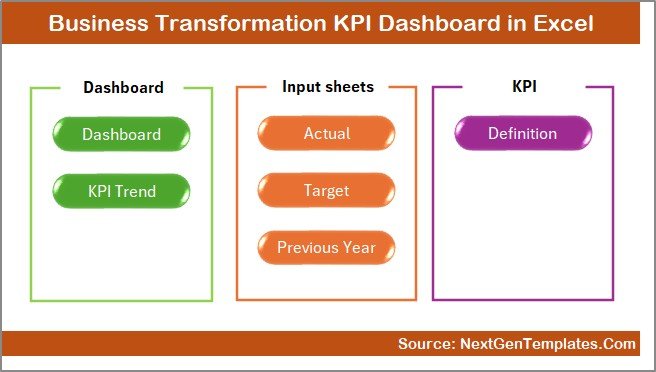
📦 What’s Inside the Business Transformation KPI Dashboard in Excel
📁 Summary (Home) Sheet
Acts as a navigation hub with clean layout and quick-access buttons.
📊 Main Dashboard Sheet
Displays MTD & YTD Actual, Target, and Previous Year values with variance analysis.
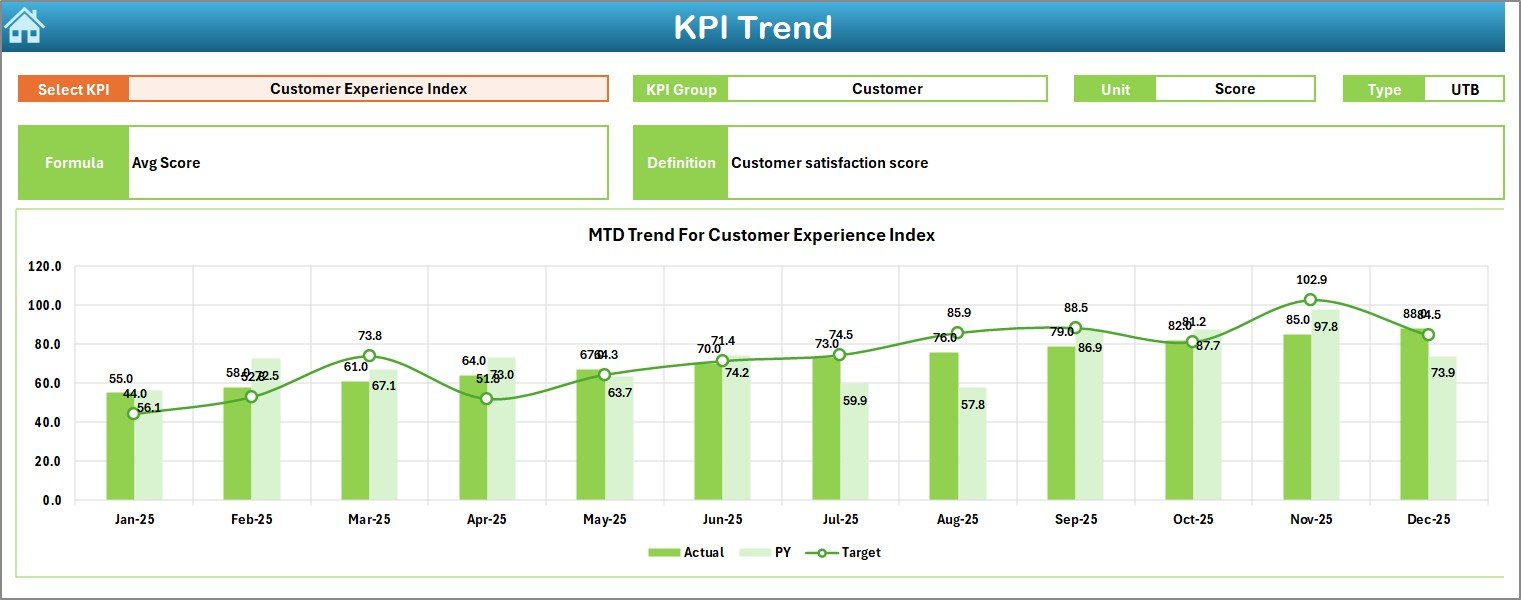
📉 KPI Trend Sheet
Analyze individual KPIs over time with dynamic trend charts and KPI metadata.
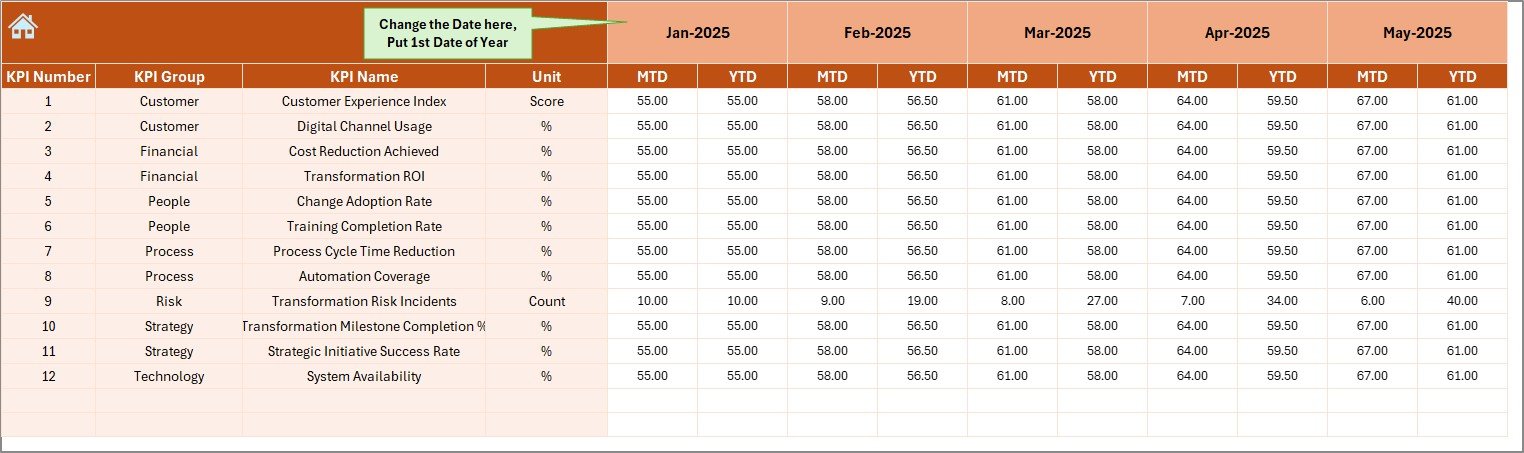
📝 Actual Numbers Input Sheet
Enter real performance data in a structured and protected input area.
🎯 Target Sheet
Define monthly and yearly performance goals for each KPI.
📅 Previous Year Numbers Sheet
Capture historical data for accurate year-over-year comparison.
📘 KPI Definition Sheet
Store KPI groups, formulas, units, definitions, and KPI types (LTB / UTB).
🛠️ How to Use the Business Transformation KPI Dashboard in Excel
1️⃣ Enter actual MTD and YTD data in the input sheet
2️⃣ Define targets and previous year values
3️⃣ Select the reporting month from the dropdown
4️⃣ Review dashboard KPIs, variances, and trends
5️⃣ Identify gaps, risks, and improvement opportunities
6️⃣ Use insights to drive transformation decisions
No advanced Excel skills required—just enter data and analyze results.
👥 Who Can Benefit from This Business Transformation KPI Dashboard
👔 Business Leaders & Executives – Gain high-level visibility into transformation progress
📌 Transformation Managers – Track initiatives and ensure accountability
📊 Strategy & PMO Teams – Measure outcomes against strategic goals
🏭 Operations Managers – Monitor efficiency and process improvement
📈 Performance Analysts – Analyze trends and KPI movements
🧠 Consultants & Advisors – Deliver structured transformation reporting to clients
Any organization undergoing change will benefit from this dashboard.
Click here to read the Detailed Blog Post
Watch the step-by-step video tutorial:


Reviews
There are no reviews yet.