Running a convenience store may look simple, but in reality it involves thousands of transactions, multiple product categories, varied payment modes, shift-wise operations, and regional performance differences—every single day. When data stays scattered across Excel files and static MIS reports, visibility drops and decision-making slows down.
That is exactly where a Convenience Stores Dashboard in Power BI becomes a game-changer.
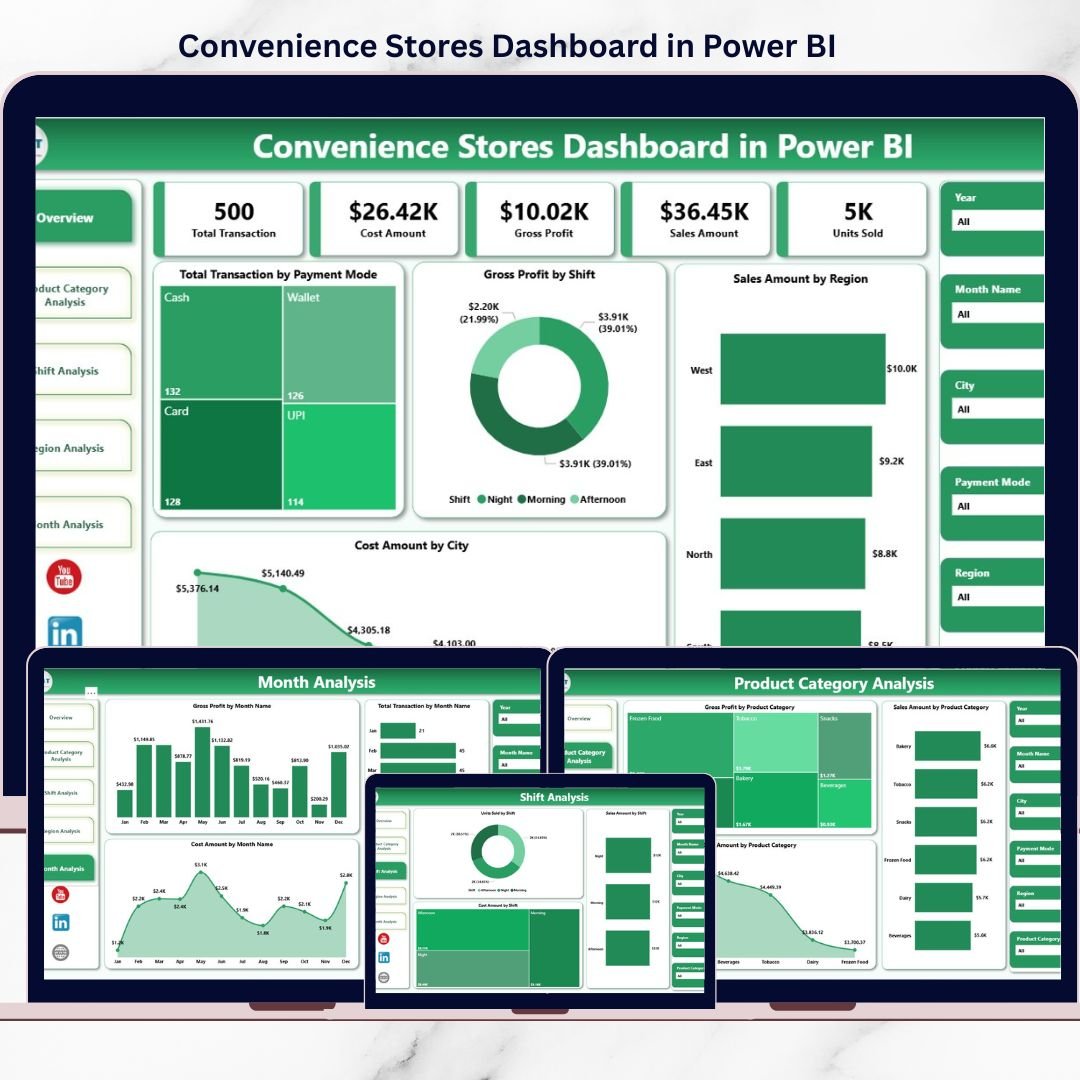
This ready-to-use Power BI dashboard transforms raw transaction data into clear, interactive, and actionable insights. It helps convenience store owners, operations managers, and regional heads track sales, cost, gross profit, transactions, shifts, product categories, regions, and monthly trends—all in one centralized dashboard.
Instead of reacting late, you gain real-time clarity to take faster, smarter, and more profitable decisions.
🚀 Key Features of Convenience Stores Dashboard in Power BI
📊 Centralized Retail Performance View
Track sales, cost, profit, and transactions across all stores and locations in one dashboard.
⚡ Real-Time Interactive Analysis
Use slicers to analyze performance by month, region, shift, product category, and payment mode.
💰 Sales, Cost & Profit Tracking
Instant visibility into gross profit, cost behavior, and revenue contribution.
🕒 Shift-Wise Performance Analysis
Identify which shifts generate the highest profit and where inefficiencies exist.
📦 Product Category Insights
Understand which categories drive revenue, profit, or cost leakage.
🌍 Regional & City-Level Comparison
Compare performance across cities and regions to optimize operations.
📈 Trend & Seasonality Tracking
Analyze month-wise trends to support forecasting and planning.
🔐 Scalable & Secure Power BI Design
Built on Power BI for performance, scalability, and professional reporting.
📦 What’s Inside the Convenience Stores Dashboard in Power BI
This dashboard includes 5 professionally designed analytical pages, each answering a critical retail business question.
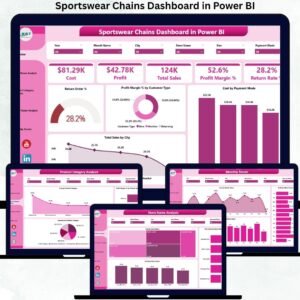
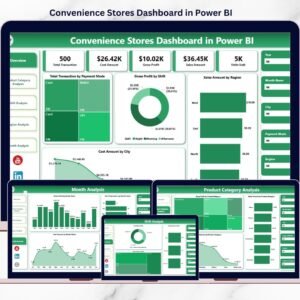
🧭 1️⃣ Overview Page – Complete Business Snapshot
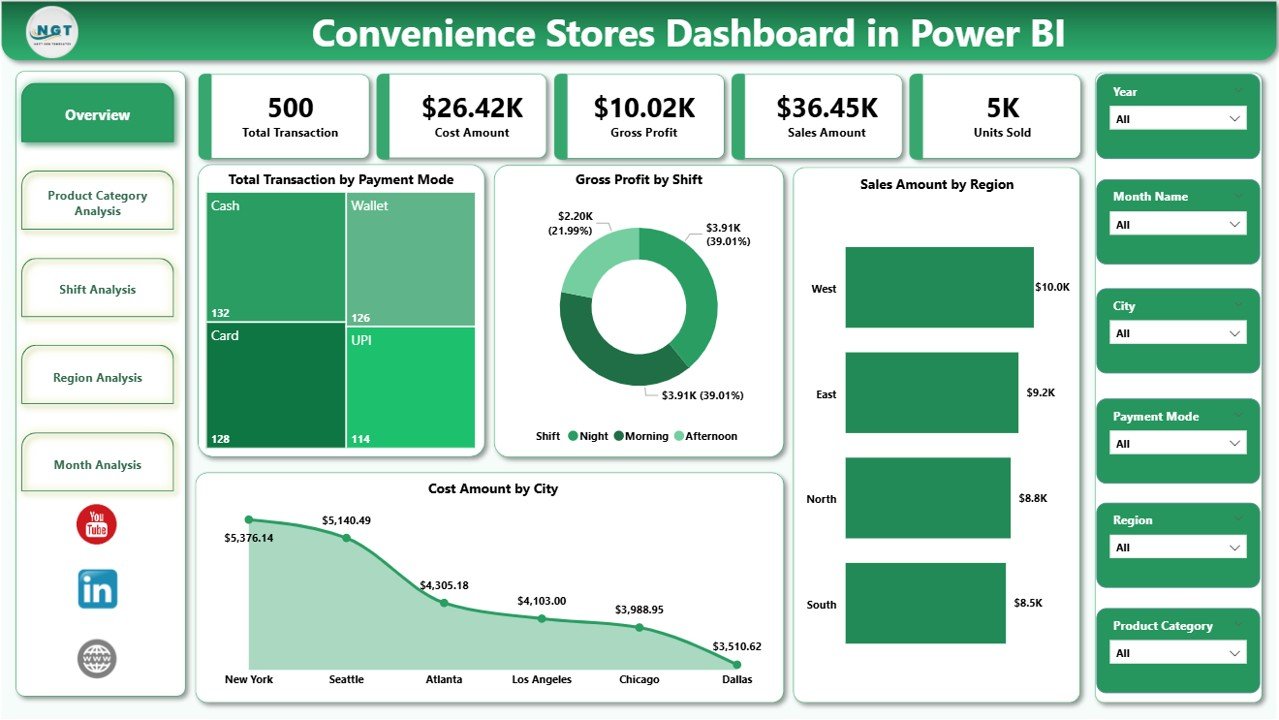
The Overview Page acts as the executive summary of the dashboard.
Key Insights Displayed
-
Total Transactions by Payment Mode
-
Gross Profit by Shift
-
Sales Amount by Region
-
Cost Amount by City
-
Overall operational performance
This page helps decision-makers instantly answer:
-
Which payment modes customers prefer
-
Which shifts generate the highest profit
-
Which regions drive sales
-
Where costs are increasing
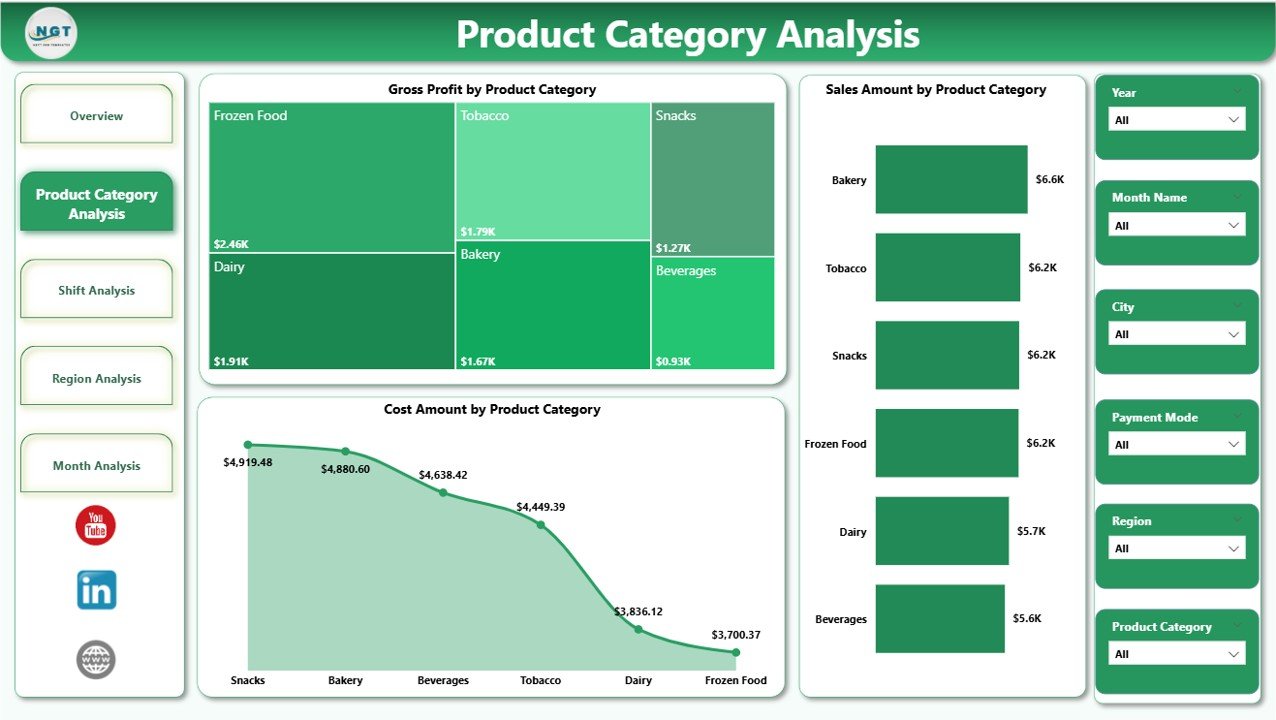
📦 2️⃣ Product Category Analysis – What Products Drive Profit?
The Product Category Analysis Page focuses on category-level performance.
Key Visuals
-
Gross Profit by Product Category
-
Sales Amount by Product Category
-
Cost Amount by Product Category
This page helps you:
-
Identify high-margin categories
-
Spot categories with high sales but low profit
-
Optimize pricing, promotions, and shelf space
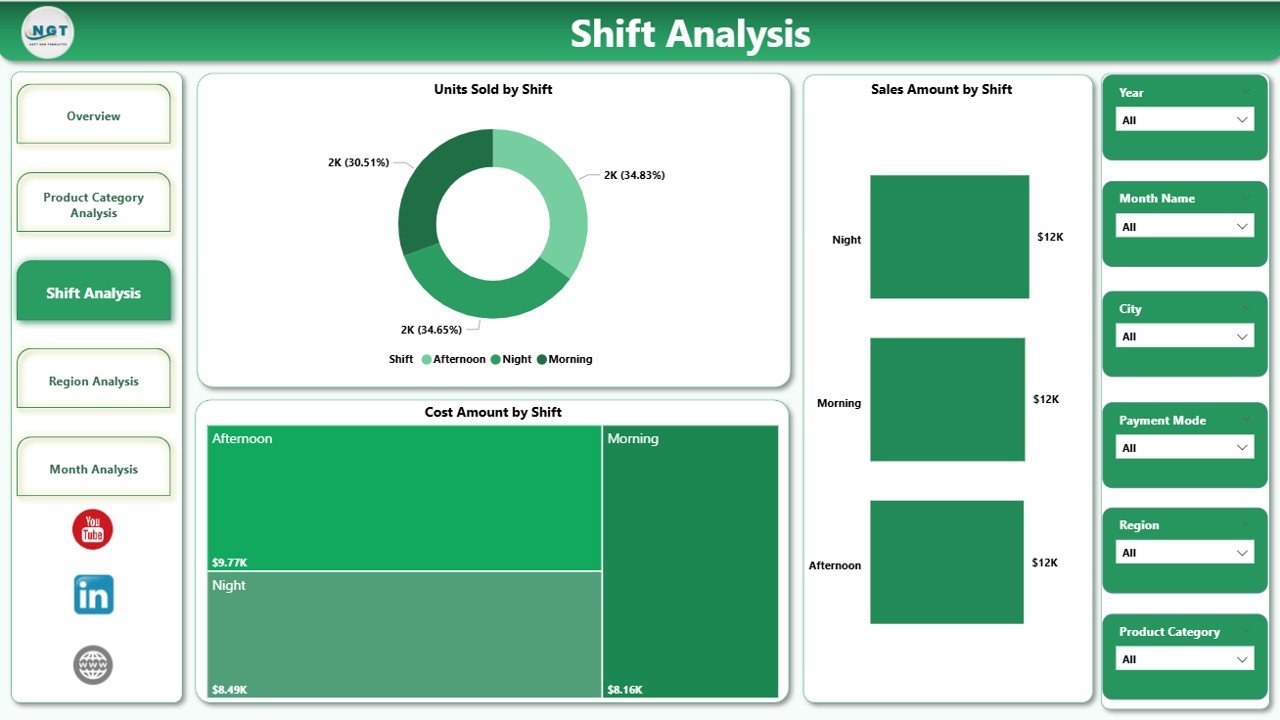
🕒 3️⃣ Shift Analysis – Which Shift Performs Best?
The Shift Analysis Page breaks down performance by operating shifts.
Key Visuals
-
Units Sold by Shift
-
Sales Amount by Shift
-
Cost Amount by Shift
With this page, you can:
-
Optimize staffing levels
-
Reduce shift-level cost inefficiencies
-
Improve inventory planning by demand pattern
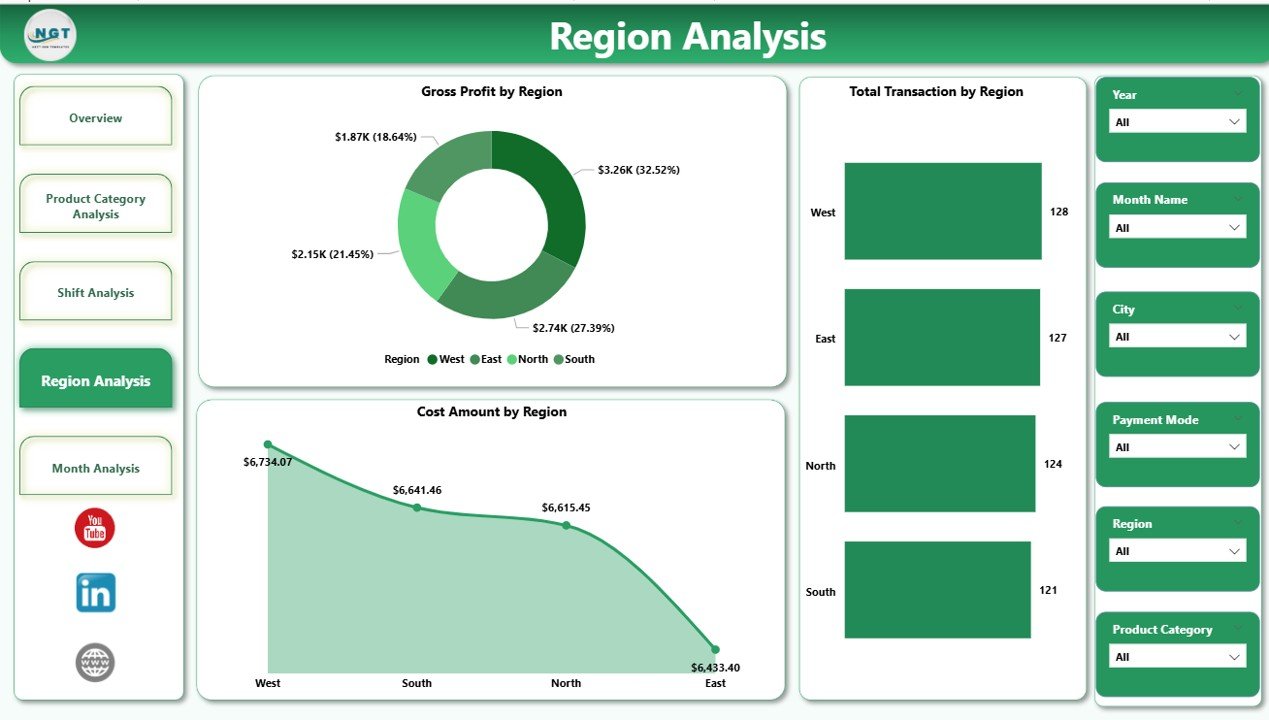
🌍 4️⃣ Region Analysis – Which Locations Perform Better?
The Region Analysis Page provides geographic performance insights.
Key Visuals
-
Total Transactions by Region
-
Gross Profit by Region
-
Cost Amount by Region
This page supports:
-
Regional performance comparison
-
Resource allocation decisions
-
Identification of high-growth or high-cost regions
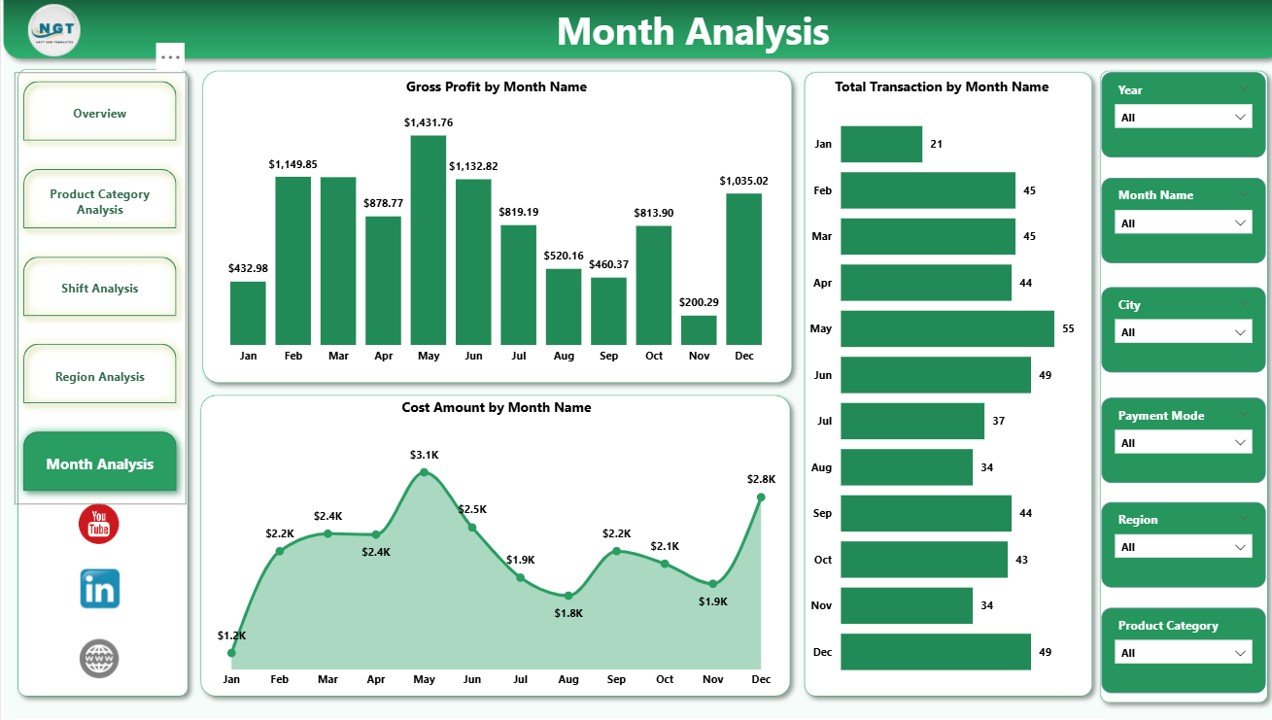
📆 5️⃣ Month Analysis – How Does Performance Change Over Time?
The Month Analysis Page focuses on time-based trends.
Key Visuals
-
Total Transactions by Month
-
Gross Profit by Month
-
Cost Amount by Month
This page helps you:
-
Identify seasonality
-
Track growth or decline
-
Improve forecasting and budgeting accuracy
🛠️ How the Convenience Stores Dashboard in Power BI Works
1️⃣ Load transaction-level data from Excel, CSV, or database
2️⃣ Power BI models and aggregates the data
3️⃣ KPIs such as sales, cost, profit, and transactions calculate automatically
4️⃣ Interactive visuals and slicers update instantly
5️⃣ Users analyze performance without touching raw data
No manual reporting. No static spreadsheets.
👥 Who Should Use This Dashboard?
🏪 Convenience Store Owners
📊 Operations Managers
🌍 Regional & Area Managers
💰 Finance & MIS Teams
📈 Business Analysts
🛒 Retail Consultants
Whether you run a single store or a multi-location retail chain, this dashboard adapts to your needs.
👉 Click here to read the detailed blog post
🎥 Visit our YouTube channel for step-by-step tutorials
👉Visit our YouTube channel to learn step-by-step video tutorials


Reviews
There are no reviews yet.