Running a convenience store means fast decisions, tight margins, and constant monitoring. However, many store owners and retail managers still rely on scattered Excel files, daily registers, and manual MIS reports. As a result, tracking sales trends, understanding customer behavior, and controlling costs becomes slow and stressful.
That is exactly where the Convenience Stores Dashboard in Excel creates real impact.
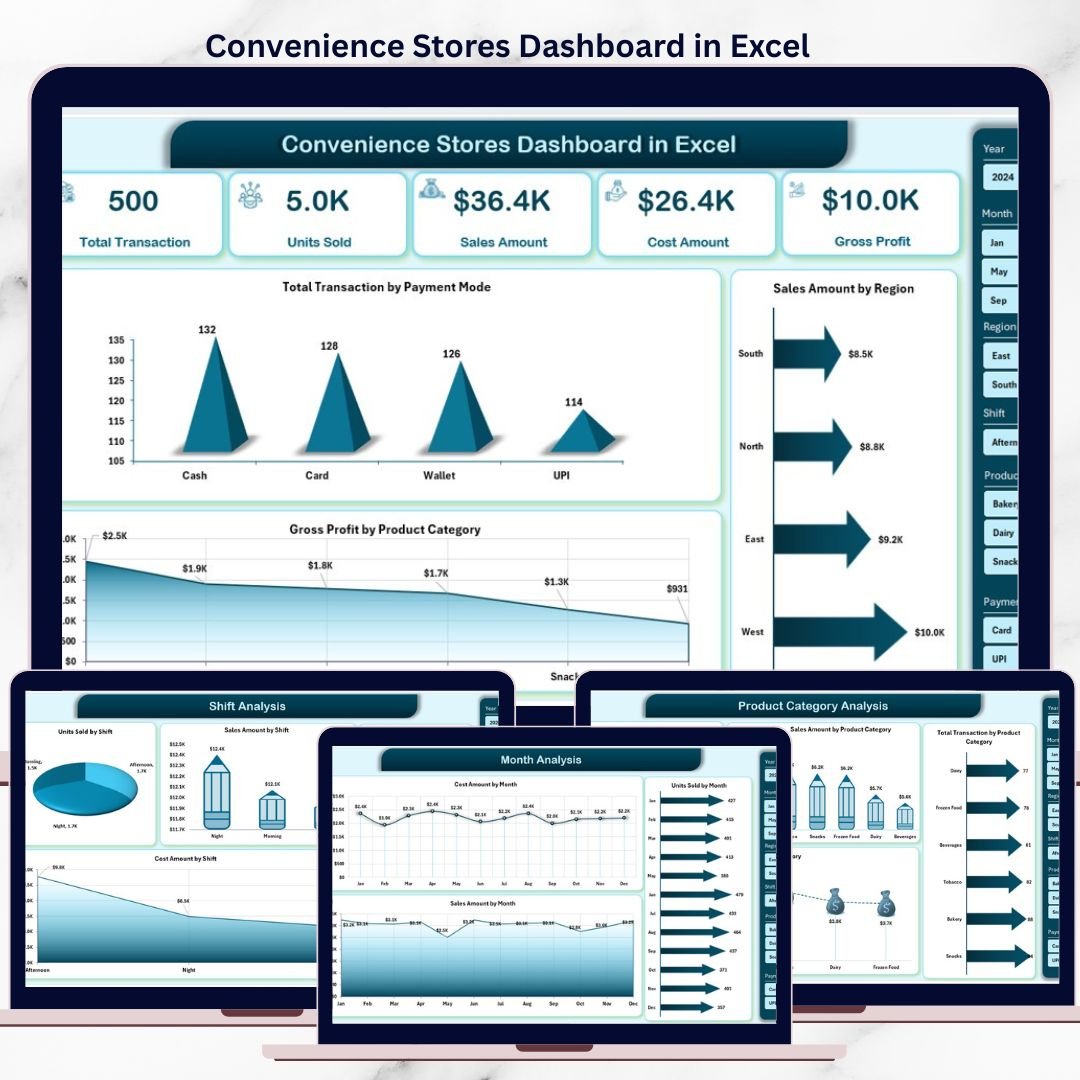
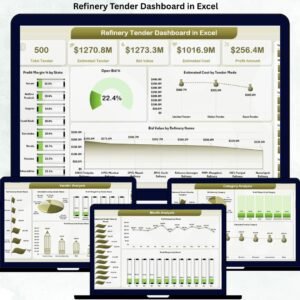
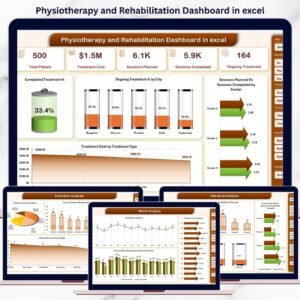
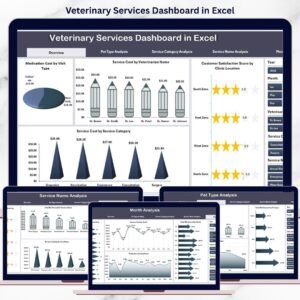
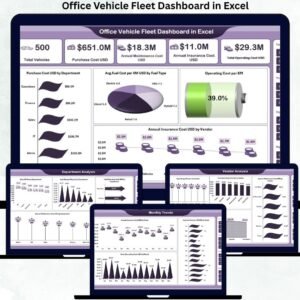
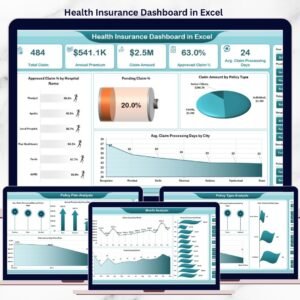
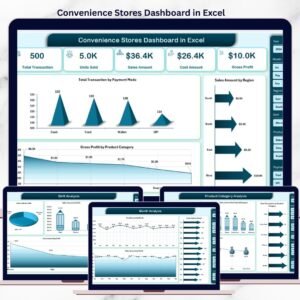
This ready-to-use Excel dashboard transforms raw store transaction data into clear, visual, and actionable insights. It helps you monitor sales, units sold, transactions, cost, and gross profit across products, regions, shifts, and months—all from one interactive dashboard.
Instead of spending hours preparing reports, you can focus on growing revenue, improving margins, and making smarter retail decisions.
🚀 Key Features of Convenience Stores Dashboard in Excel
📊 Centralized Store Performance View
Track all key convenience store metrics in one professional Excel dashboard.
💰 Sales, Cost & Profit Tracking
Monitor Units Sold, Sales Amount, Cost Amount, Transactions, and Gross Profit.
🧭 Page Navigator for Easy Navigation
Quickly move between dashboard pages using the left-side page navigator.
🎛️ Dynamic Slicers for Smart Filtering
Analyze data by Product Category, Region, Shift, and Month instantly.
📈 Multiple Analytical Pages
Understand performance from product, shift, regional, and time-based views.
⚡ Automatic Dashboard Refresh
Update the Data Sheet once and refresh all charts and KPIs automatically.
💻 100% Excel-Native & Cost-Effective
No Power BI or external tools required—works with standard Excel.
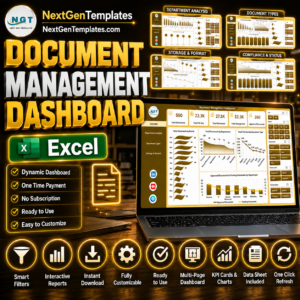
📦 What’s Inside the Convenience Stores Dashboard in Excel
This dashboard includes 5 powerful analytical pages, each designed to answer specific business questions.
🧩 1️⃣ Overview Page – Overall Store Health
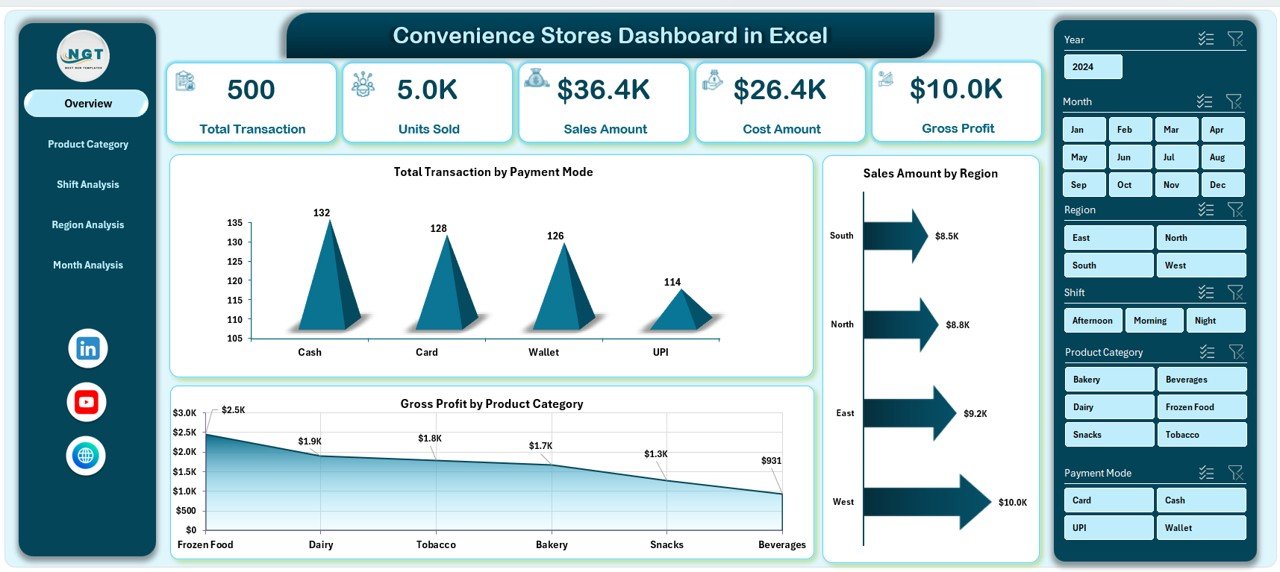
A quick snapshot of total store performance.
✔ KPI cards for key metrics
✔ Charts showing transactions, sales, and profit
✔ High-level visibility for quick daily reviews
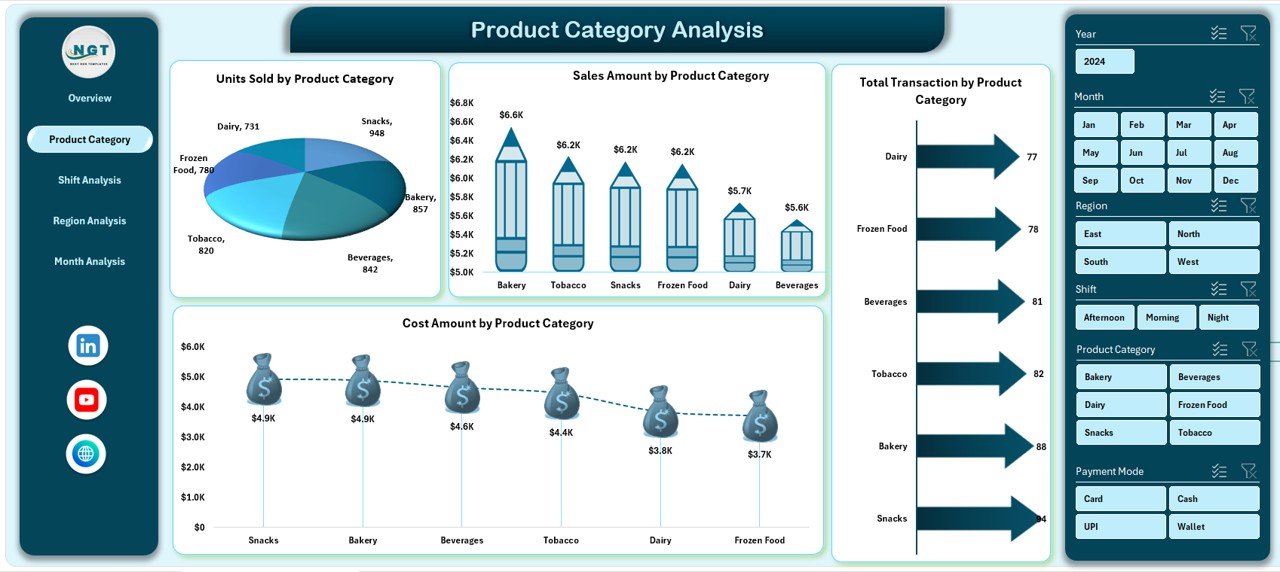
🛒 2️⃣ Product Category Analysis Page
Understand which products drive volume, revenue, and profit.
✔ Units Sold by Product Category
✔ Sales Amount by Product Category
✔ Transactions by Product Category
✔ Cost Amount by Product Category
Perfect for inventory planning and product optimization.
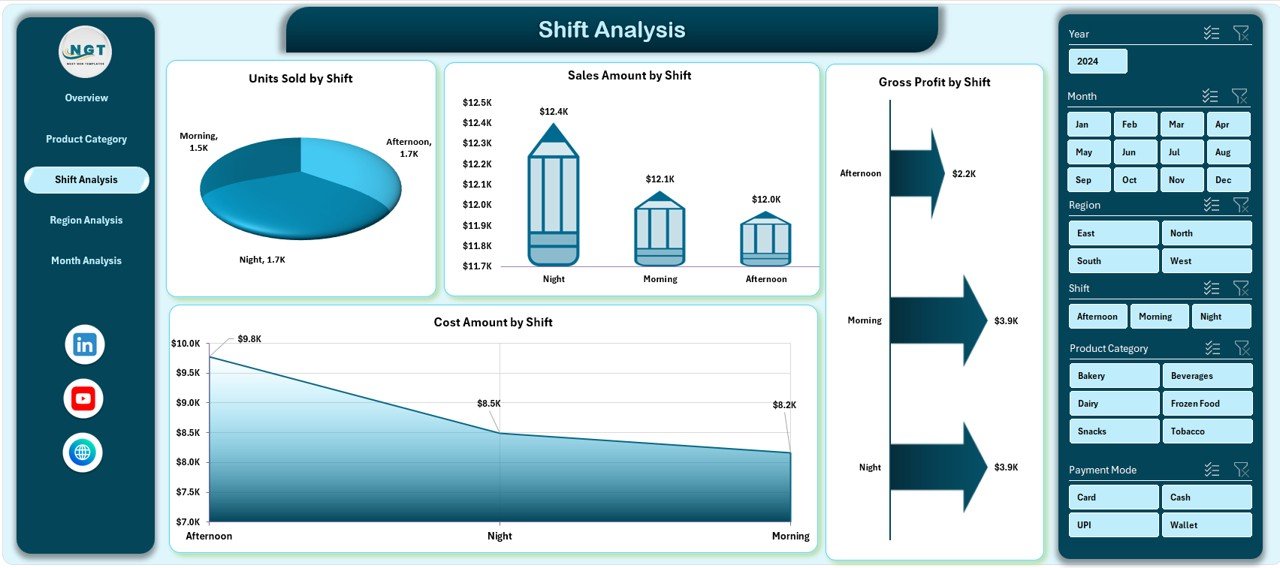
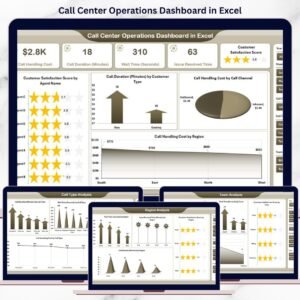
⏰ 3️⃣ Shift Analysis Page
Analyze performance across morning, evening, and night shifts.
✔ Units Sold by Shift
✔ Sales Amount by Shift
✔ Gross Profit by Shift
✔ Cost Amount by Shift
Helps improve staffing efficiency and shift-wise profitability.
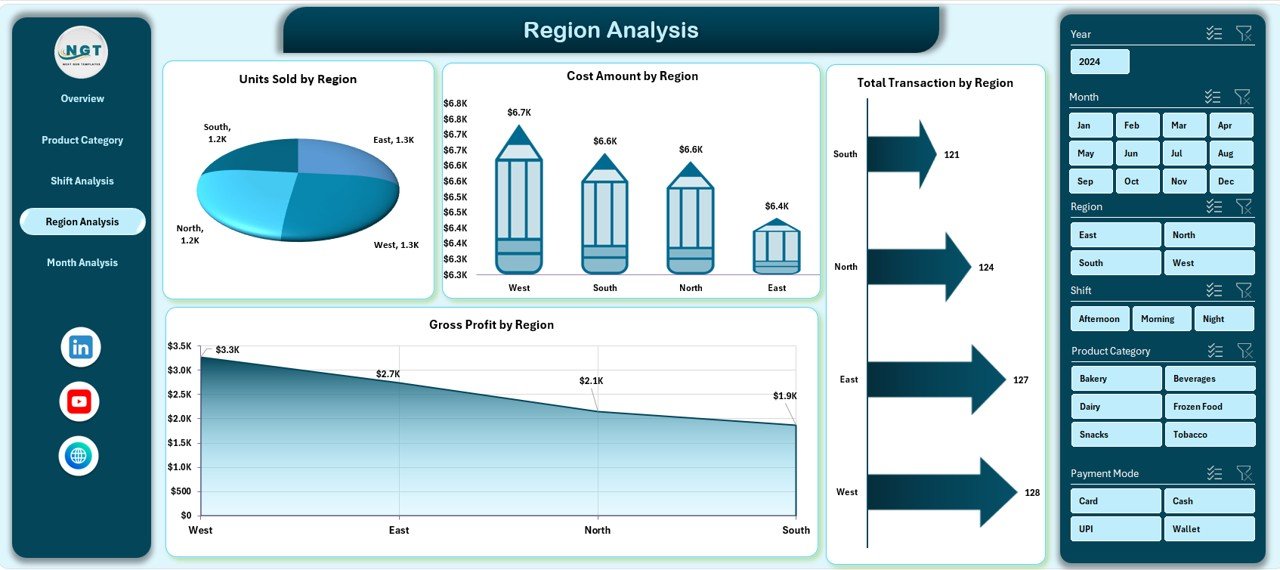
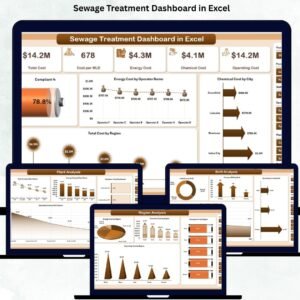
🌍 4️⃣ Region Analysis Page
Compare performance across different store regions.
✔ Units Sold by Region
✔ Transactions by Region
✔ Gross Profit by Region
✔ Cost Amount by Region
Ideal for resource allocation and regional strategy.
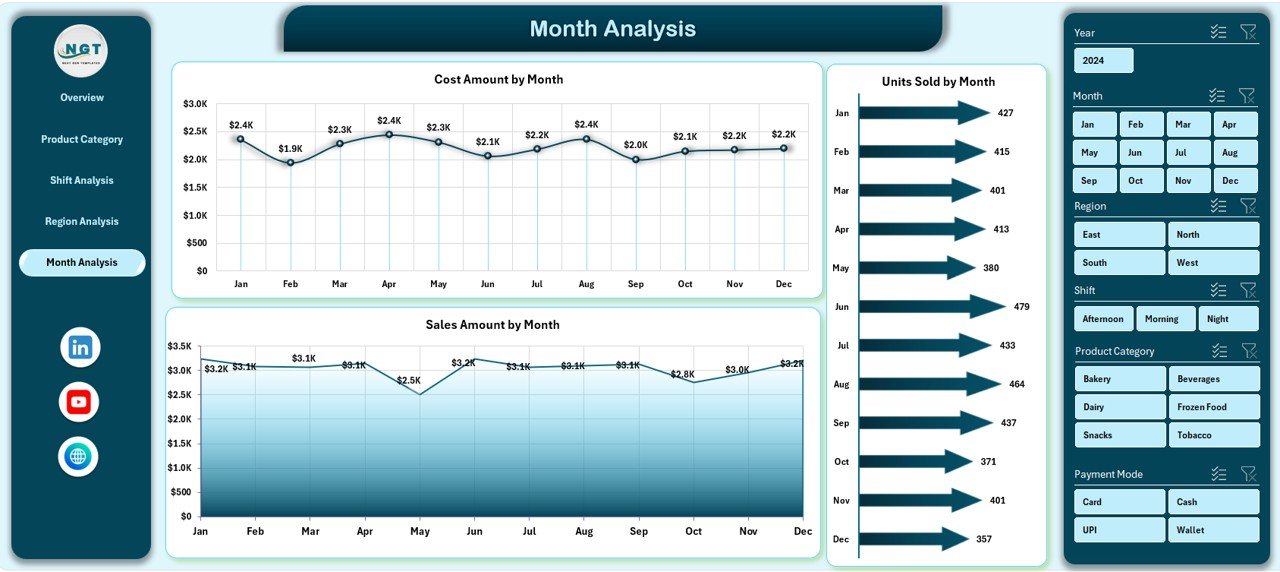
📆 5️⃣ Month Analysis Page
Track trends and seasonality over time.
✔ Units Sold by Month
✔ Gross Profit by Month
✔ Cost Amount by Month
Supports forecasting, promotions, and budget planning.
🗂️ Supporting Sheets Included
📌 Data Sheet – Stores all raw transaction data
⚙️ Support Sheet – Handles calculations and lookup logic
Simply update the Data Sheet, and the dashboard updates automatically.
🛠️ How to Use the Convenience Stores Dashboard in Excel
1️⃣ Enter or paste your sales and transaction data into the Data Sheet
2️⃣ Refresh pivot tables (if required)
3️⃣ Use slicers to filter by product, region, shift, or month
4️⃣ Review KPIs and charts on each analysis page
5️⃣ Take faster, data-driven decisions
No advanced Excel skills required.
👥 Who Can Benefit from This Convenience Stores Dashboard
🏪 Convenience Store Owners
🏬 Retail Chain Managers
📊 Store Supervisors
⚙️ Operations Managers
💼 Finance & MIS Teams
📈 Business Analysts
If you manage store sales or retail performance, this dashboard is built for you.
### 👉 Click here to read the detailed blog post
🎥 Visit our YouTube channel to learn step-by-step video tutorials
👉 Youtube.com/@PKAnExcelExpert


Reviews
There are no reviews yet.