Running a successful food service operation requires speed, accuracy, cost control, and consistent customer satisfaction. However, many restaurants, cafeterias, catering services, and food chains still depend on manual registers or basic spreadsheets. As a result, performance issues remain hidden, and corrective actions arrive too late.
That is exactly where the Food Service KPI Scorecard in Google Sheets creates real impact.
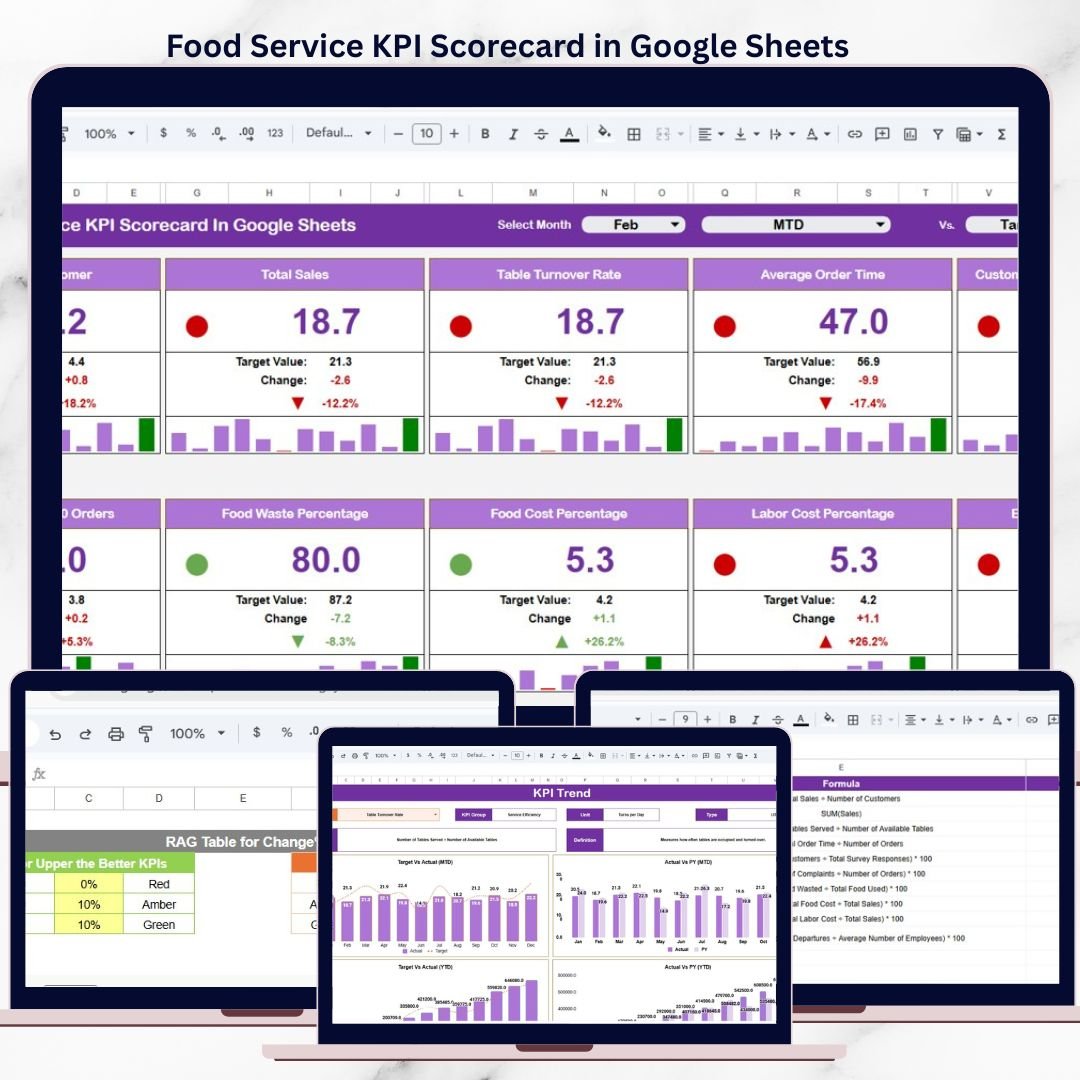
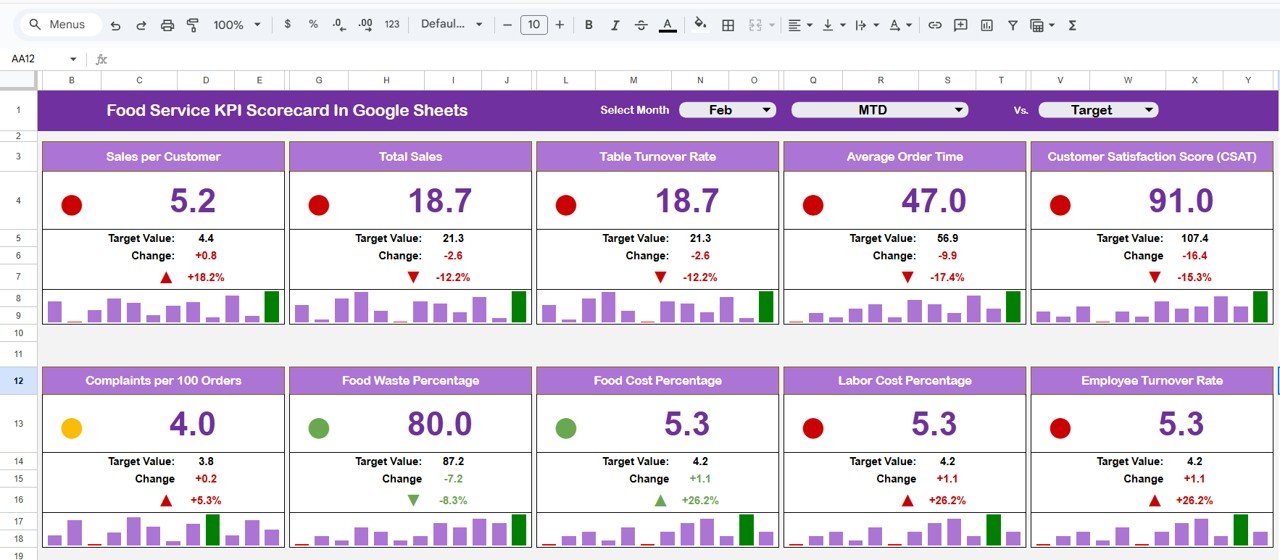
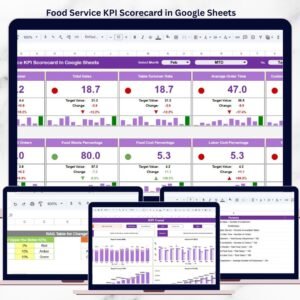
This ready-to-use KPI scorecard helps food service teams track, analyze, and improve performance using clear visuals, traffic lights, and trend indicators. Instead of chasing reports, managers gain instant visibility into sales, costs, efficiency, and service quality—all in one interactive Google Sheets file.
Because it is cloud-based, teams collaborate in real time and always work with the latest data.
⭐ Key Features of Food Service KPI Scorecard in Google Sheets
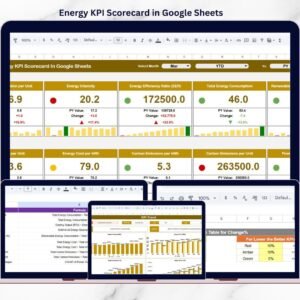
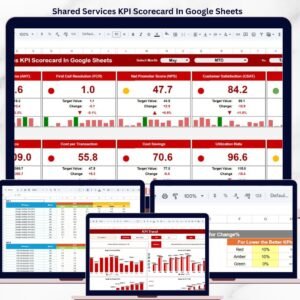
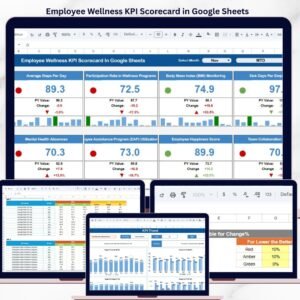
📊 Visual KPI Scorecard Dashboard
Track food service KPIs using traffic lights, arrows, and clear comparisons.
📅 MTD & YTD View Toggle
Switch easily between monthly and yearly performance views.
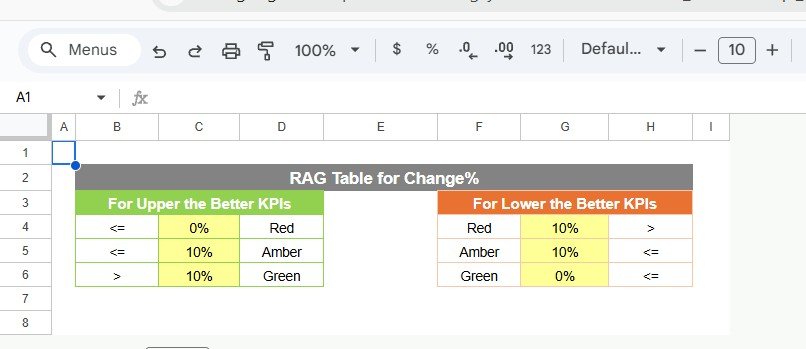
🚦 Traffic Light Indicators (RAG)
Instantly identify underperforming, average, and high-performing KPIs.
📈 Trend & Percentage Change Arrows
Understand performance movement at a glance.
🎯 Actual vs Target Comparison
Clearly see how performance compares against defined targets.
📘 Standardized KPI Definitions
Every KPI includes unit, formula, and performance direction.
🧩 Fully Customizable Structure
Add or modify KPIs without breaking formulas.
☁️ Built in Google Sheets
Real-time updates, cloud access, and easy sharing.
📦 What’s Inside the Food Service KPI Scorecard in Google Sheets?
This scorecard includes multiple well-structured worksheets, designed for clarity and control:
📌 Main Scorecard Sheet
Displays monthly KPIs with traffic lights, arrows, and MTD/YTD toggle.
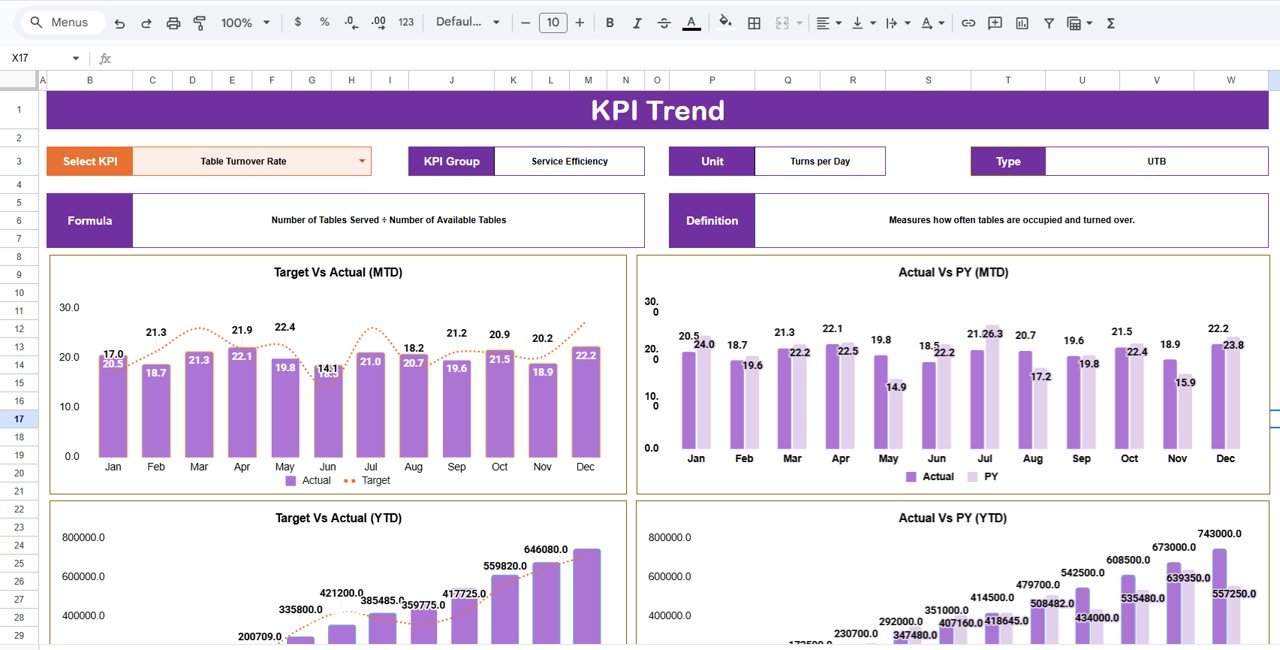
📌 Trend Sheet Tab
Shows KPI trends along with KPI group, unit, formula, and definition.
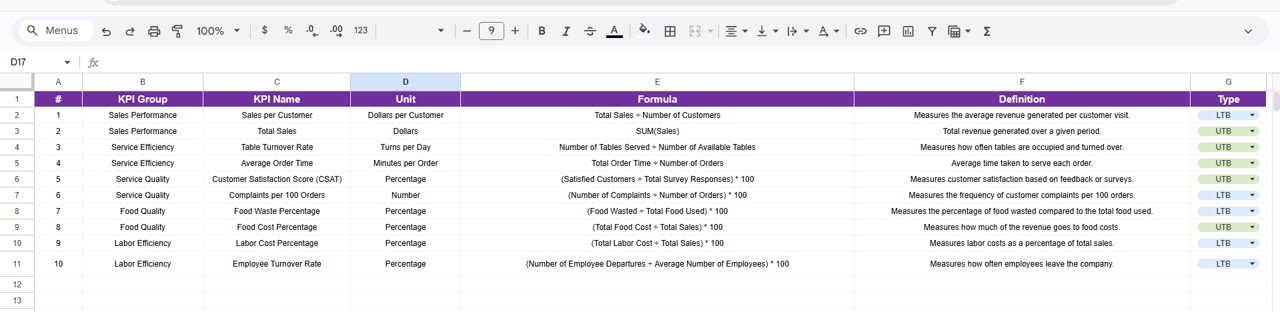
📌 KPI Definition Sheet Tab
Central place for KPI name, group, unit, formula, and KPI type (LTB/UTB).
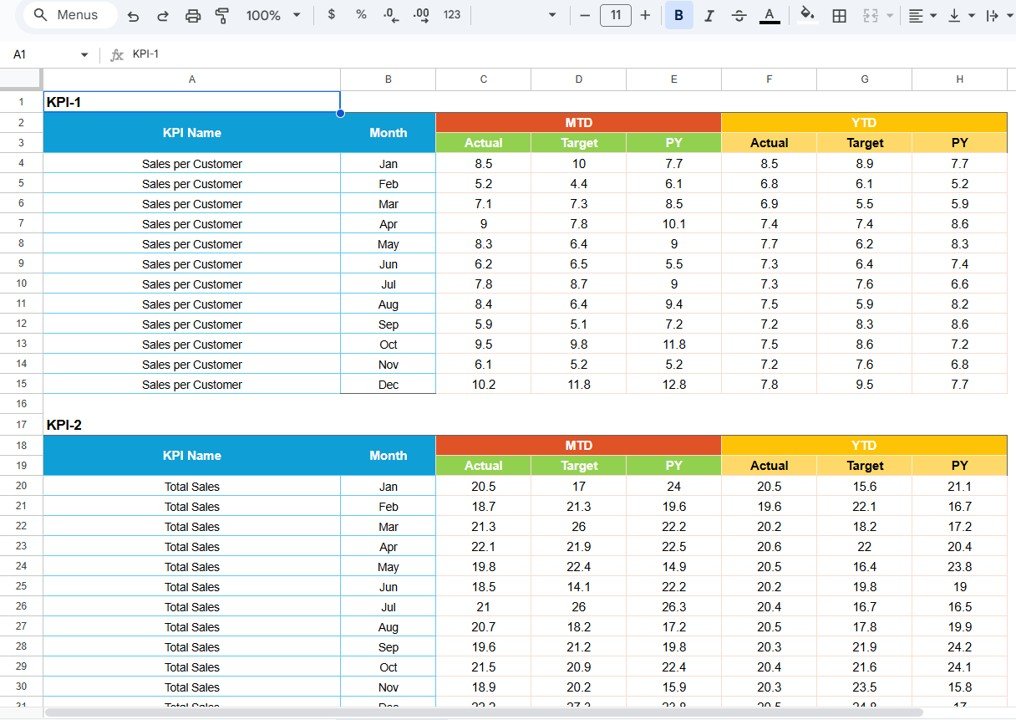
📌 Data Input Sheet Tab
Simple and structured data entry for monthly and yearly values.
📌 Colour Settings Section
Controls traffic light thresholds and arrow color logic.
Together, these sheets form a complete KPI performance monitoring system for food service businesses.
🛠️ How to Use the Food Service KPI Scorecard in Google Sheets
Using this scorecard is quick and straightforward:
1️⃣ Define or review KPIs in the KPI Definition sheet
2️⃣ Enter monthly or yearly values in the Data Input sheet
3️⃣ Select the required month on the Scorecard
4️⃣ Switch between MTD and YTD views
5️⃣ Review traffic lights, arrows, and trends
6️⃣ Take corrective action where needed
All calculations and visuals update automatically, so users focus on insights—not formulas.
👥 Who Can Benefit from This Food Service KPI Scorecard?
This scorecard is ideal for:
🍴 Restaurant Owners & Managers
🥘 Catering Service Providers
🍔 QSR & Cloud Kitchen Teams
🏫 Cafeterias & Institutional Kitchens
📊 Operations & Finance Teams
If you manage food service performance, this scorecard fits perfectly.
🚀 Why This Scorecard Is a Must-Have for Food Service Teams
✔ Instant performance visibility
✔ Clear monthly and yearly comparison
✔ Visual focus on problem KPIs
✔ Reduced manual reporting effort
✔ Improved accountability across teams
✔ No expensive BI tools required
This scorecard turns Google Sheets into a powerful food service performance tool.
🔗 Click here to read the Detailed blog post
Watch the step-by-step video tutorial:
📺 Visit our YouTube channel to learn step-by-step video tutorials and scorecard walkthroughs.


Reviews
There are no reviews yet.