Managing a housing society is no longer limited to collecting maintenance fees or resolving day-to-day complaints. Committees must monitor finances, utilities, services, vendors, compliance, and resident satisfaction — all at the same time. Housing Societies KPI Dashboard in Excel However, when information is scattered across registers, WhatsApp groups, and multiple Excel files, decisions become delayed and unclear.
Housing Societies KPI Dashboard in Excel That is exactly where the Housing Societies KPI Dashboard in Excel becomes a powerful and practical solution.
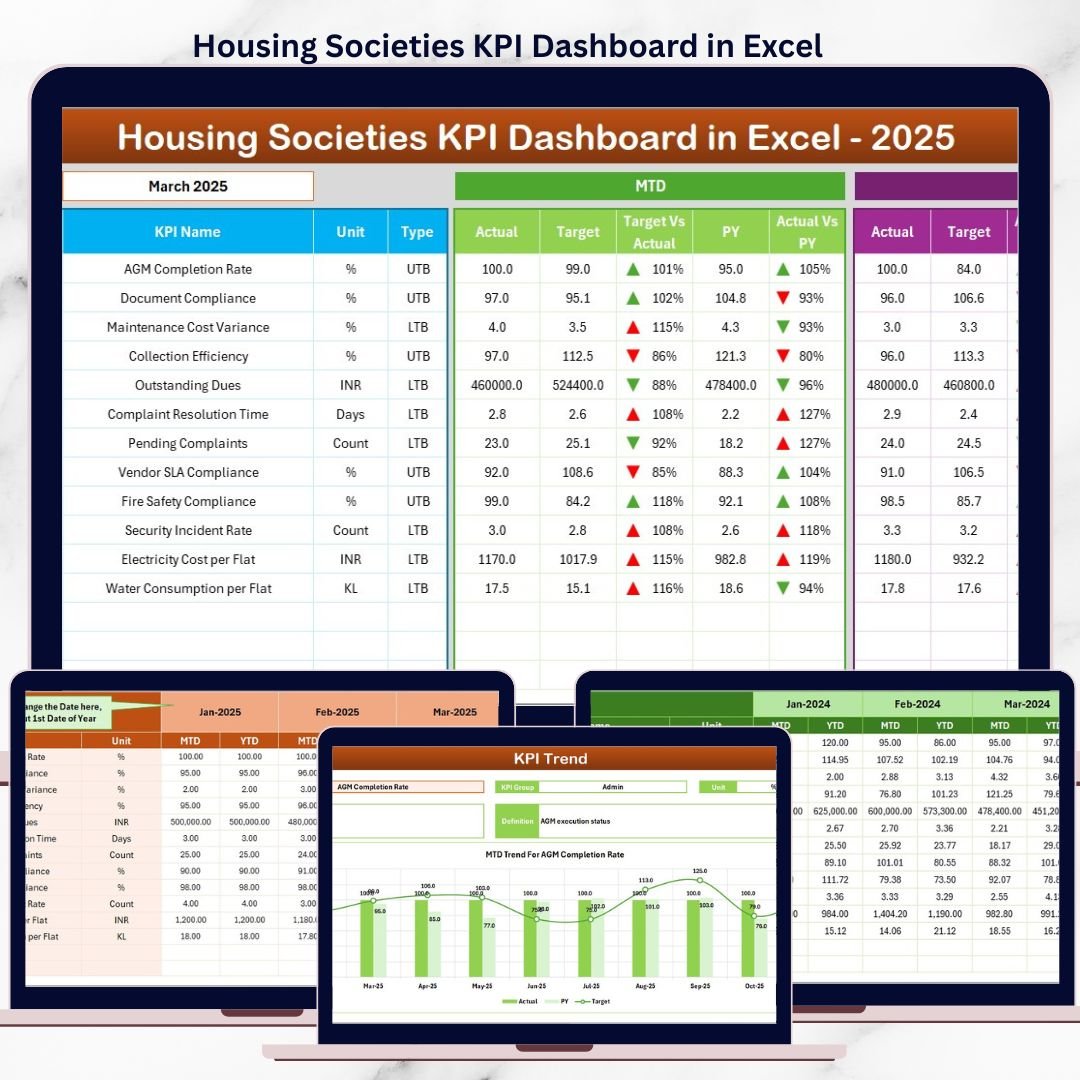
Housing Societies KPI Dashboard in Excel This ready-to-use Excel dashboard helps housing societies track all critical KPIs from a single, centralized file. Instead of relying on assumptions, committees can now make informed decisions using clear visuals, structured data, and performance trends — without investing in expensive software or technical systems.
Designed for simplicity and transparency, this dashboard transforms everyday society data into meaningful insights that improve governance, cost control, and operational efficiency.
✅ Key Features of Housing Societies KPI Dashboard in Excel
-
📊 Centralized KPI Monitoring – Track financial, operational, and service KPIs in one Excel dashboard
-
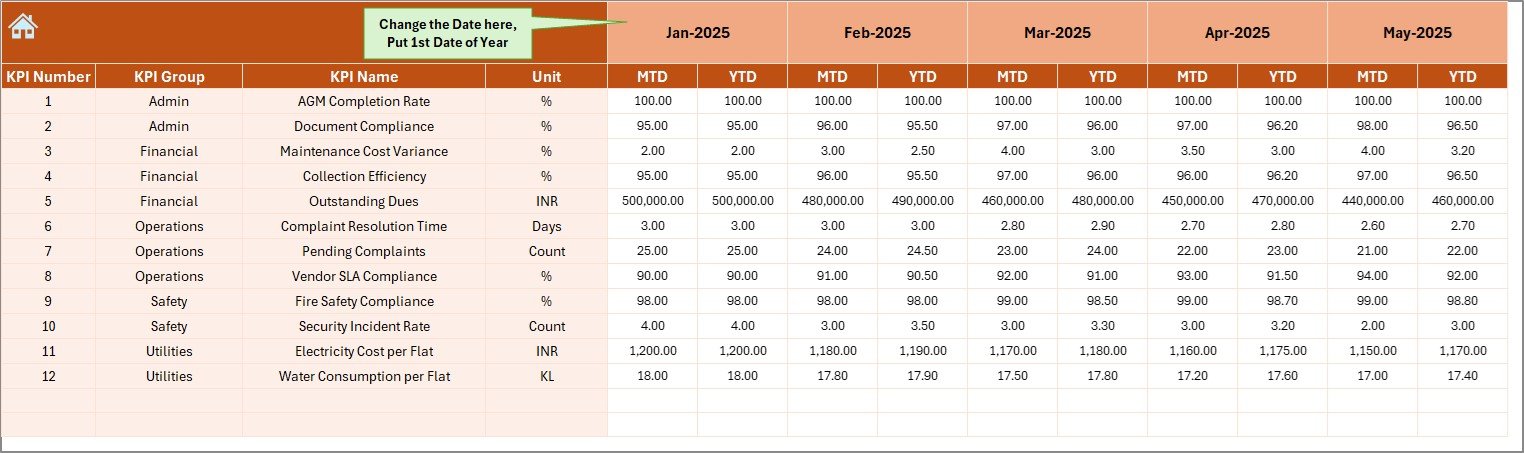
📅 Month Selection Control – Change the month from a dropdown and auto-update the entire dashboard
-
🎯 MTD & YTD Performance Tracking – Monitor short-term and long-term society performance
-
🔄 Actual vs Target & PY Comparison – Instantly identify performance gaps and trends
-
⬆️⬇️ Conditional Formatting with Arrows – Visual indicators show good or poor performance at a glance
-
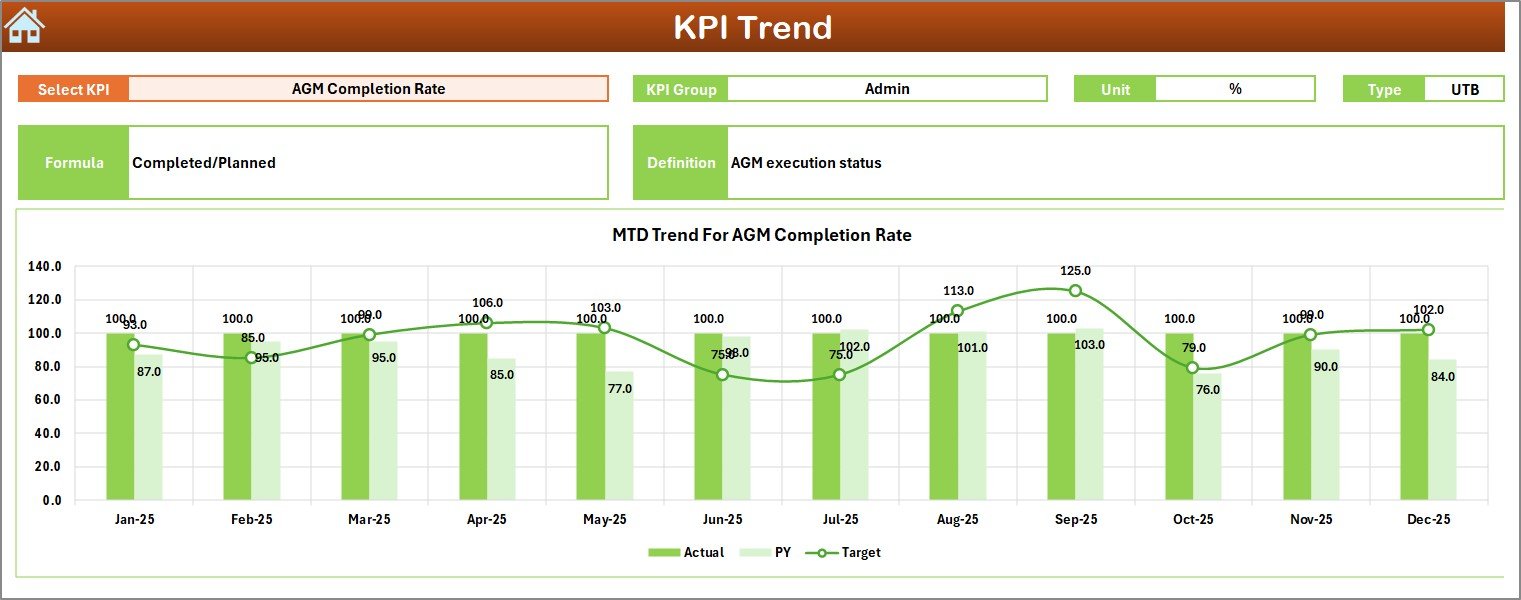
📈 Detailed KPI Trend Analysis – Analyze individual KPIs using dynamic trend charts
-
💼 Professional Governance-Ready Design – Ideal for committee meetings and audits
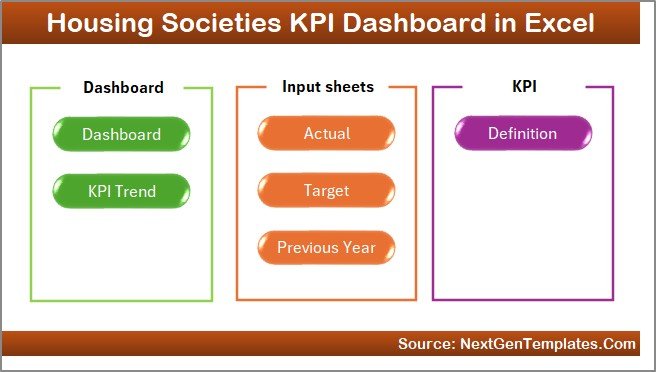
📦 What’s Inside the Housing Societies KPI Dashboard in Excel
This ready-to-use dashboard includes seven structured worksheets; each designed for clarity and ease of use:
-
🏠 Home Sheet
A clean landing page with six navigation buttons for easy movement across the dashboard. -
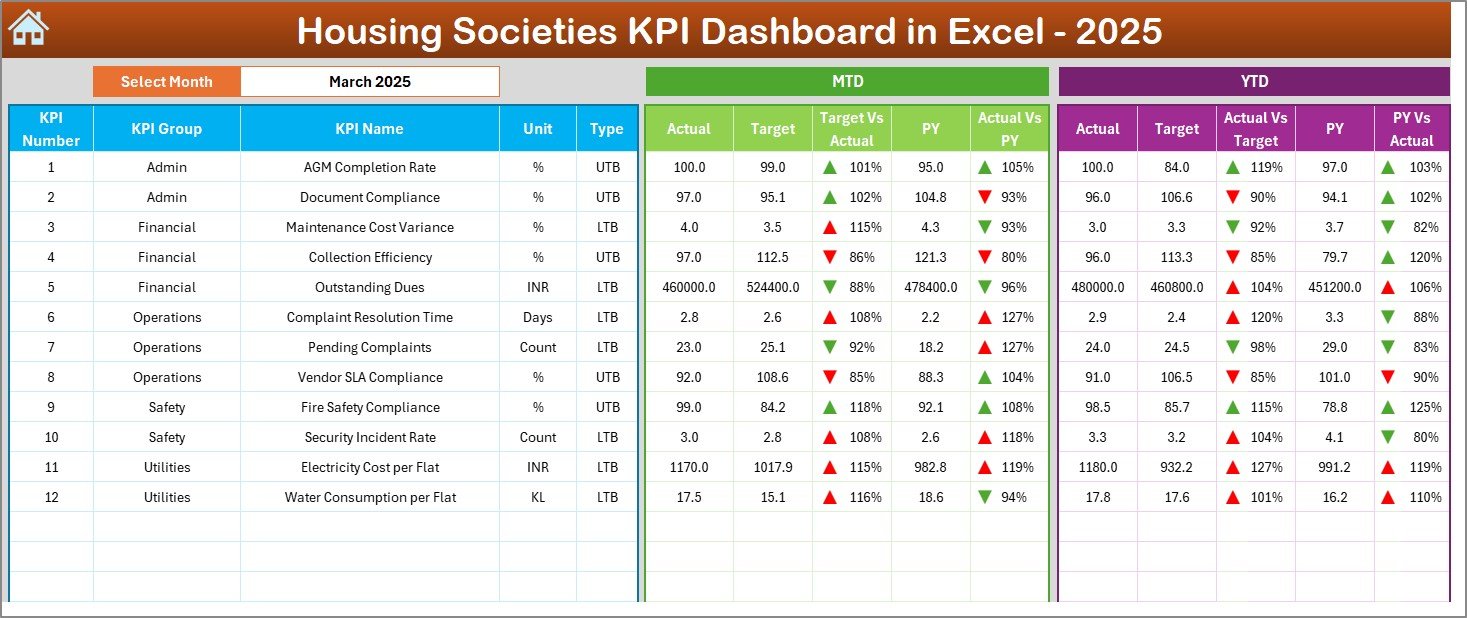
📊 Dashboard Sheet
The main performance view displaying MTD, YTD, targets, previous year data, and variances. -
📈 KPI Trend Sheet
Allows KPI selection from a dropdown and displays MTD & YTD trend charts. -
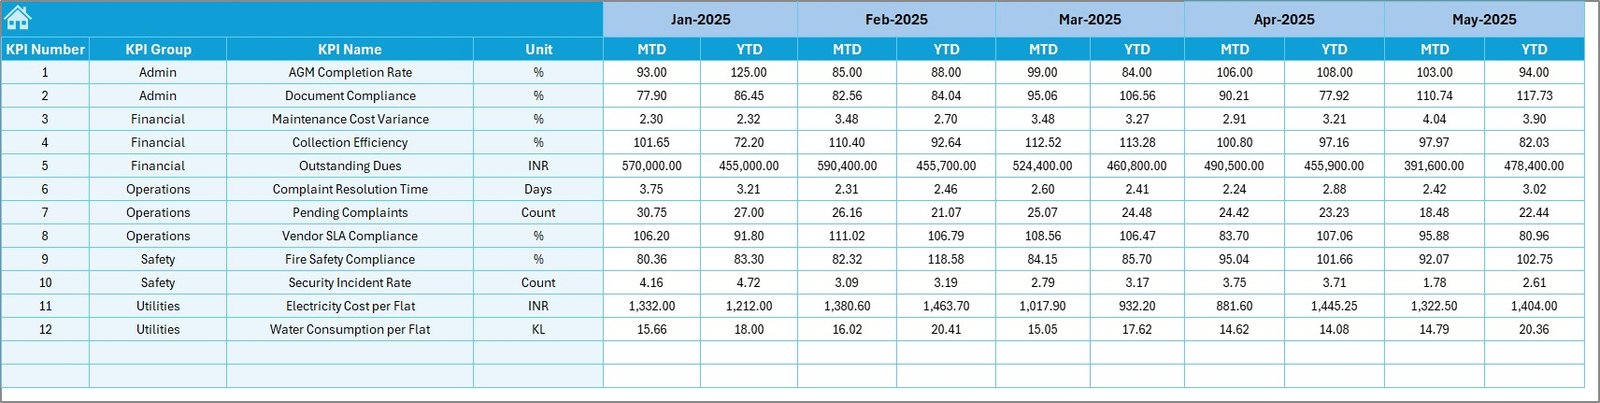
✍️ Actual Numbers Input Sheet
Structured data entry sheet for monthly MTD and YTD actual values. -
🎯 Target Sheet
Define monthly and yearly targets for each KPI. -
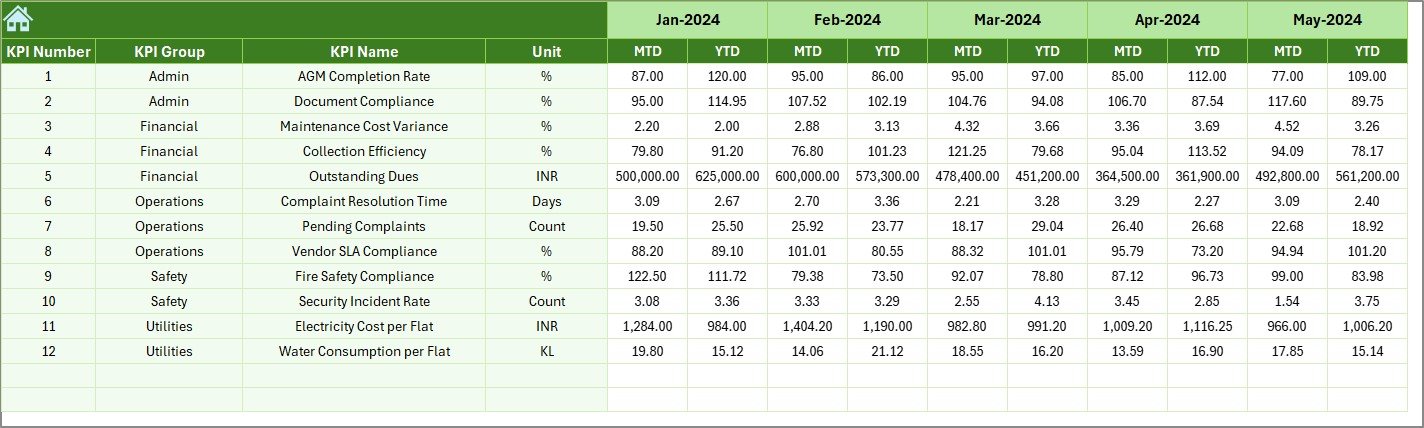
⏮️ Previous Year Numbers Sheet
Supports year-over-year performance comparison. -
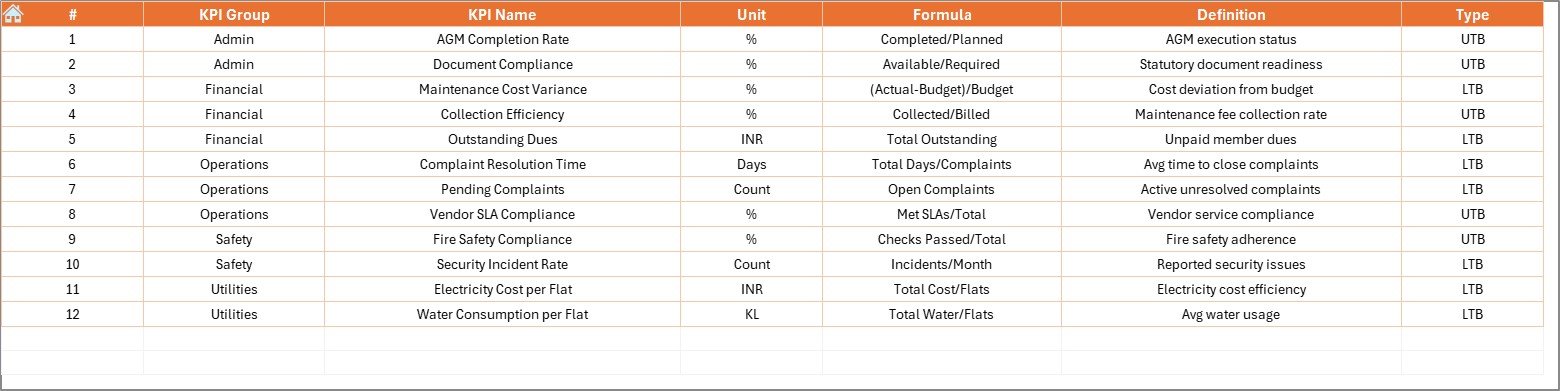
📘 KPI Definition Sheet
Documents KPI group, unit, formula, and definition to ensure consistency.
Together, these sheets ensure transparency, accountability, and professional reporting.
🛠️ How to Use the Housing Societies KPI Dashboard in Excel
Using the dashboard is simple and committee-friendly:
1️⃣ Define KPIs and performance targets
2️⃣ Enter actual numbers monthly
3️⃣ Select the month from the dashboard
4️⃣ Review MTD and YTD performance instantly
5️⃣ Analyze trends and variances
6️⃣ Take corrective actions based on data
No advanced Excel skills are required — basic Excel knowledge is enough to use and maintain the dashboard.
👥 Who Can Benefit from This Housing Societies KPI Dashboard?
This Excel dashboard is ideal for:
-
🧑💼 Housing Society Committees
-
🏢 Apartment Owners Associations
-
🛠️ Society & Facility Managers
-
📋 Auditors and Compliance Consultants
-
🧠 Management Committees & Advisors
Whether managing a small residential society or a large apartment complex, this dashboard adapts easily to your needs.
📖 Click here to read the Detailed blog post
🎥 Visit our YouTube channel to learn step-by-step video tutorials
👉 Youtube.com/@PKAnExcelExpert


Reviews
There are no reviews yet.