Managing a theme park is not just about rides and tickets. Every single day, you must track visitor footfall, ride availability, revenue performance, safety metrics, and customer satisfaction. When this data lives in multiple spreadsheets, decision-making becomes slow and risky. That is exactly where the Theme Parks KPI Dashboard in Excel becomes a game-changer 🚀.
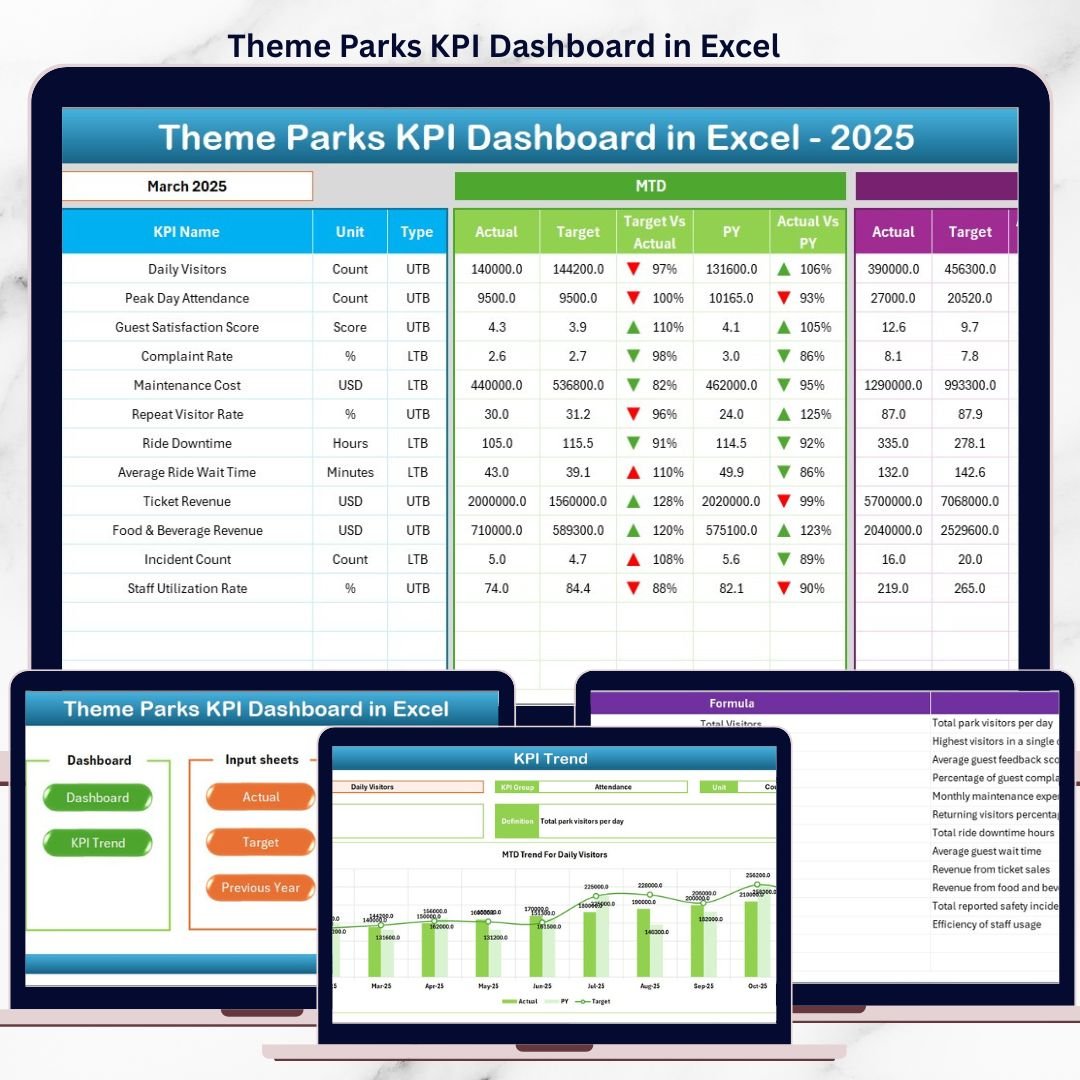
The Theme Parks KPI Dashboard in Excel is a ready-to-use, professionally designed Excel solution that helps you monitor, analyze, and improve theme park performance using clear KPIs and interactive visuals. Instead of spending hours creating reports, you get instant insights in one powerful Excel file.
This dashboard is designed for real business use. It converts raw numbers into meaningful trends, comparisons, and performance indicators that help managers take faster and smarter decisions.
## Key Features of Theme Parks KPI Dashboard in Excel 📊
This dashboard is built with practical operations in mind and delivers powerful features without complexity.
✨ Centralized KPI Monitoring – Track all key theme park KPIs in one Excel file
✨ MTD & YTD Analysis – Monitor Month-to-Date and Year-to-Date performance clearly
✨ Actual vs Target Comparison – Instantly identify gaps using automated variance calculations
✨ Previous Year Comparison – Understand growth or decline with year-over-year analysis
✨ Conditional Formatting – Up and down arrows highlight performance trends visually
✨ Interactive Controls – Month selector and KPI dropdowns for instant updates
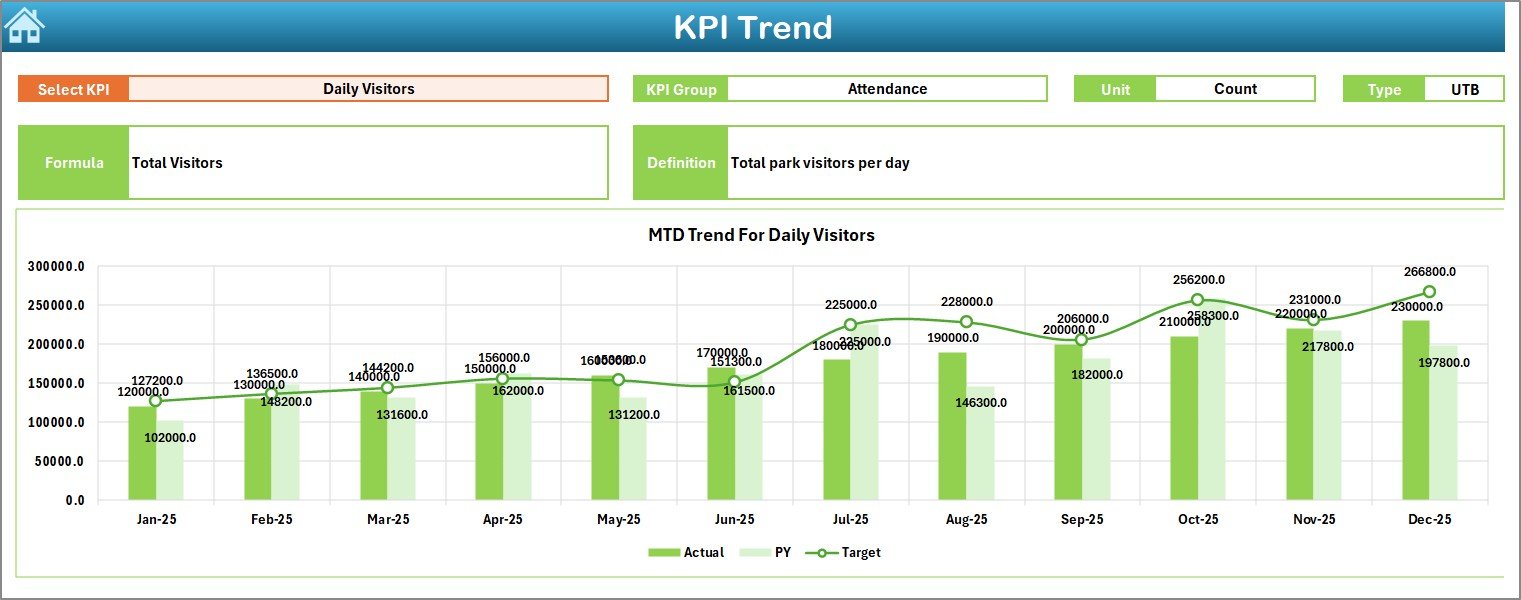
✨ Trend Analysis Charts – Analyze KPI movement using MTD and YTD trend visuals
✨ User-Friendly Design – Easy navigation using buttons and clean layouts
Because everything runs inside Excel, you do not need any external tools or technical expertise.
## What’s Inside the Theme Parks KPI Dashboard in Excel 📁
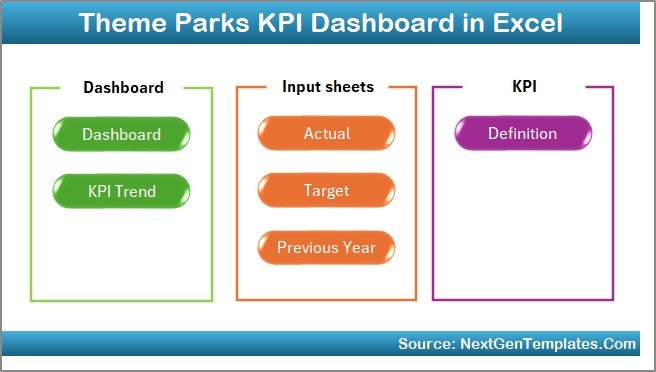
This digital product includes 7 well-structured worksheets, each designed for a specific purpose:
📌 Summary Page (Index Sheet)
Acts as the navigation hub with one-click buttons to access all sheets easily.
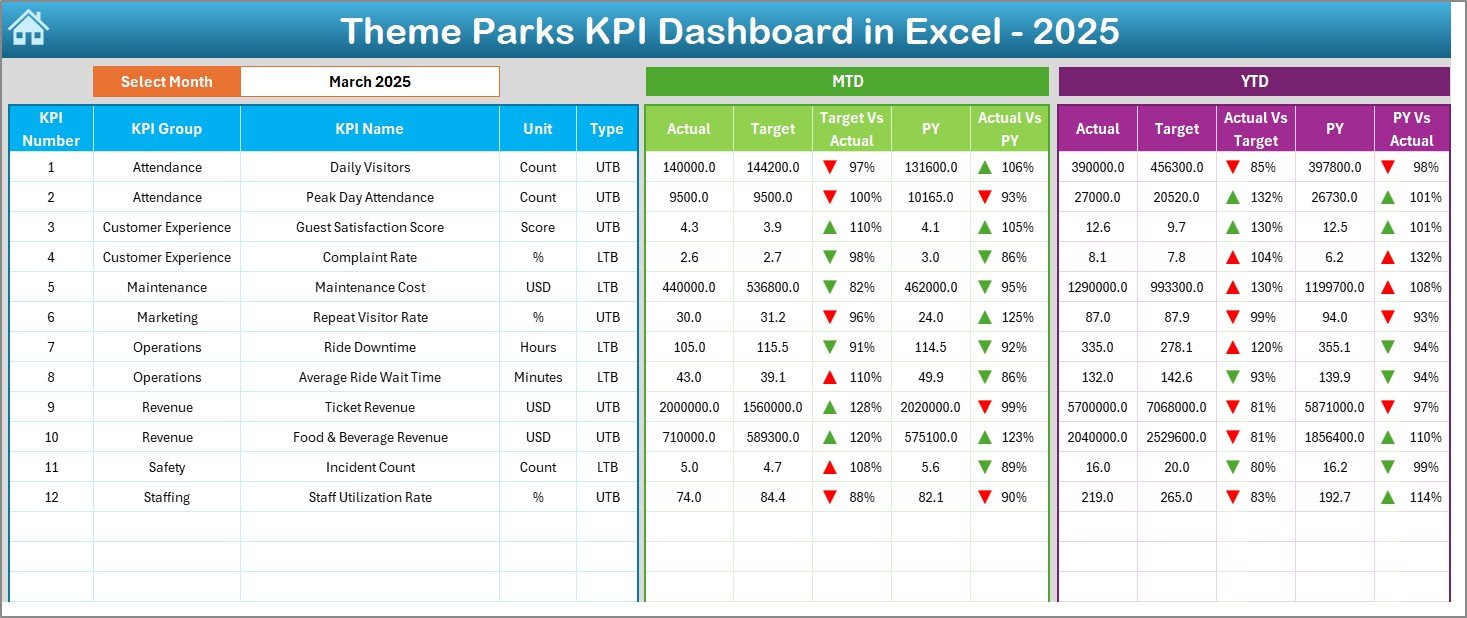
📌 Dashboard Sheet
Shows the complete performance snapshot with MTD and YTD sections, actuals, targets, previous year values, and variances.
📌 Trend Sheet
Allows deep-dive KPI analysis with detailed KPI information and trend charts.
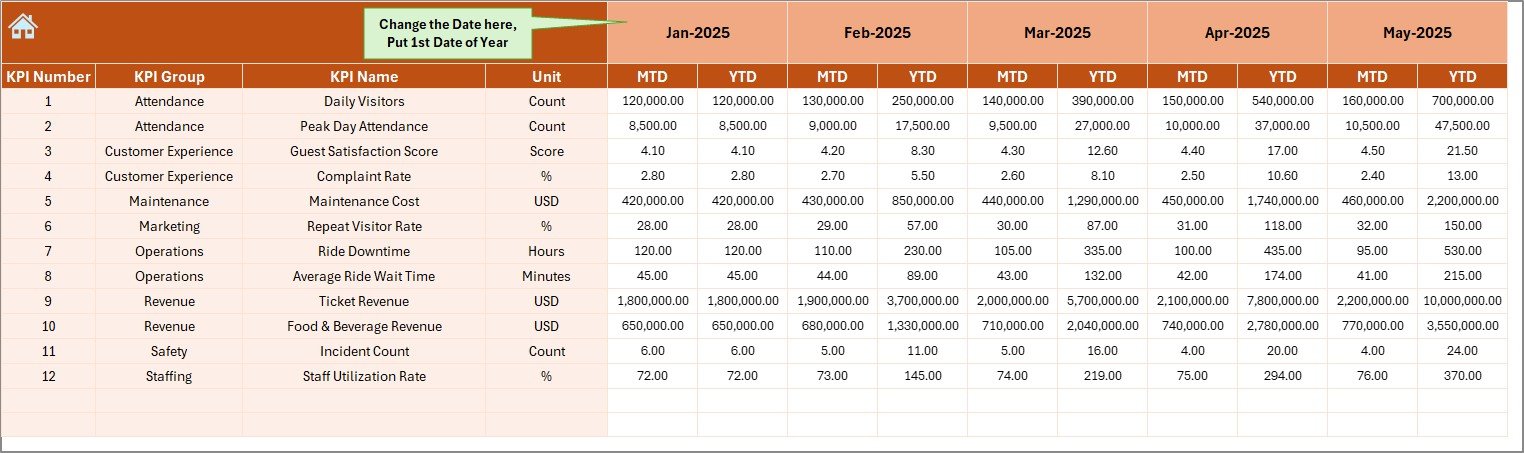
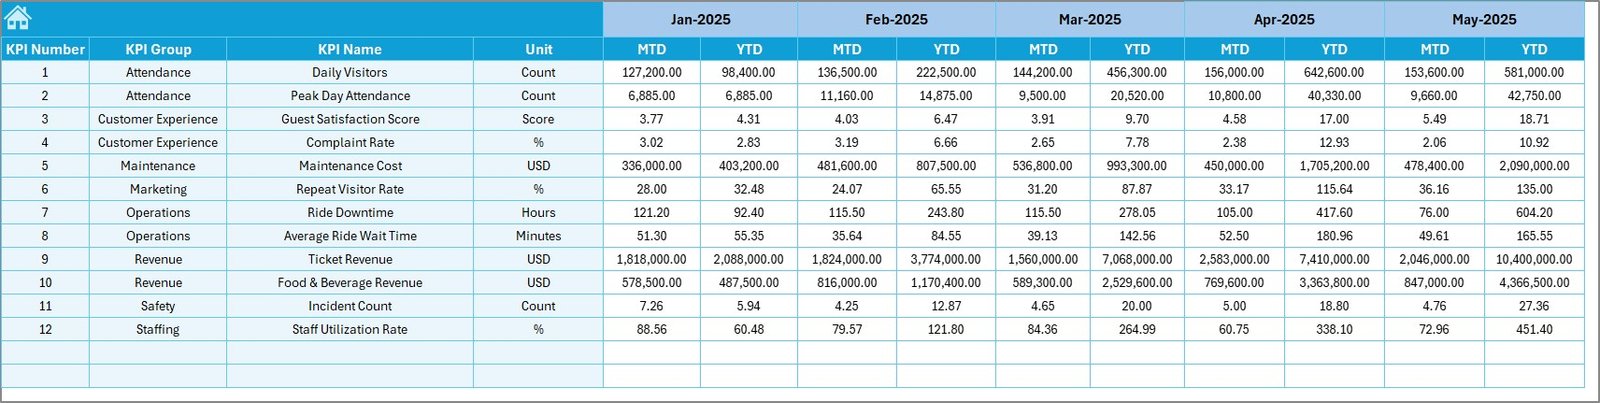
📌 Actual Numbers Input Sheet
Enter real MTD and YTD performance data with flexible month selection.
📌 Target Sheet
Maintain monthly and yearly targets separately for accurate analysis.
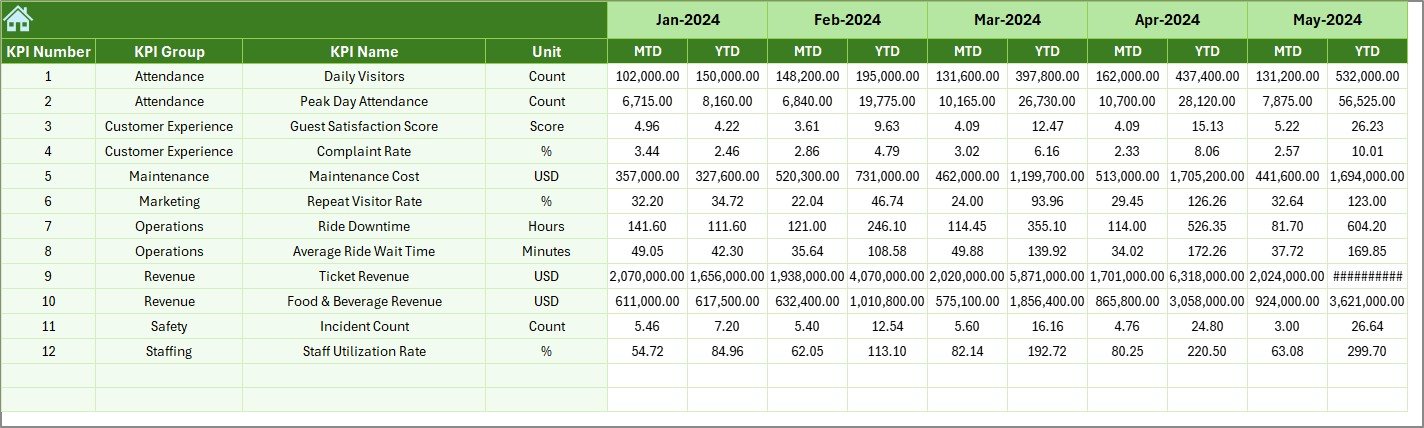
📌 Previous Year Numbers Sheet
Store historical data for year-over-year comparison and growth tracking.
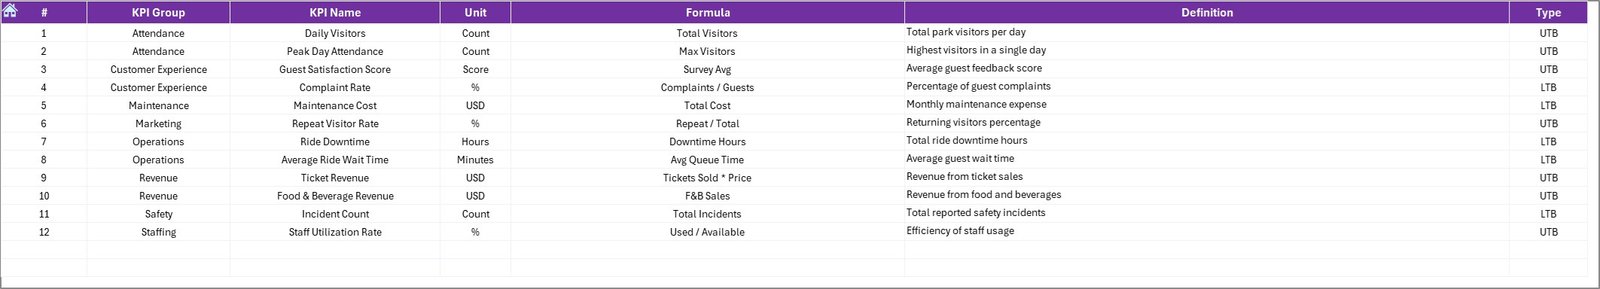
📌 KPI Definition Sheet
Document KPI names, groups, units, formulas, and definitions for clarity and consistency.
This structure ensures clean data flow and accurate reporting at all times.
## How to Use the Theme Parks KPI Dashboard in Excel ⚙️
Using this dashboard is simple and straightforward:
1️⃣ Enter KPI definitions and formulas in the KPI Definition Sheet
2️⃣ Add monthly and yearly targets in the Target Sheet
3️⃣ Input previous year numbers once for comparison
4️⃣ Update actual MTD and YTD values regularly
5️⃣ Select the month or KPI using dropdowns
6️⃣ Review performance instantly on the Dashboard and Trend sheets
The dashboard updates automatically, saving hours of manual reporting work.
## Who Can Benefit from This Theme Parks KPI Dashboard in Excel 🎯
This dashboard is ideal for:
🎢 Theme Park Managers
💼 Operations Managers
📈 Finance & Revenue Teams
🧭 Strategy & Planning Teams
🏢 Park Directors & Senior Leadership
🎠 Amusement Parks & Water Parks
Both technical and non-technical users can use it confidently with basic Excel knowledge.
Click here to read the Detailed blog post
Watch the step-by-step video tutorial:
Visit our YouTube channel to learn step-by-step video tutorials


Reviews
There are no reviews yet.