Managing student exchange programs is no longer just about coordination—it is about measuring performance, meeting targets, and driving international growth with data. However, many universities and education agencies still depend on disconnected Excel files and manual reports. As a result, insights remain hidden, decisions get delayed, and performance gaps go unnoticed.
That is exactly why the Student Exchange Programs KPI Dashboard in Power BI becomes a must-have performance management tool for modern educational institutions.
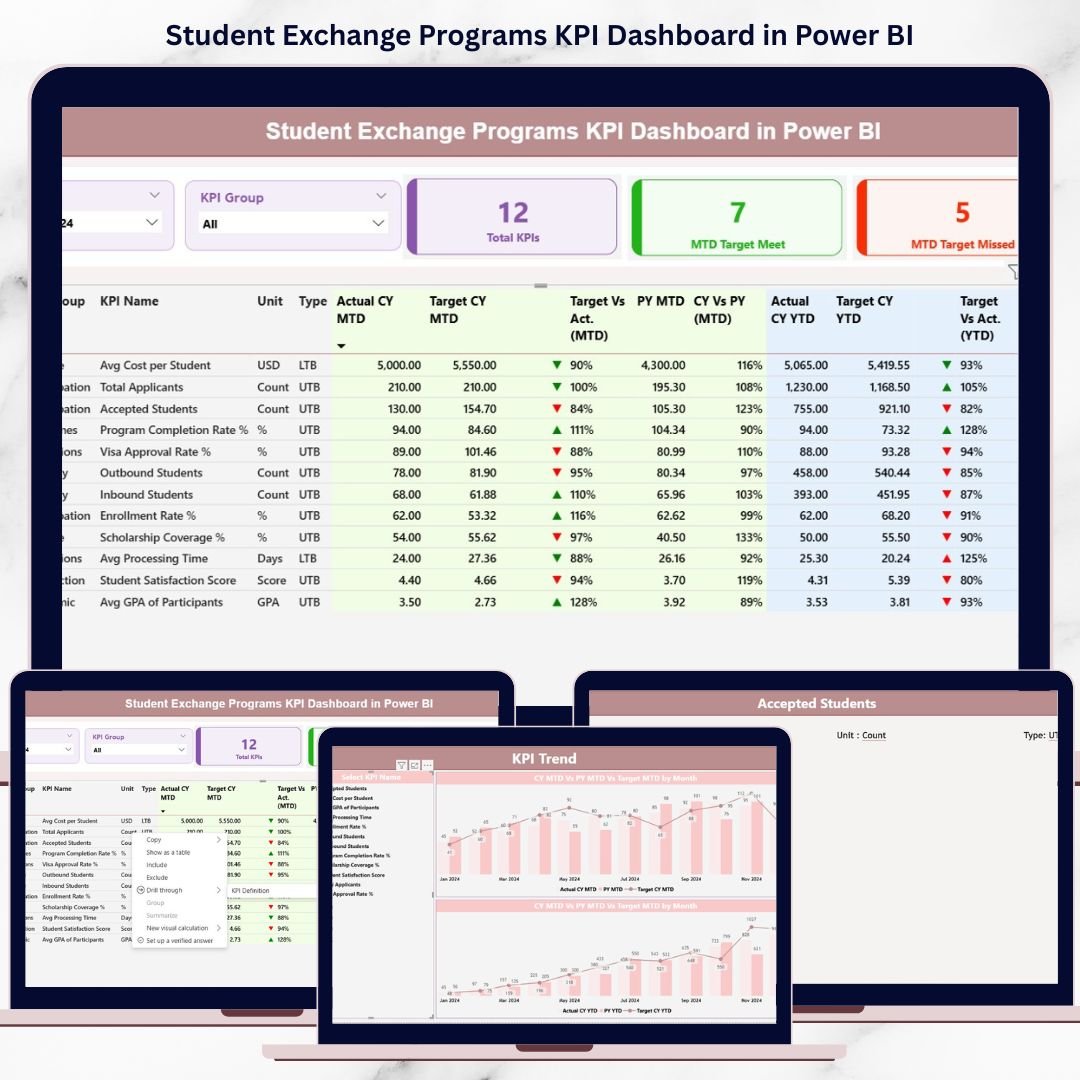
This ready-to-use Power BI dashboard transforms raw student exchange data into clear KPIs, interactive visuals, and actionable insights. Instead of spending hours preparing reports, you gain instant visibility into program success, trends, and target achievement—all in one centralized dashboard.
Designed for accuracy, clarity, and scalability, this dashboard helps institutions move from guesswork to confident, data-driven decision-making.
🔹 Key Features of Student Exchange Programs KPI Dashboard in Power BI
📊 Interactive Summary Dashboard – Monitor all exchange program KPIs from a single high-level view.
🎯 MTD & YTD Performance Tracking – Track Month-to-Date and Year-to-Date actuals against targets and previous year values.
📈 Automated KPI Calculations – All ratios, comparisons, and performance indicators calculate automatically.
🧭 KPI Group & Month Slicers – Instantly filter insights by month and KPI category.
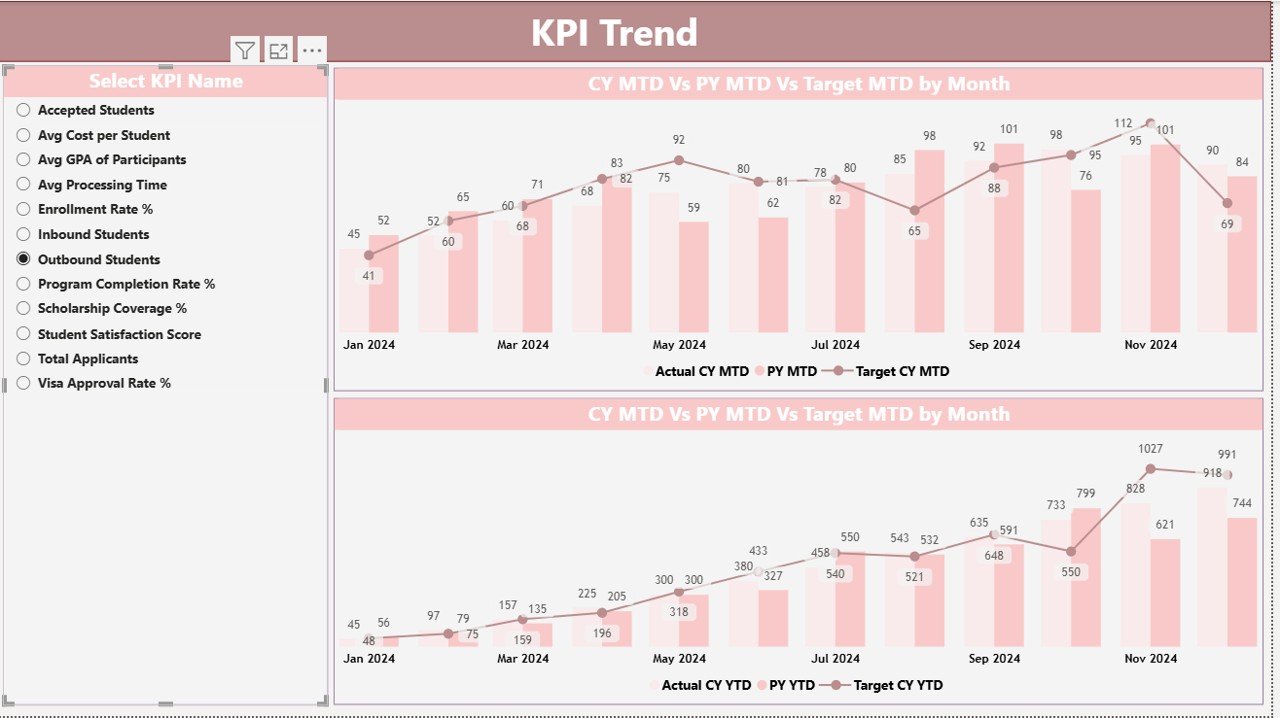
📉 Trend Analysis with Combo Charts – Compare current year, previous year, and targets visually.
🟢 Conditional Formatting Icons – Quickly identify target met or missed KPIs using up/down indicators.
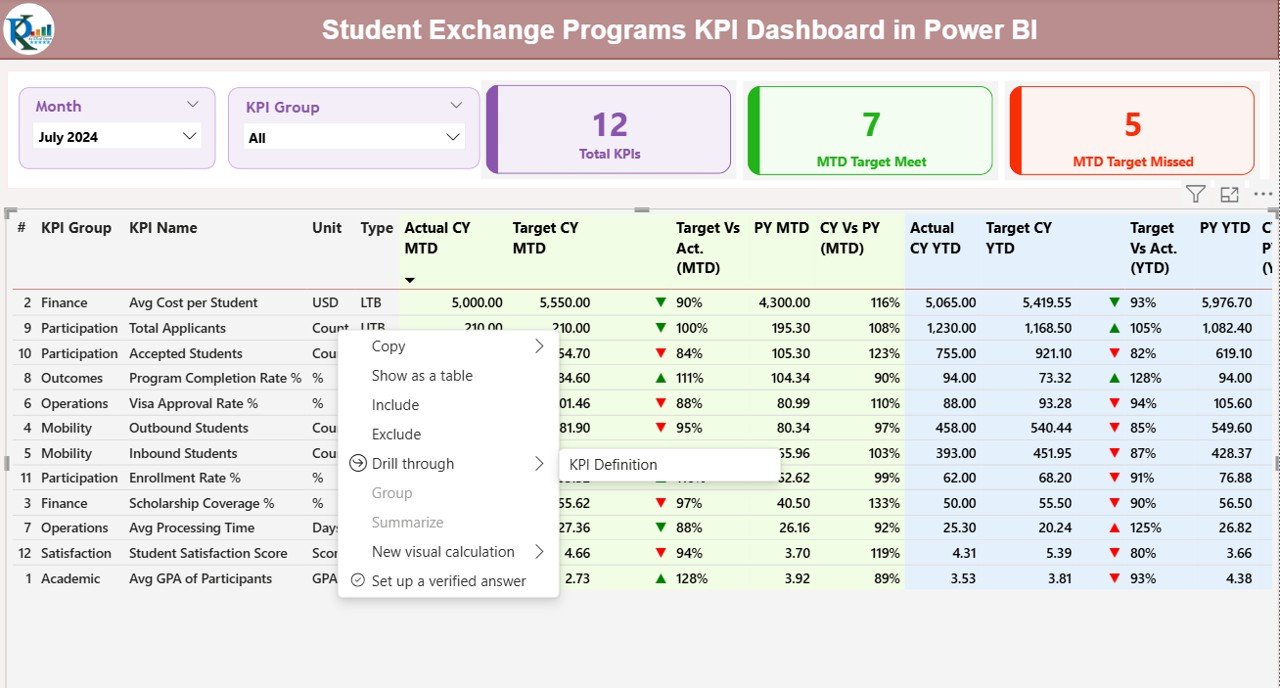
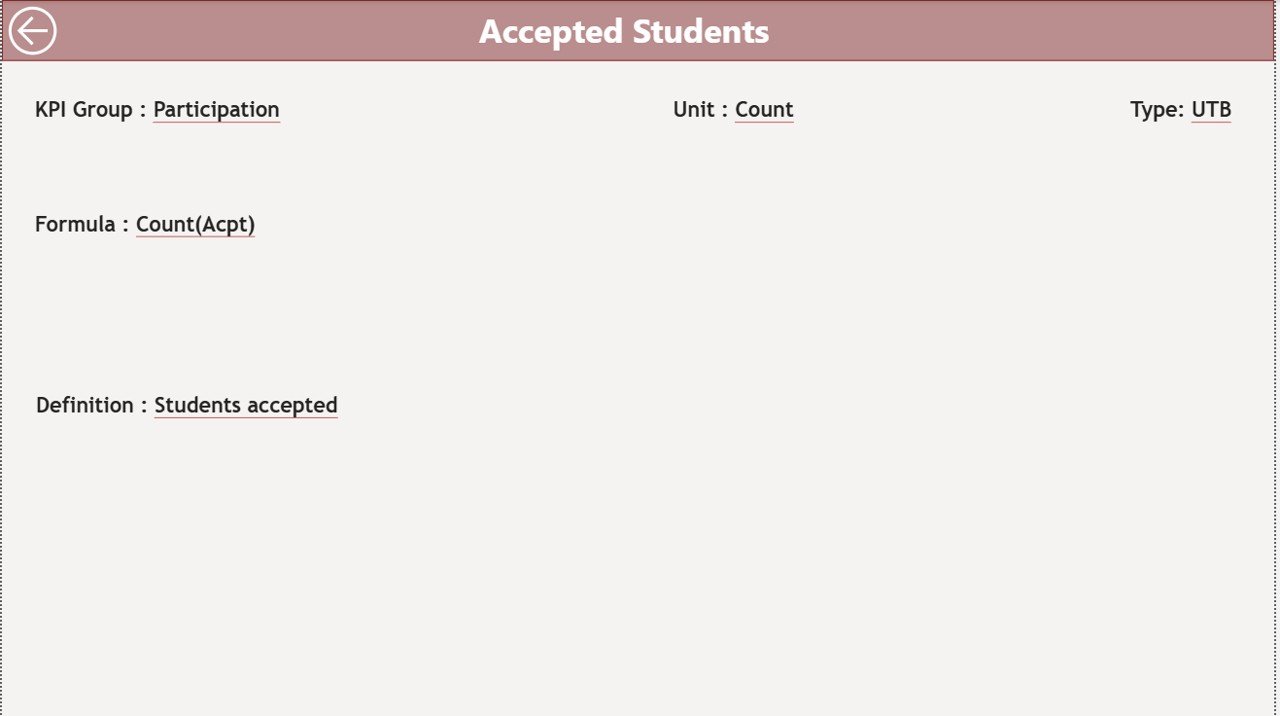
📘 Dedicated KPI Definition Page – View KPI formulas, units, and definitions with drill-through functionality.
🔄 Excel-Based Data Input – Maintain full control with simple and structured Excel data entry.
🔹 What’s Inside the Student Exchange Programs KPI Dashboard
This Power BI product includes three professionally designed dashboard pages and a structured Excel data model.
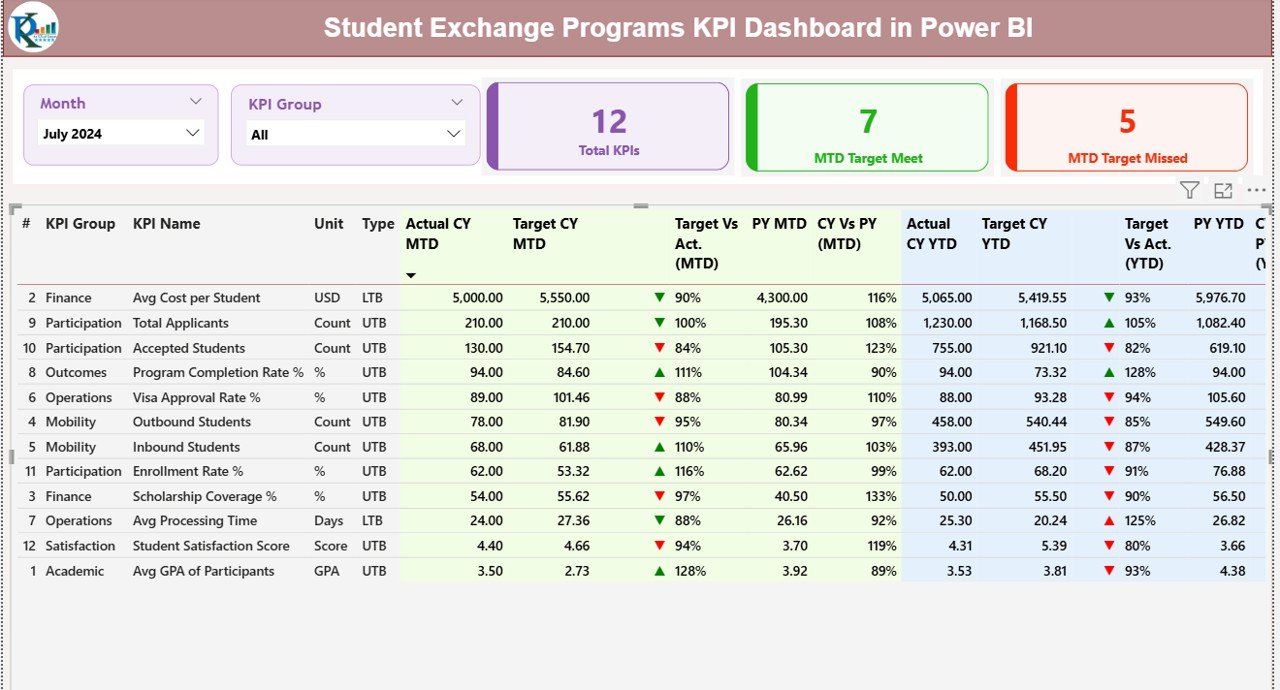
📌 Summary Page
-
KPI cards showing total KPIs, target met count, and target missed count
-
Detailed KPI table with MTD & YTD actuals, targets, previous year comparisons, and performance ratios
-
Interactive slicers for month and KPI group selection
📌 KPI Trend Page
-
KPI selection slicer for focused analysis
-
Combo charts comparing Actual vs Target vs Previous Year
-
Separate trend views for MTD and YTD performance
📌 KPI Definition Page
-
KPI number, group, unit, formula, and definition
-
UTB (Upper the Better) / LTB (Lower the Better) classification
-
Drill-through navigation with back button
📂 Excel Data Source
-
Input_Actual sheet for real performance data
-
Input_Target sheet for MTD and YTD targets
-
KPI Definition sheet to maintain KPI clarity and consistency
🔹 How to Use the Student Exchange Programs KPI Dashboard
Using this dashboard is simple and user-friendly:
📝 Step 1: Enter actual and target values in the provided Excel sheets
🔄 Step 2: Refresh the Power BI dashboard
🎛️ Step 3: Use slicers to filter by month or KPI group
📊 Step 4: Analyze KPI cards, tables, and trends
🎯 Step 5: Identify gaps, improvements, and growth opportunities
Because everything is automated, users focus on analysis instead of manual calculations.
🔹 Who Can Benefit from This Student Exchange Programs KPI Dashboard
🎓 Universities & Colleges – Track exchange performance across departments
🌍 International Relations Offices – Monitor partnerships and student mobility
🏫 Education Consultants – Present professional performance reports to clients
📑 Academic Administrators – Improve accountability and reporting accuracy
🏛️ Government Education Bodies – Analyze policy outcomes and participation trends
📊 Program Coordinators – Ensure targets are met on time
Both technical and non-technical users can use this dashboard with ease.
Click here to read the Detailed Blog Post
Watch the step-by-step video tutorial:


Reviews
There are no reviews yet.