Refinery operations demand precision, visibility, and fast decision-making. Every delay in identifying cost overruns, output inefficiencies, or energy consumption issues directly impacts profitability. However, when refinery data remains scattered across multiple spreadsheets and static reports, teams react late instead of acting early.
That is exactly why the Refinery Dashboard in Excel becomes a powerful, practical, and cost-effective solution for modern refinery management.
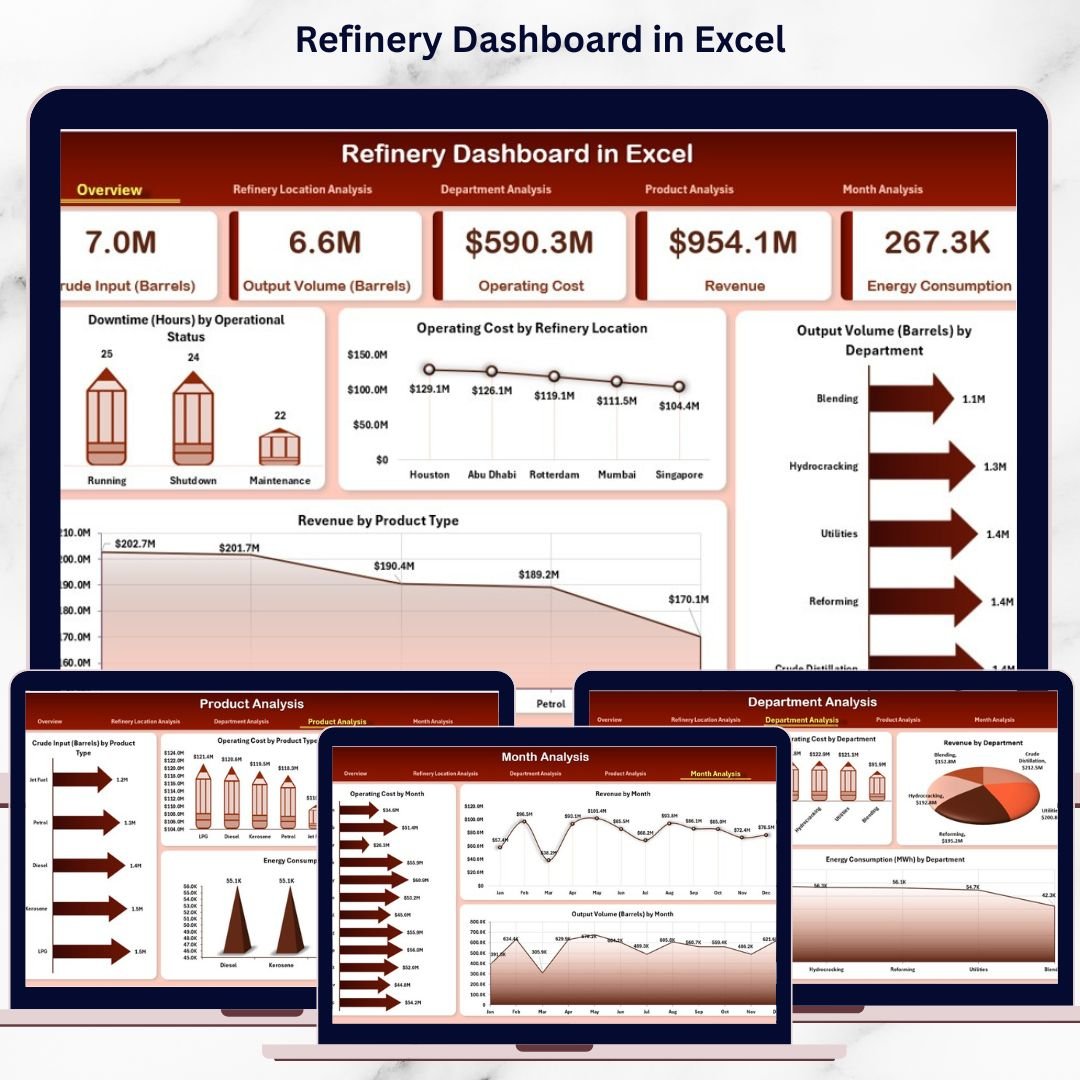
This ready-to-use Excel dashboard transforms raw refinery data into clear KPIs, interactive charts, and actionable insights. Instead of spending hours consolidating reports, refinery managers gain instant visibility into operations, costs, output, revenue, and energy usage—all from a single Excel file.
Built entirely in Microsoft Excel using pivot tables, formulas, slicers, and charts, this dashboard delivers enterprise-level analytics without expensive BI tools. As a result, refinery teams stay focused on performance improvement rather than manual reporting.
🔑 Key Features of Refinery Dashboard in Excel
📊 Centralized Refinery Performance Monitoring
Track operational, financial, and efficiency metrics in one interactive dashboard.
🧭 Page Navigator for Easy Navigation
Move instantly between analysis pages without scrolling or confusion.
🏭 Location-Wise Performance Analysis
Compare output, cost, energy usage, and revenue across refinery locations.
👥 Department-Wise Operational Insights
Identify cost-intensive and high-output departments quickly.
🛢️ Product-Wise Performance Tracking
Analyze crude input, output volume, energy consumption, and costs by product type.
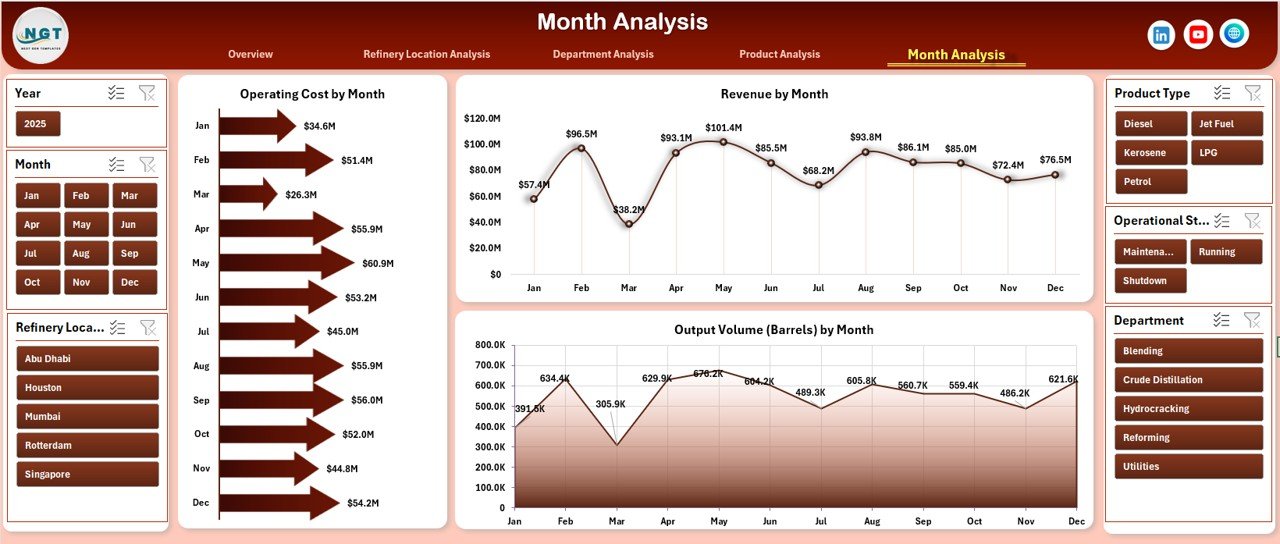
📅 Month-Wise Trend Analysis
Monitor seasonal patterns, growth trends, and cost fluctuations over time.
🎛️ Interactive Slicers
Filter data dynamically by location, department, product, or month.
⚙️ Excel-Only Solution
No macros, no external tools—just pure Excel power.
📂 What’s Inside the Refinery Dashboard in Excel
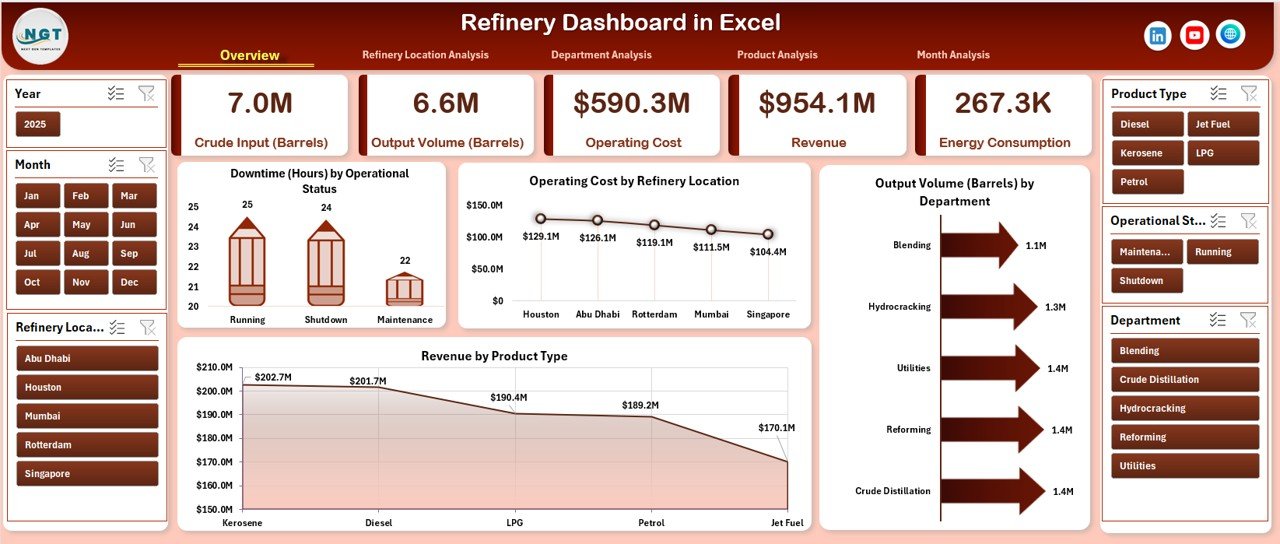
📄 Overview Page
High-level snapshot with KPI cards and key operational charts.
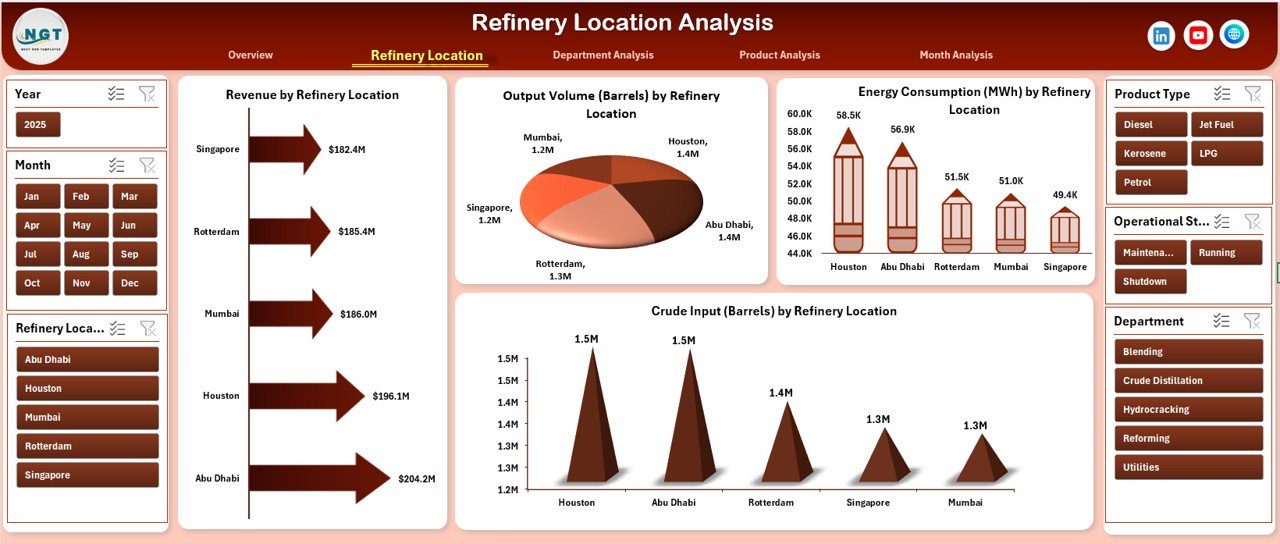
📄 Refinery Location Analysis Page
Performance comparison across refinery locations.
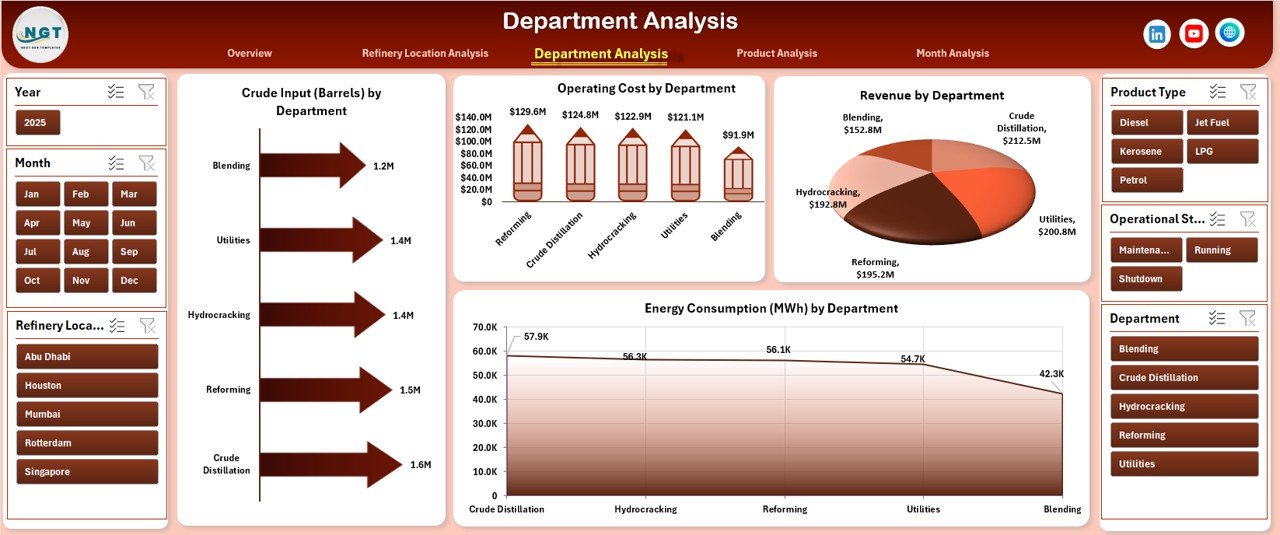
📄 Department Analysis Page
Operational efficiency and cost analysis by department.
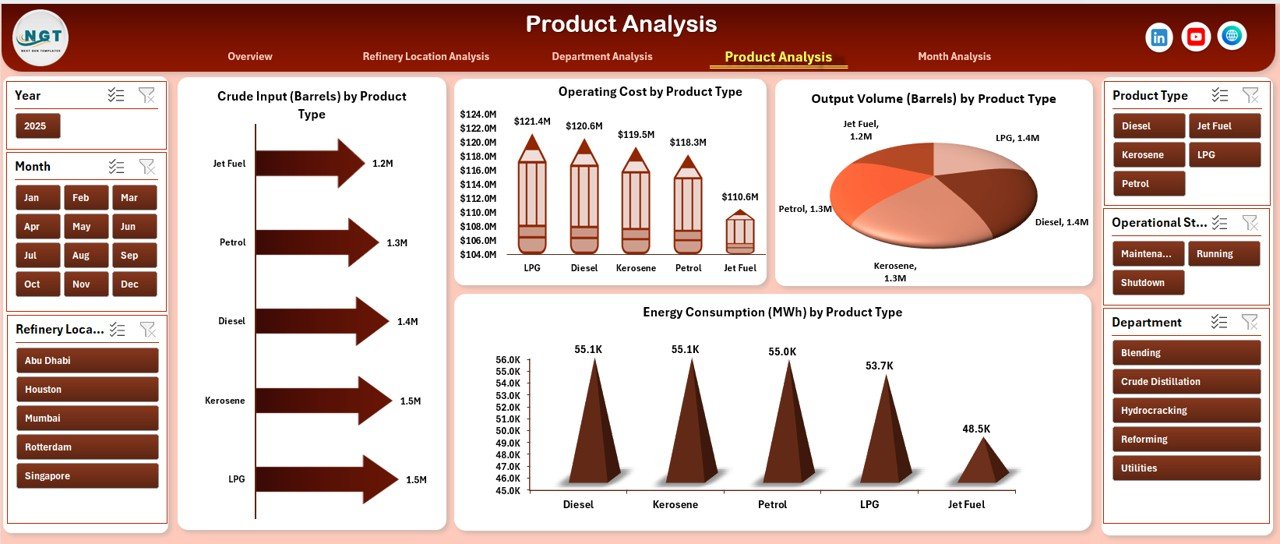
📄 Product Analysis Page
Product-wise input, output, cost, and energy insights.
📄 Month Analysis Page
Time-based trends for cost, revenue, and output.
📊 Data Sheet
Stores raw refinery data such as location, department, product, cost, revenue, output, energy, and time period.
🛠️ Support Sheet
Handles lookups, helper calculations, and slicer logic to keep the dashboard stable and fast.
Together, these components form a complete refinery performance management system in Excel.
🛠️ How to Use the Refinery Dashboard in Excel
1️⃣ Enter or update refinery data in the Data Sheet
2️⃣ Ensure data remains clean and structured
3️⃣ Refresh pivot tables if required
4️⃣ Use slicers to filter by location, department, product, or month
5️⃣ Review KPI cards and charts on the Overview Page
6️⃣ Navigate to detailed analysis pages using the Page Navigator
7️⃣ Identify inefficiencies and take corrective action
No advanced Excel skills are required. Anyone with basic Excel knowledge can use this dashboard confidently.
👥 Who Can Benefit from This Refinery Dashboard in Excel
🏭 Refinery managers and plant heads
📊 Operations and production teams
💰 Finance and cost-control departments
⚡ Energy and efficiency managers
📈 Planning and forecasting teams
🧑💼 Senior leadership and decision-makers
If your organization operates or manages refinery processes, this dashboard delivers immediate operational clarity.
📘 Click here to read the Detailed blog post
🎥 Visit our YouTube channel to learn step-by-step video tutorials
👉 YouTube Channel


Reviews
There are no reviews yet.