


Managing purchasing operations in a refinery is one of the most complex and high-impact responsibilities. Every decision involves high-value materials, strict compliance, multiple suppliers, and constant pressure to control costs. However, when purchasing performance is tracked through scattered Excel files and static reports, teams lose visibility, speed, and confidence. This is exactly where the Refinery Purchasing KPI Dashboard in Power BI becomes a powerful game-changer.
This ready-to-use Power BI dashboard is designed specifically for refinery purchasing and procurement teams who want clarity, control, and actionable insights—without manual reporting headaches. It transforms raw Excel purchasing data into clear KPIs, performance indicators, trends, and comparisons, enabling faster and smarter decision-making.
🚀 Key Features of Refinery Purchasing KPI Dashboard in Power BI
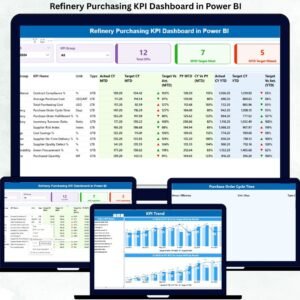
✅ Centralized Purchasing KPI Monitoring
Track all refinery purchasing KPIs in one interactive Power BI report instead of managing multiple spreadsheets.
📅 Dynamic Month & KPI Group Slicers
Instantly filter performance by reporting month or purchasing category for focused analysis.
🎯 MTD & YTD Target vs Actual Tracking
Monitor Month-to-Date and Year-to-Date performance with automatic calculations and indicators.
🚦 LTB & UTB KPI Logic Support
Built-in logic for Lower the Better and Upper the Better KPIs ensures accurate performance status.
📊 Detailed KPI Performance Table
Analyze Actual, Target, Previous Year, and percentage variance for both MTD and YTD.
📈 KPI Trend Analysis Page
Visualize purchasing trends over time with combo charts comparing Actuals, Targets, and Previous Year values.
🔍 KPI Definition Drill-Through Page
Understand KPI purpose, formula, and logic instantly without cluttering the main dashboard.
📁 Excel-Based Data Source
Simple, flexible, and scalable Excel input structure—no complex system integrations required.

📦 What’s Inside the Refinery Purchasing KPI Dashboard
When you purchase this dashboard, you get a fully structured Power BI solution with:
📌 Summary Page
A high-level overview showing total KPIs, MTD target met count, and MTD target missed count, along with a detailed KPI performance table.
📌 KPI Trend Page
Two powerful combo charts to track MTD and YTD performance trends across time for selected KPIs.
📌 KPI Definition Page
A drill-through page displaying KPI definition, formula, purpose, and type (LTB/UTB) for clarity and governance.
📌 Excel Input Templates
Pre-designed Excel sheets for Actuals, Targets, and KPI Definitions to keep data clean and organized.
🛠️ How to Use the Refinery Purchasing KPI Dashboard
Using this dashboard is simple—even for non-technical users:
1️⃣ Enter purchasing Actual values in the Input_Actual Excel sheet
2️⃣ Define Targets in the Input_Target sheet
3️⃣ Maintain KPI structure in the KPI Definition sheet
4️⃣ Refresh the Power BI report
5️⃣ Use slicers to analyze performance instantly
No advanced Power BI modeling or coding is required.
👥 Who Can Benefit from This Refinery Purchasing KPI Dashboard
This dashboard is ideal for:
👨💼 Procurement Managers – Monitor cost efficiency and supplier performance
📊 Purchasing Analysts – Analyze trends and variances easily
💰 Finance Teams – Track savings, compliance, and cost control
🔗 Supply Chain Managers – Improve vendor reliability and planning
🏭 Refinery Leadership – Make confident, data-driven decisions
Whether you manage daily procurement operations or strategic purchasing governance, this dashboard delivers value immediately.
Click here to read the Detailed blog post
Watch the step-by-step video tutorial:


Reviews
There are no reviews yet.